Expecting Bitcoin’s price to stay above $40K? This indicator gives its prediction
Bitcoin might present a last accumulation opportunity as its price might see a slight dip.

- Bitcoin’s RSI has stayed above 65 for the last few days.
- The king coin’s price remained above $41,000 despite a slight fall.
The surge in Bitcoin’s [BTC] value has generated excitement, with certain investors experiencing substantial profits. Nevertheless, certain important indicators suggest caution, particularly in the short run.
Bitcoin stays in the oversold zone
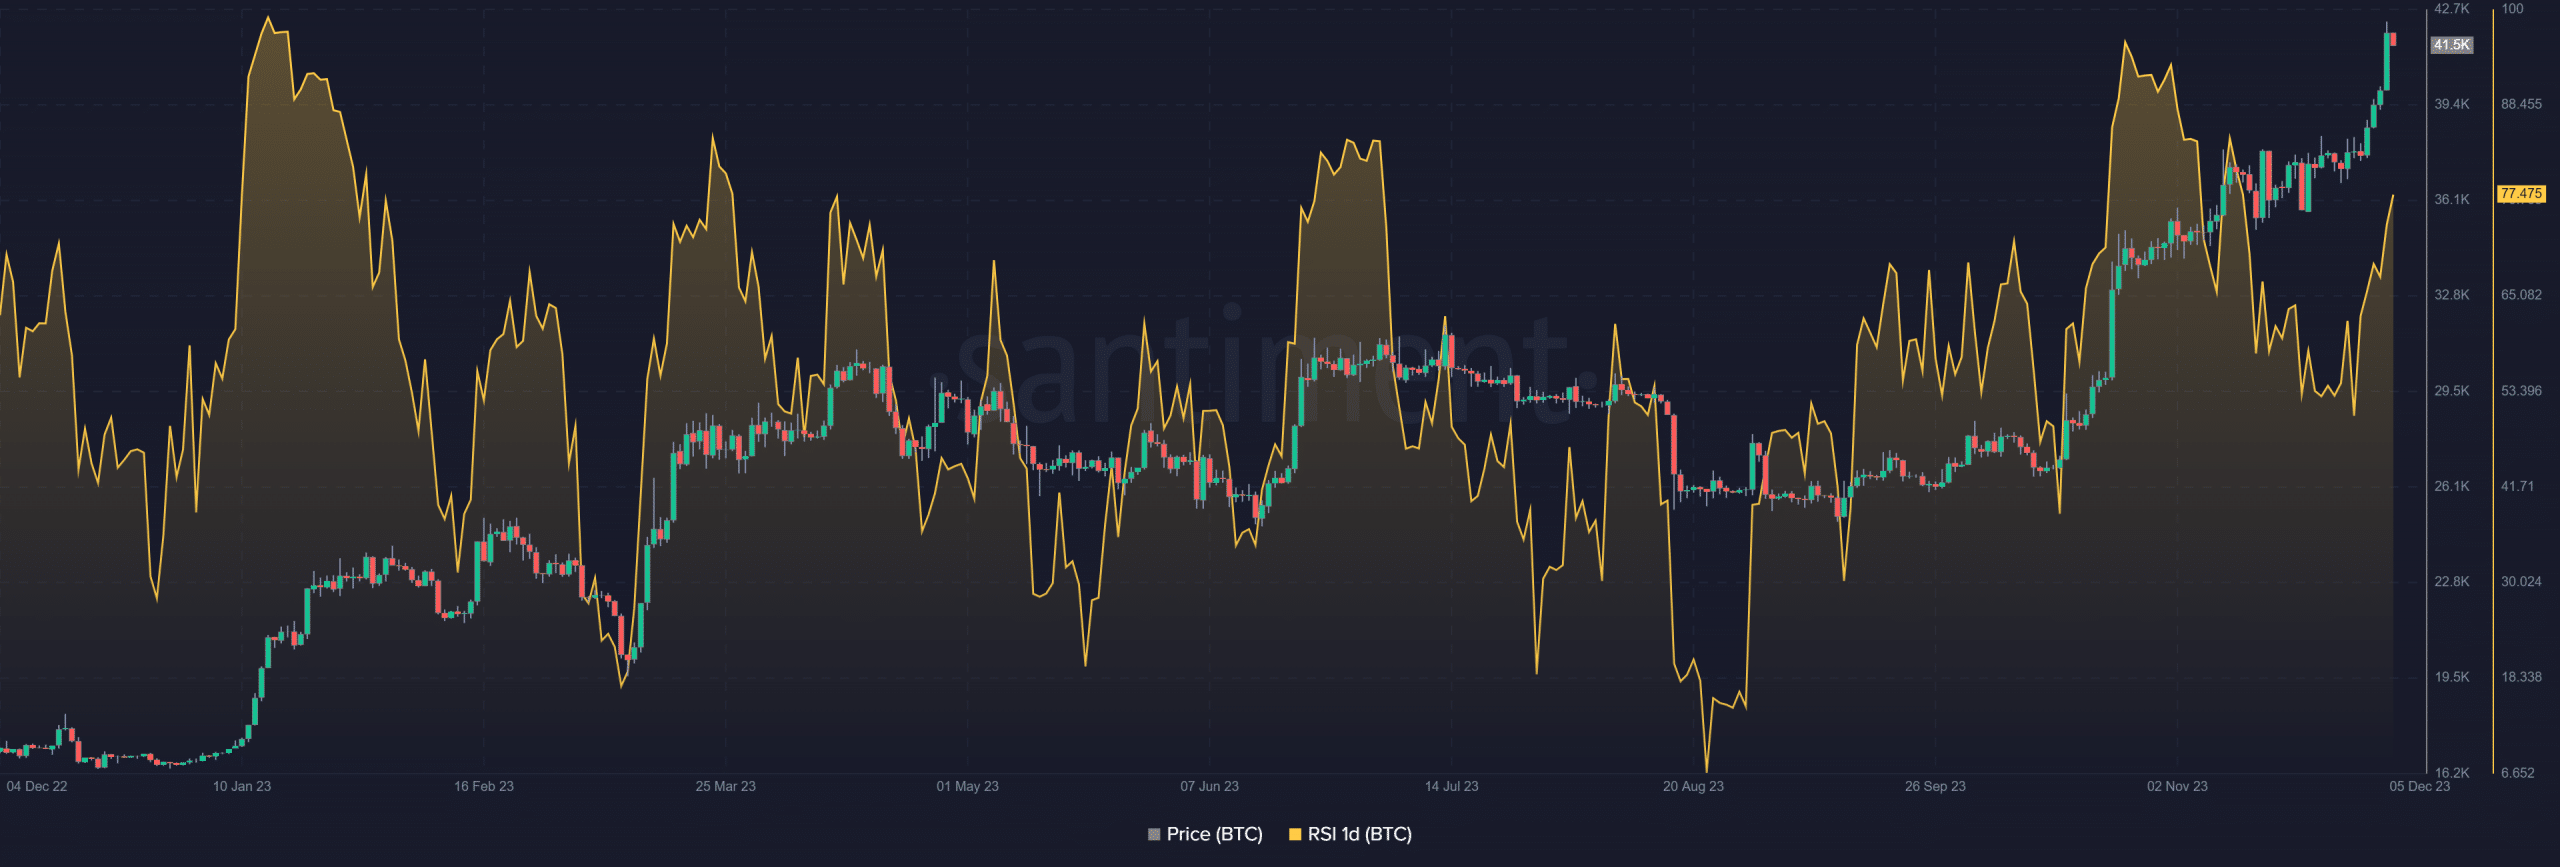
In a recent update by Santiment, a crucial Bitcoin metric, the Relative Strength Index (RSI), saw a rise alongside its rising price. Examination of the daily RSI showed that it has consistently been over 65 since the start of December.
This trend had been on even when Bitcoin was valued below $40,000. At the time of this writing, the RSI was around 77. This ongoing trend suggested that BTC was in an overbought condition at press time.
Consequently, a price correction is possible if this situation persists for an extended period.

180-day Bitcoin MVRV shows more signs of caution
The analysis of Bitcoin’s 180-day Market Value to Realized Value ratio (MVRV) has highlighted two significant signals.
First, it indicated that investors during this period have realized substantial profits, suggesting a potential forthcoming decline in price. As of the latest data, the 180-day MVRV was around 32%.
This implied that individuals who purchased Bitcoin before the recent surge have witnessed a 32% increase in the value of their holdings.
Secondly, the elevated level of MVRV indicated that BTC might experience a dip below its price time price range. However, considering the prevailing trend, this decline is likely to be temporary.
A more noteworthy price movement could follow shortly after the dip, marking the beginning of a full-fledged bull run.
BTC sees a slight decline
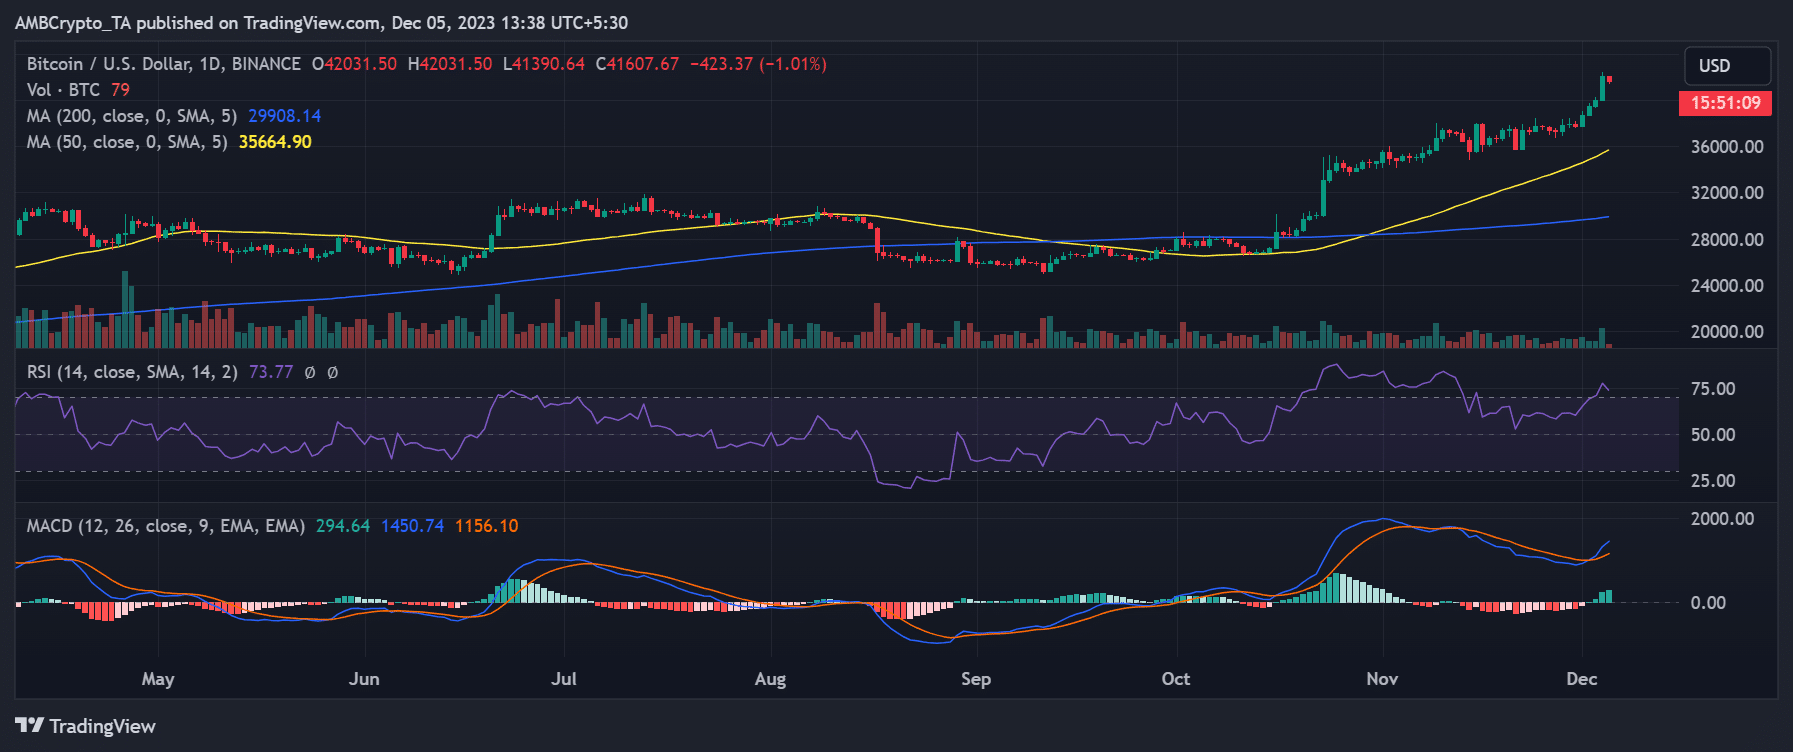
According to AMBCrypto’s analysis of the daily timeframe chart, Bitcoin concluded trading on the 4th of December with a notable 5% surge in value. This marked the pinnacle of a four-day upward trend that propelled its price above $40,000.
However, as of this writing, Bitcoin experienced a marginal 1% decrease in value. Despite this slight decline, the price has managed to stay above the $41,000 range.
Read Bitcoin’s [BTC] Price Prediction 2023-24
A more significant price movement for Bitcoin is anticipated if the Relative Strength Index (RSI) remains consistently below 65. It remains uncertain whether the current decline in price indicates a diminishing level of excitement.
However, if the downward trend persists, it could serve as a signal for an impending price upswing.


![Ethereum [ETH]](https://ambcrypto.com/wp-content/uploads/2026/07/Editors-2026-07-05T102620.520-e1783227455869.jpg)