Failed BEAT push toward $4 threatens a correction below $2
The rejection from above the $3 supply zone indicated bears have the upper hand in the short-term.

Audiera [BEAT] witnessed a 12.4% price correction in the past 24 hours. The Open Interest also slumped by 19.85% in the same time period. A week ago, the token gained 50% in a day and appeared to be recovering from a deep correction.
The funding rate was starting to turn negative, Coinalyze data warned. This meant that speculative traders were willing to pay funding to keep their positions open, signaling bearish market sentiment and aggressive short selling.
AMBCrypto had warned that sustained buying pressure is needed to keep BEAT’s bullish recovery going. Though the $2.64 local resistance was breached, the altcoin did not manage to clear the $3.70 hurdle and bound past $4.
The bullish long-term structure is at odds with BEAT expectations
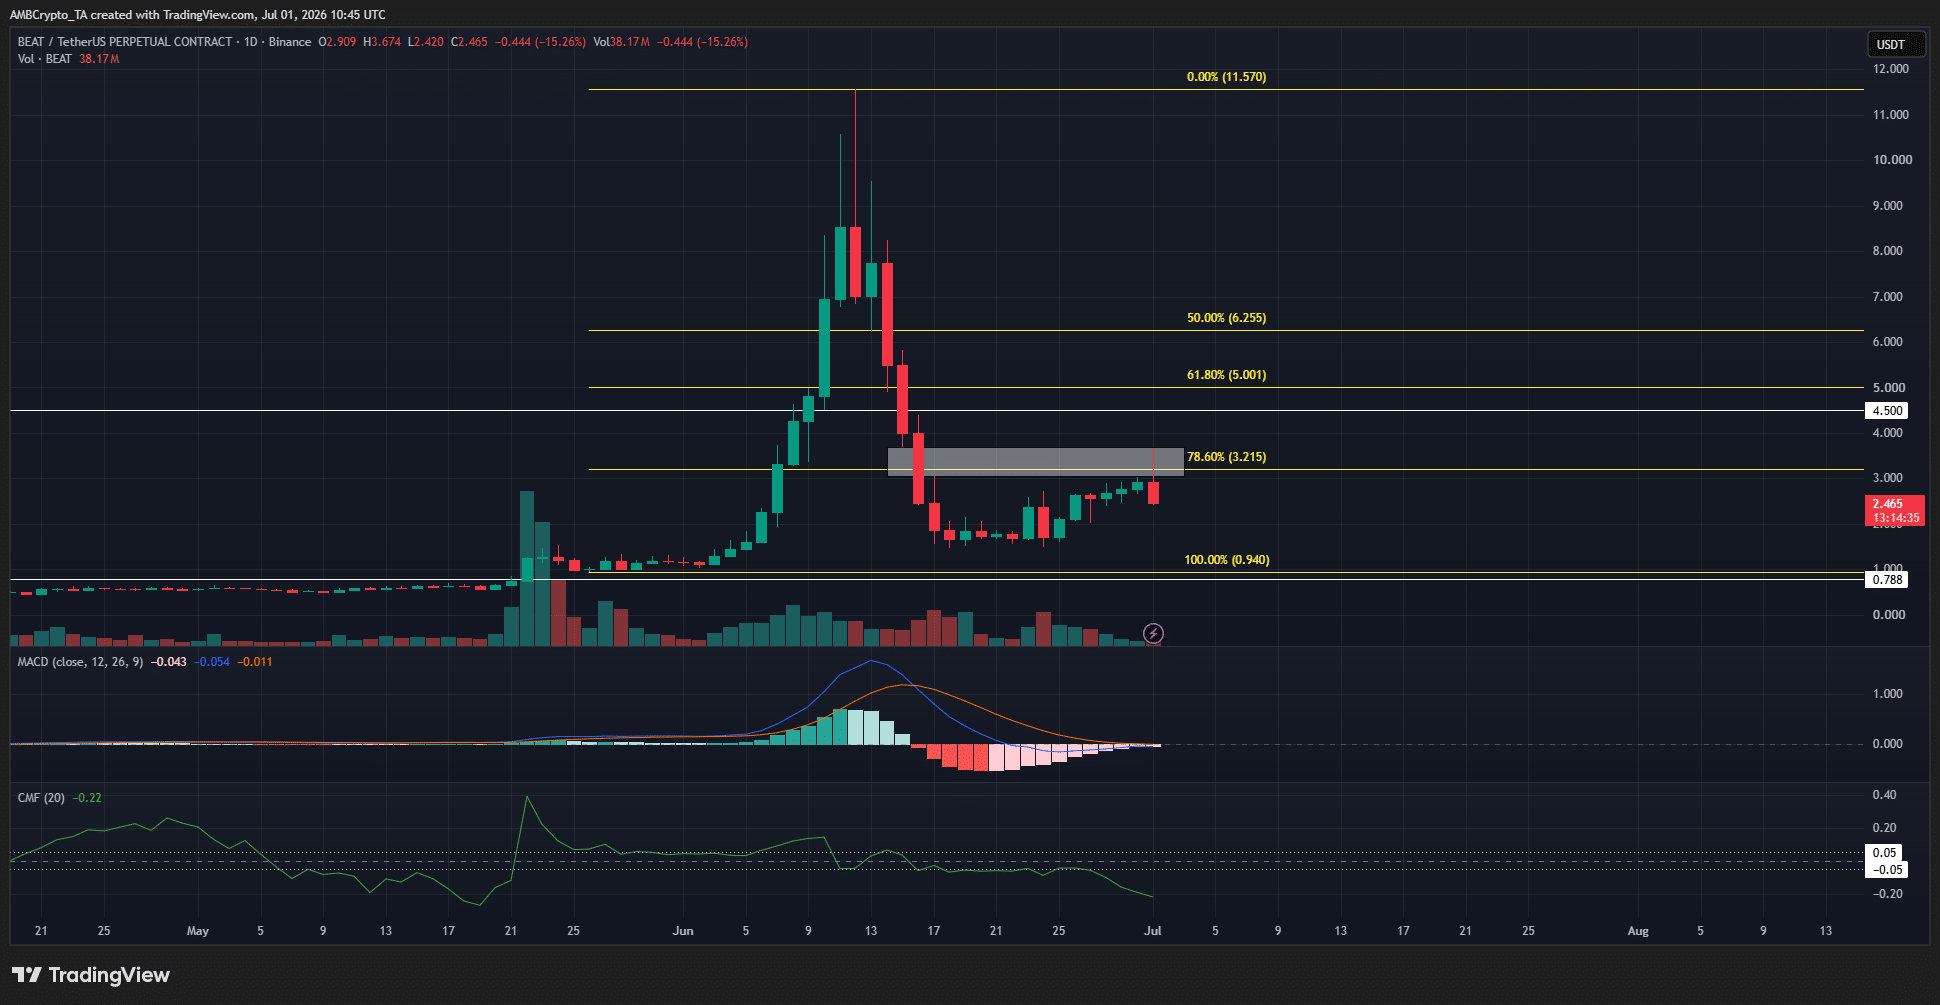
On the 1-day chart, the bullish swing structure remained intact. The swing low at $0.94 remained unbroken, keeping this upward bias alive. Yet, the technical indicators were flashing insistent warning signs.
The CMF was at -0.22, showing heavy capital outflows and selling pressure. The MACD was also moving below the zero line and has not undone the bearish crossover it made in mid-June.
Together, they capture the downward pressure on BEAT.
The price action also revealed a crucial clue. The fair value gap [white box] from $3.04-$3.68 was a key local supply zone. In recent hours of trading, Audiera token prices swept this area and have faced nearly 35% losses within 10 hours.
The failure to reclaim this FVG, which also coincided with the 78.6% Fibonacci retracement level, was a sign of bearish strength.
Traders’ call to action- Wait
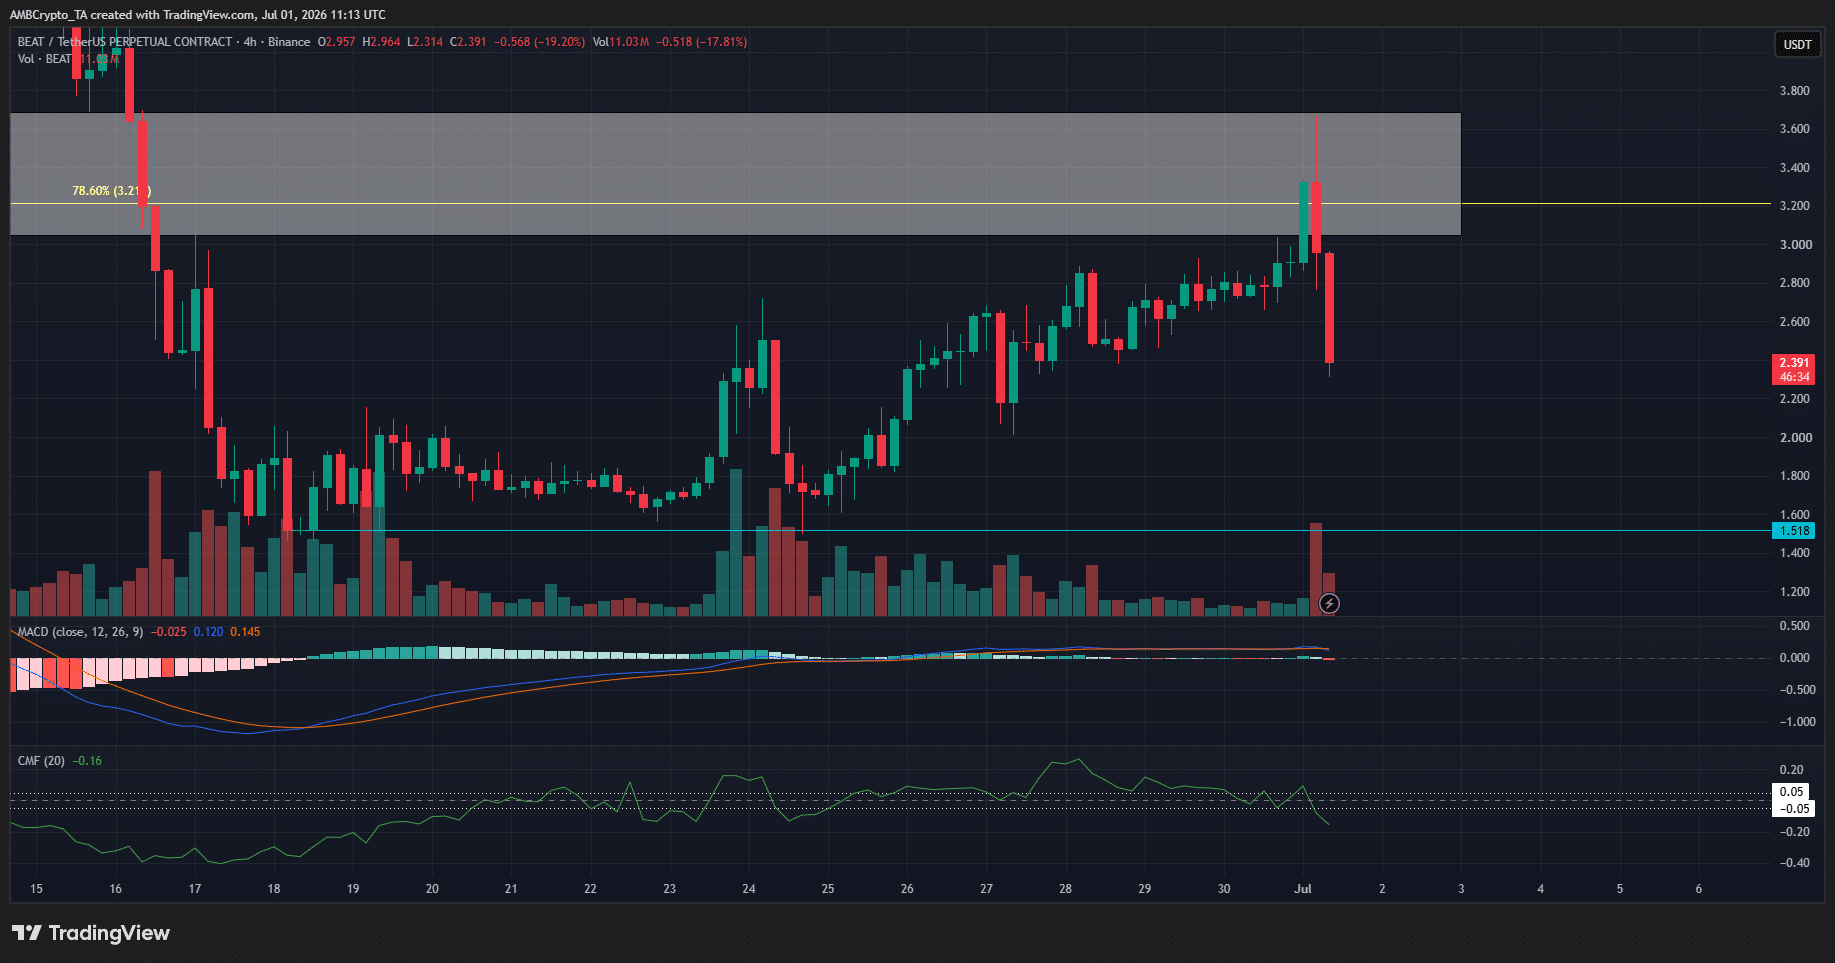
The 4-hour chart showcased the rejection from $3.68 better. Though the short-term structure is bullish, the CMF has flipped negative, and the MACD made a bearish crossover.
It appeared that a price drop was likely. The $1.51 local support zone needs to be breached to give traders a clear sell signal.
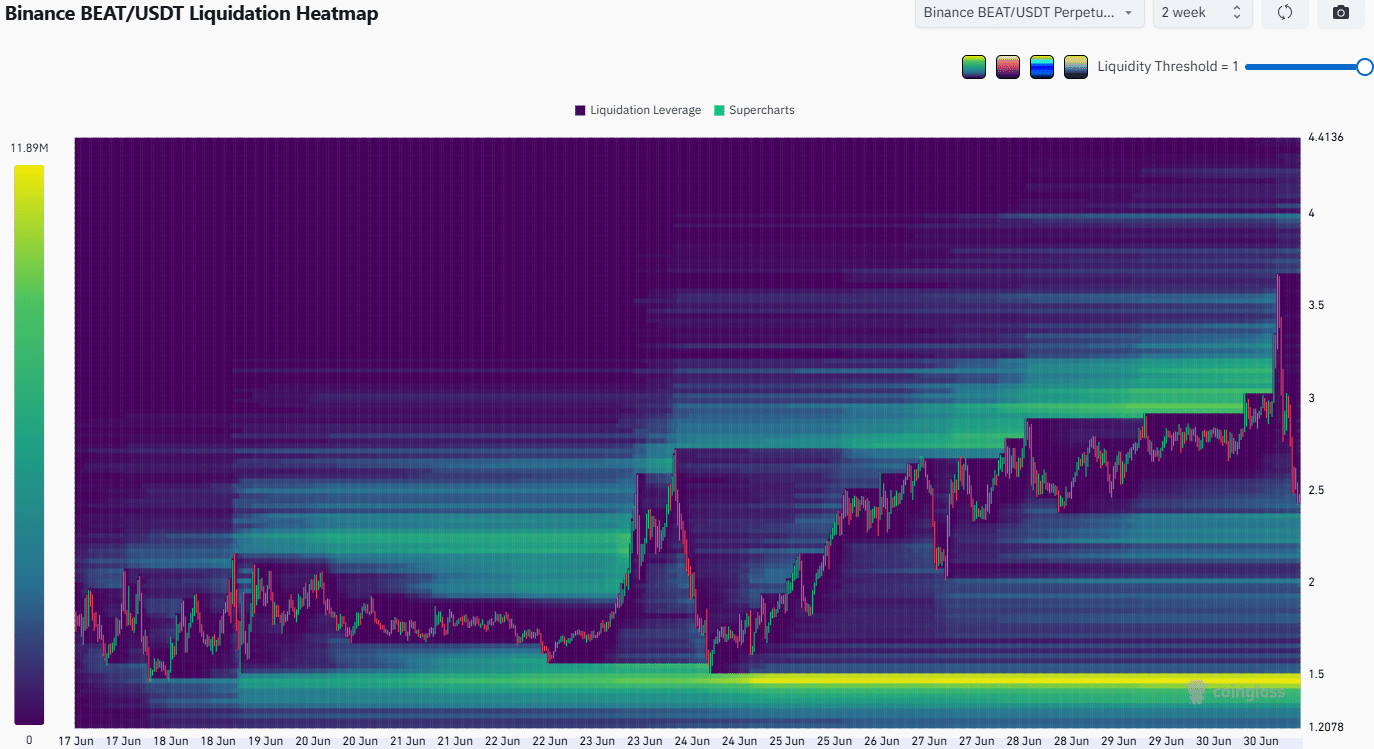
The liquidity around $3 has been swept, and the $1.5 area is the next magnetic zone of interest, the liquidation heatmap concurred.
This is the short-term expectation for BEAT- a potential correction toward $1.5. It remains to be seen if the buyers are strong enough to defend this local support, or if the market-wide malaise would beat down BEAT prices.
Final Summary
- The BEAT long-term price structure remained bullish.
- The rejection from above the $3 supply zone indicated bears have the upper hand in the short-term and could force a correction towards $1.50.