Fantom: Assessing the chances of a 20% plunge in September

Disclaimer: The information presented does not constitute financial, investment, trading, or other types of advice and is solely the writer’s opinion.
Fantom has traded within a range since the sharp drop in early May. This four-month-old range was yet to be broken. In the past ten days, the price moved beneath the mid-point of the aforementioned range.
Bitcoin also looked bearish on the price charts, and the month of September could see further losses. Such a move downward for Bitcoin could see Fantom shed value as well, to reach its range lows.
FTM- 1-Day Chart
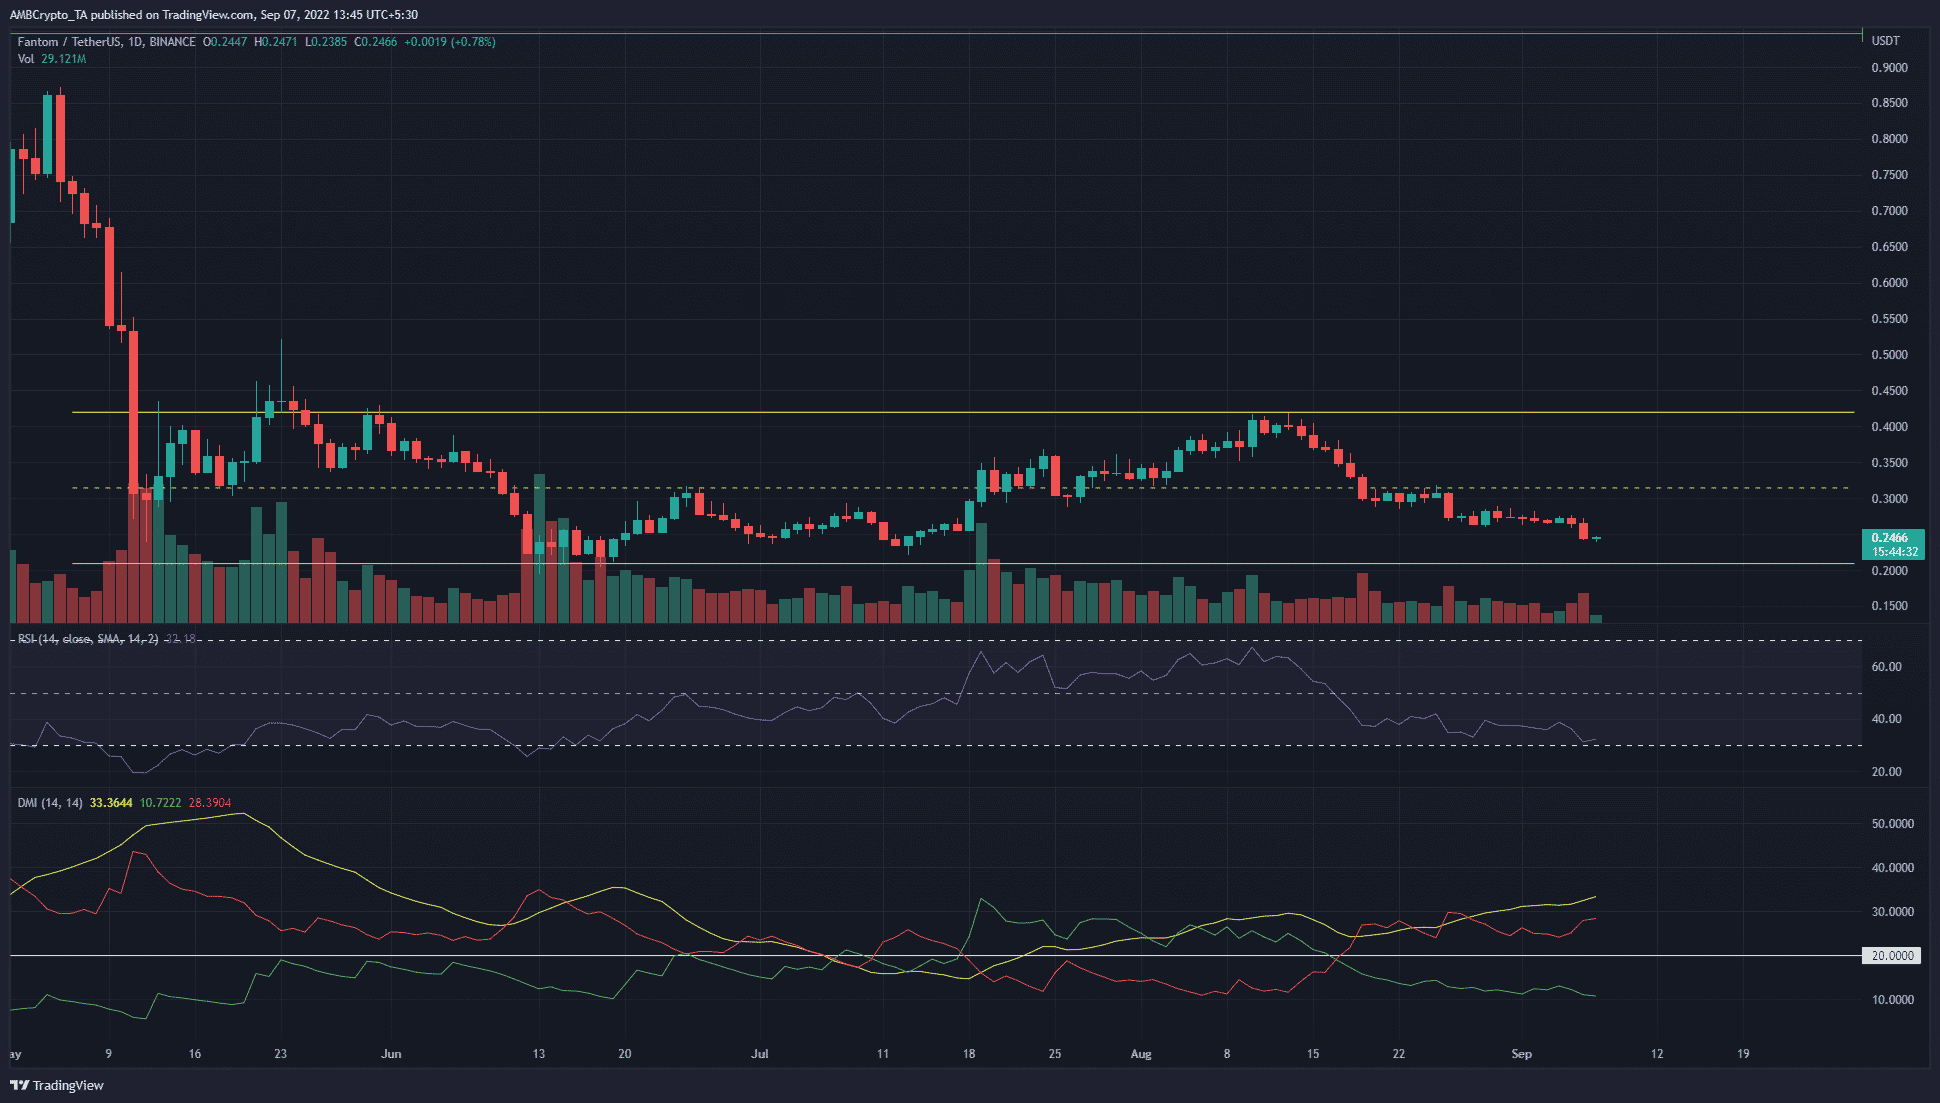
On the daily timeframe, the range (yellow) on the price chart was from $0.42 to $0.2. Its mid-point sat at $0.32. In August, this level was flipped from support to resistance on the daily timeframe. On shorter timeframes, FTM has been in a downtrend since early August.
At the same time that the mid-point was broken as support, the RSI also fell beneath the neutral 50 mark. This showed growing bearish sentiment. The DMI also saw its ADX (yellow) and -DI (red) continue to ascend above the 20 mark. The inference was, once again, the strengthening of a downward trend.
FTM- 1-Hour Chart
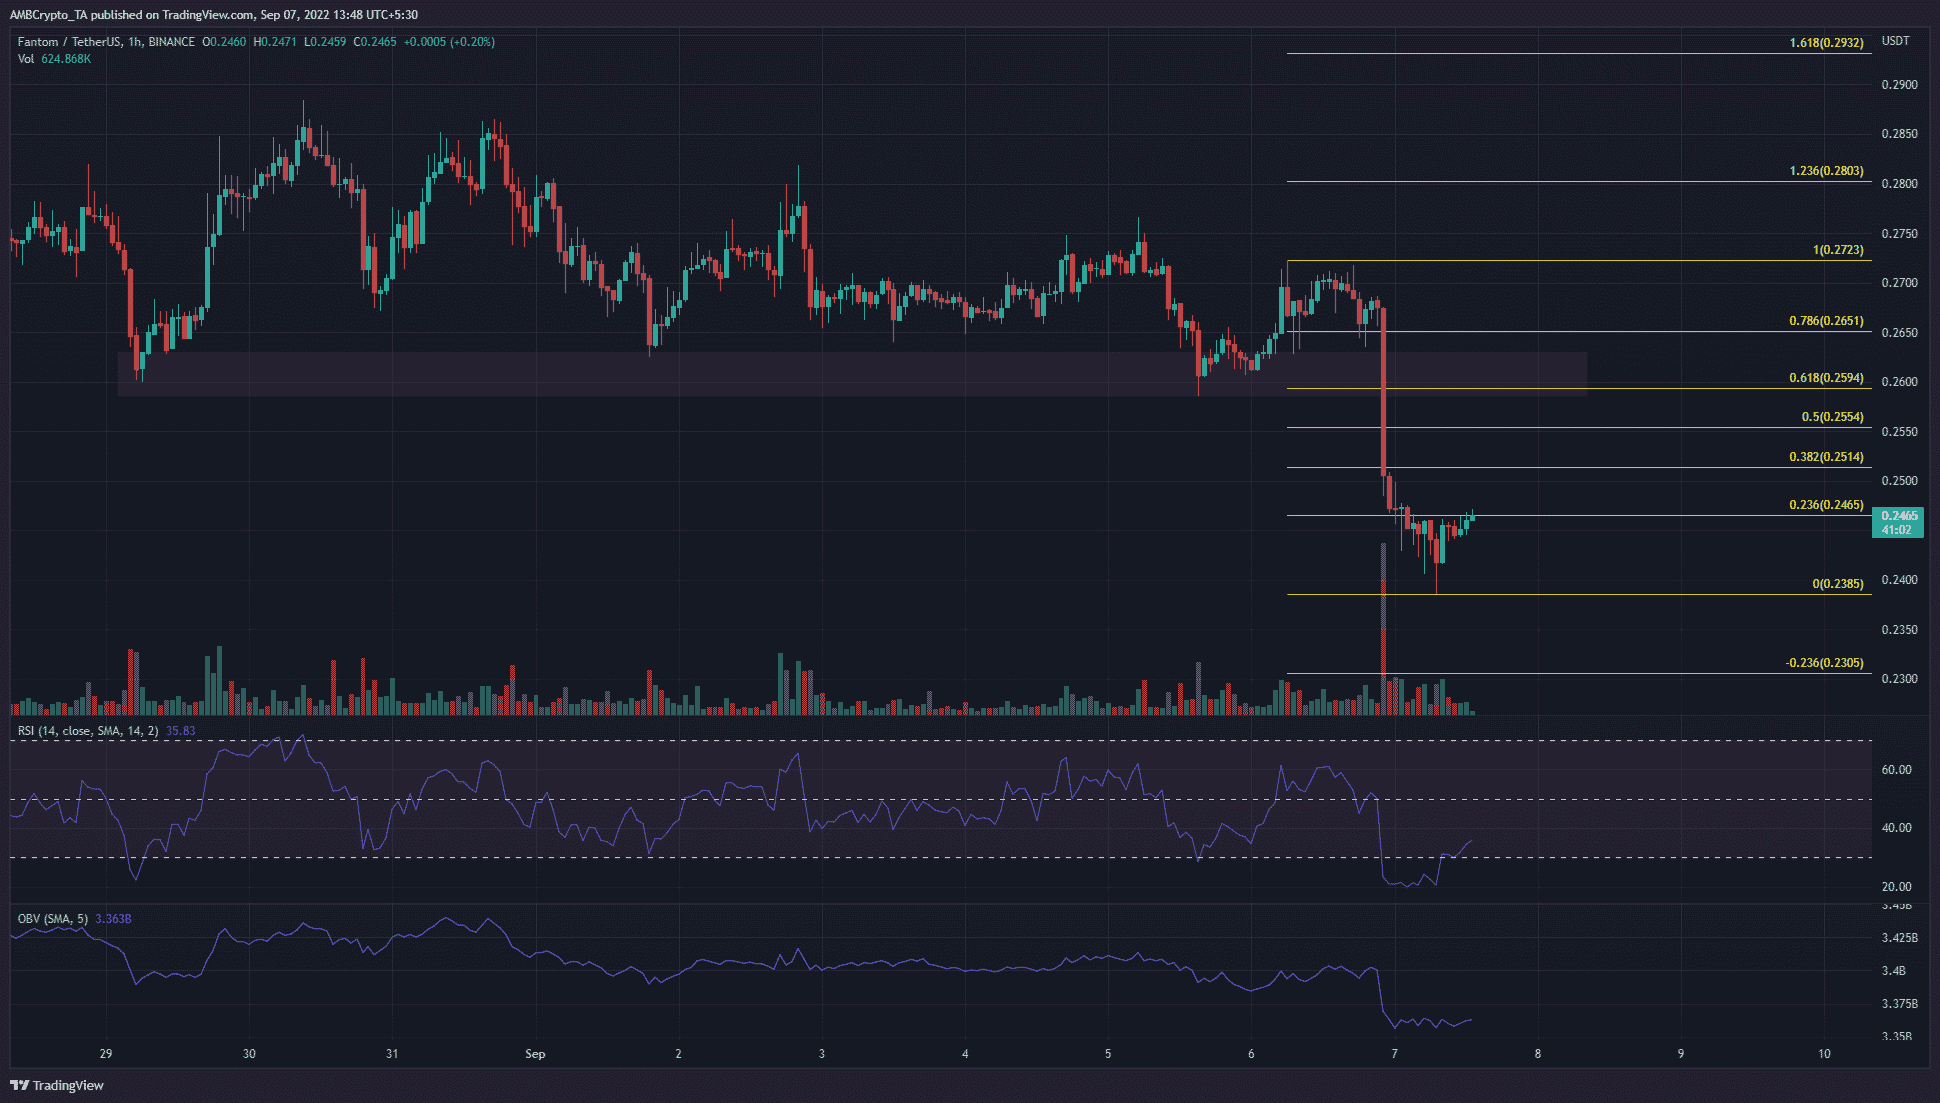
On the hourly chart, the past ten days saw the volatility reduce. The price hugged the $0.26 support zone as it bounced weakly off the same area. Eventually, the bulls were exhausted. The sharp drop of the previous day saw FTM create a large candle downward.
A set of Fibonacci retracement levels (yellow) were plotted. The 50% and 61.8% retracement levels were at $0.255 and $0.259. These two levels were just below the former demand zone (red box) on the charts.
The RSI was firmly bearish and clambered above the 30 mark, but the sellers still held sway. The OBV also saw a sharp drop to highlight heightened selling volume in recent hours.
Conclusion
The daily timeframe chart showed that a move to the $0.2 region could offer an attractive buying opportunity. In the meantime, the higher timeframe bias was southward.
On the hourly chart, a bounce toward the $0.25 area could materialize. Such a move would be safer to sell than to buy. The bears have shown their dominance yet again, and the market structure did not encourage buying. The 23.6% extension level at $0.23 can be used to take profit on shorts from the $0.25 zone.