Fantom at a crossroads in the near term, but where can it go from here

Disclaimer: The findings of the following analysis are the sole opinions of the writer and should not be considered investment advice
In the near-term, Bitcoin seemed to near a level of resistance at $40.6k. In fact, even the region from $38.9k-$39.2k has been a place where sellers have been strong in the past week. It is not yet clear whether Bitcoin can push higher, although there is a possibility it could push as high as $42k. This could drag the rest of the market higher as well.
Fantom has slipped beneath the $2.02-area over the past few days, but has recovered quite quickly and has retested the aforementioned level as support twice in the past couple of days. Can demand step in and drive prices past the $2.15-mark?
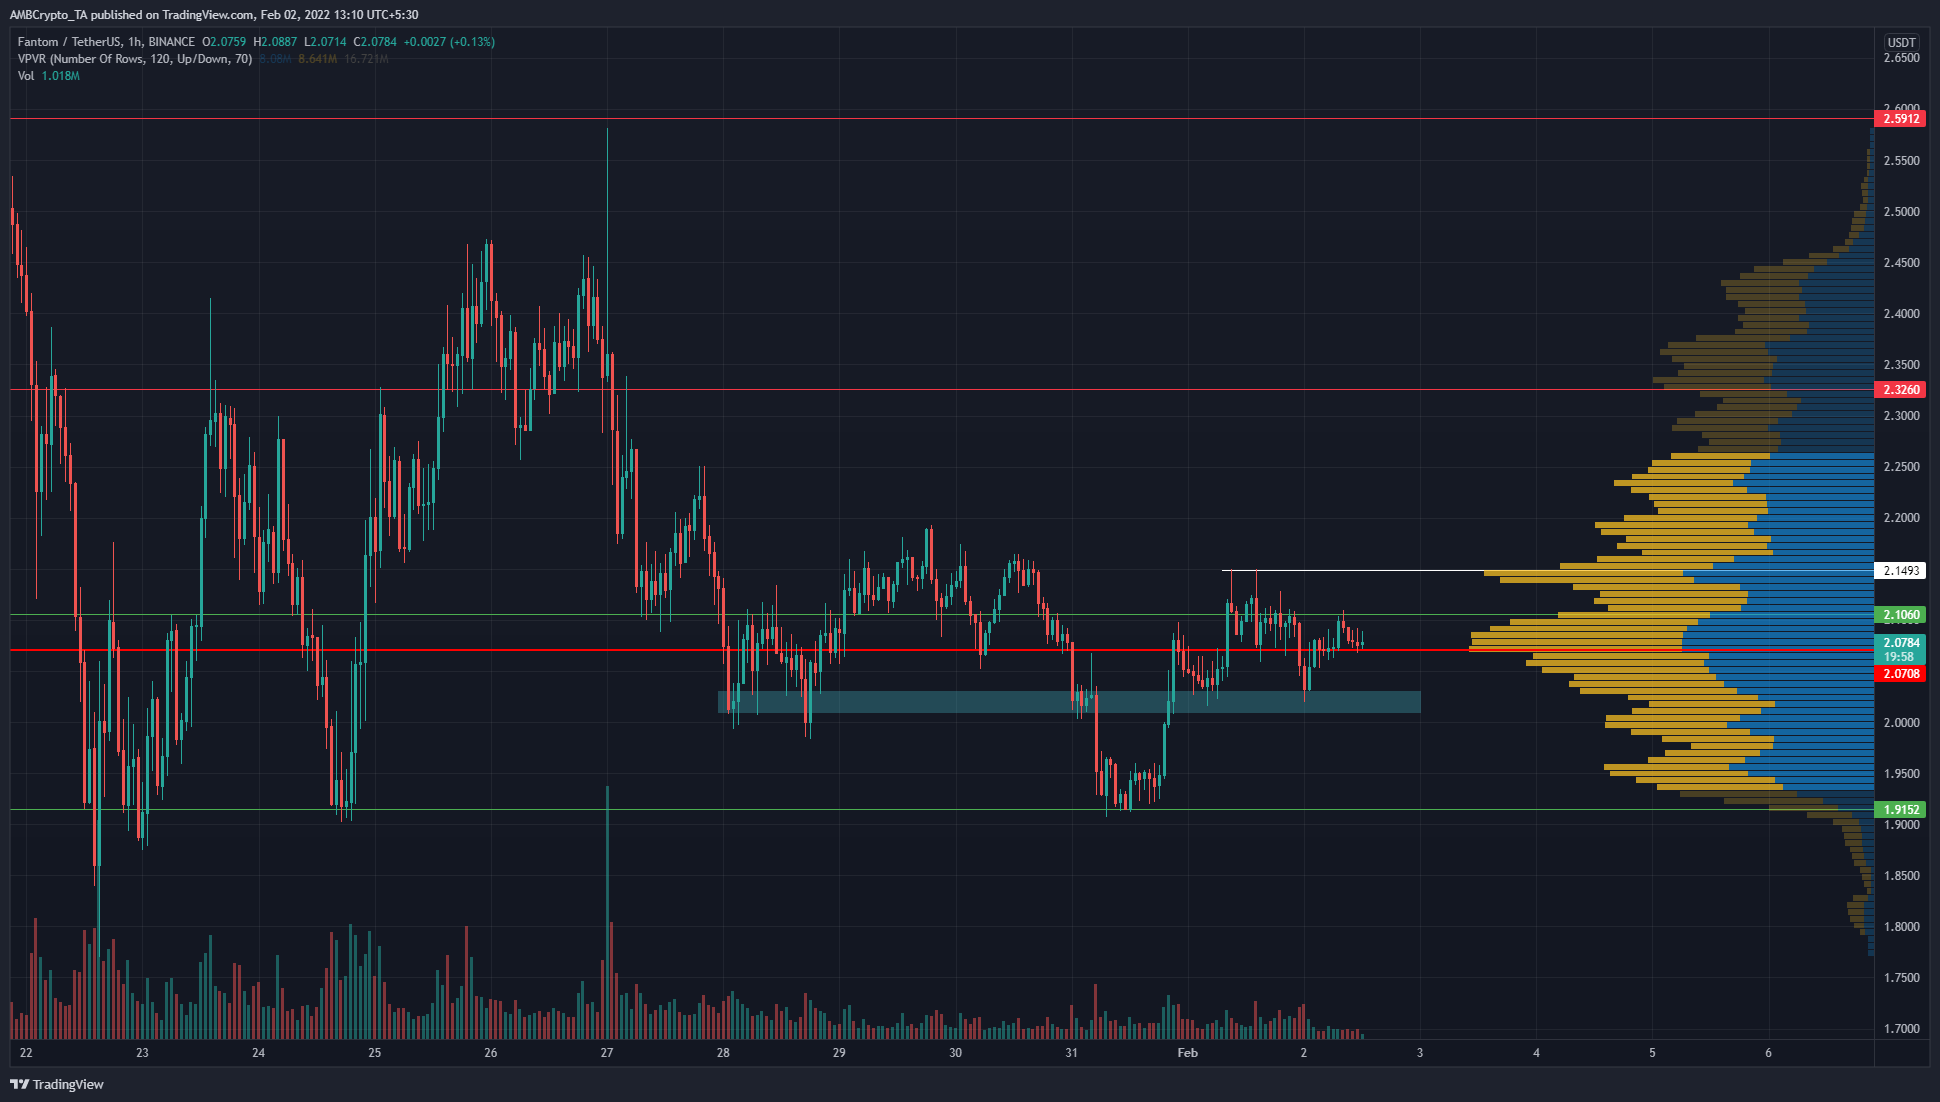
Over the next few days, the levels of importance are the demand area around $2-$2.02 (cyan box), and the previous lower highs at $2.14 (white). There has been some bullish reaction at the $2 area in the past couple of days, although sellers have been able to force the price as low as the $1.91 support once they managed to push prices beneath $2 – A scenario that could repeat if Bitcoin faces strong selling pressure.
The previous lower highs at $2.14 have been candlewicks, which indicated strong selling. Ideally, bulls would have to force a session close above this level and retest it as support to indicate that the market structure had indeed flipped bullish in the near term.
However, last month, the longer-term bullish market structure was broken and the $2.2-$2.32 area was hotly contested, with bears coming out on top over the past week.
Rationale
On the Visible Range Volume Profile, the $2.07-level has been marked as the Point of Control (PoC), a place with the highest visible trading volume. The $2.14-level also coincided with a high volume node on the VPVR. It highlighted how important this level was on the lower timeframes.
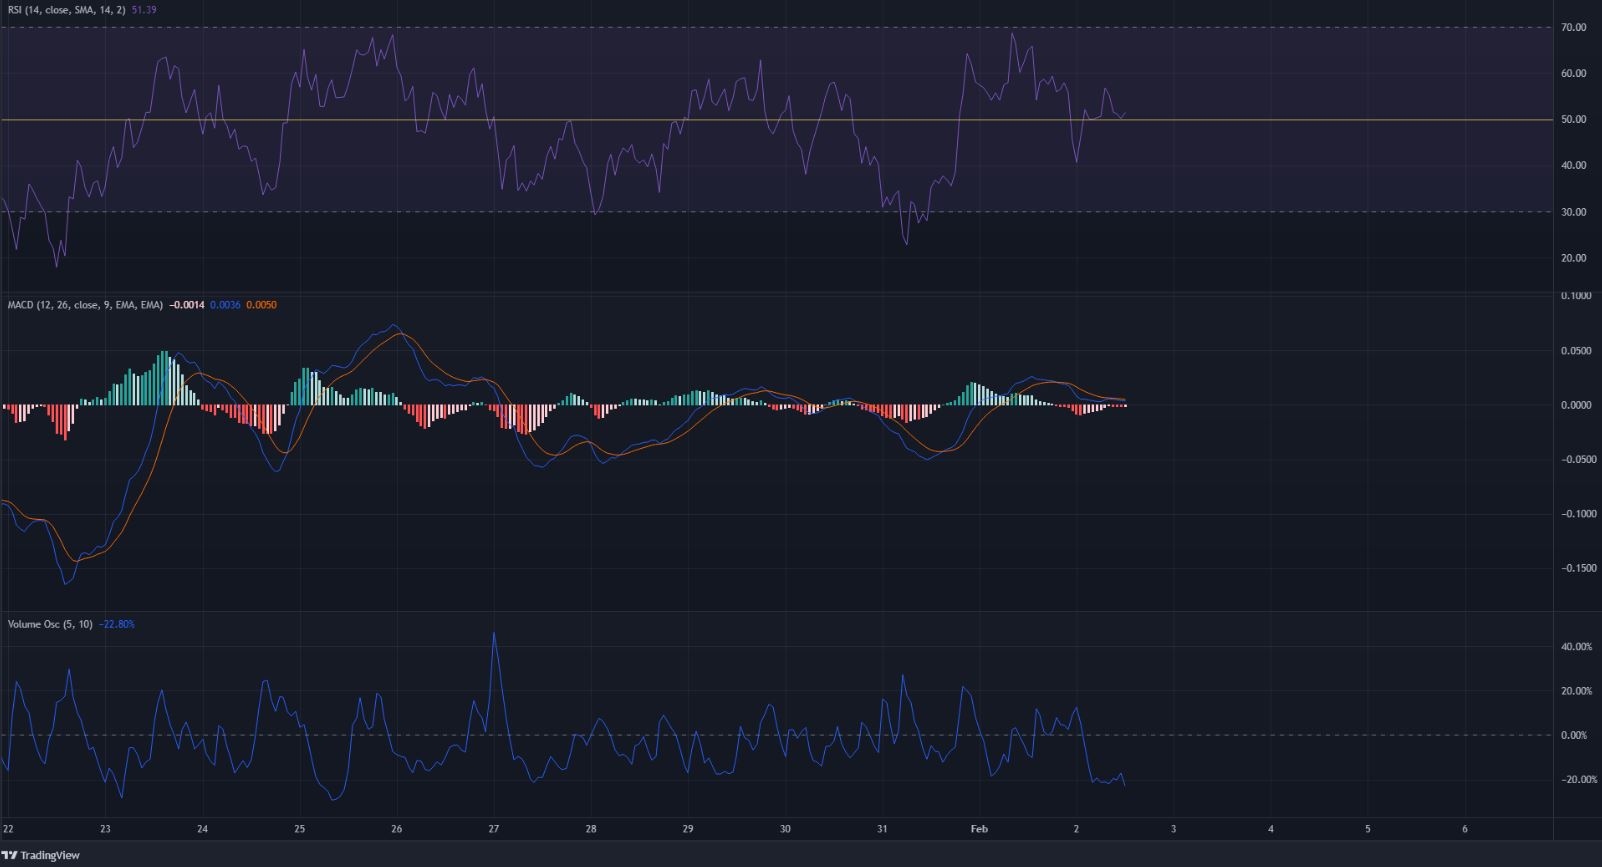
The RSI hovered above neutral 50, but there has been no real trend in the past few days as FTM appeared to oscillate between $2.02 and $2.14. The MACD was just barely above the zero line, which once more showed that momentum did not lean strongly in either direction yet.
The Volume Oscillator highlighted how a test of the $1.91-support and $2.14-resistance over the past few days have seen a heavy uptick in volume.
Conclusion
The $2.02, $2.14, and $1.91-levels are the ones to watch out for in the next few days. A move above $40.6k for BTC can see Fantom climb to $2.32-$2.38, or even as high as $2.57.
This would likely be followed by a move downward for Fantom.