Fantom [FTM]: More addresses and transactions, but what about DeFi TVL
![Fantom [FTM]: More addresses and transactions, but what about DeFi TVL](https://ambcrypto.com/wp-content/uploads/2023/03/larry-costales-bidi8u2gTwc-unsplash-1.jpg)
- Fantom has seen increased ecosystem growth in the last month.
- FTM’s price, however, continues to plummet.
Following the launch of its go-opera version 1.1.2-rc.5 mainnet upgrade on 6 March, blockchain platform Fantom [FTM] saw a spike in user activity on the chain.
According to Token Terminal, on 7 March, Fantom registered 187,237 active users, its highest daily count this year. This represented a 322% increase from the 44,324 daily active users that interacted with the blockchain on 6 March.
$FTM Daily Active Users skyrocketed, increasing four-fold and hitting its highest point of the year!
Fees generated by the protocol shot up 44% ? pic.twitter.com/6Kg6vw3lvr
— Emperor Osmo? (@Flowslikeosmo) March 10, 2023
The Fantom ecosystem in the last month
In the last 30 days, Fantom has seen growth in some of its key ecosystem metrics. For example, with increased user activity in the last month, the number of unique addresses on the chain jumped by 5.62% to almost touch 45 million.
Furthermore, the network recorded a 33% jump in transaction fees and revenue during the same period. With increased social hype in the last month, the protocol logged an 11.4% rally in its social dominance social mentions.
? Let's get to know the on-chain monthly recap of @FantomFDN ?
The below picture illustrates:
? Social Metrics
? Key Metrics
? Unique Addresses Chart ?5.62%#Fantom $FTM #FTM pic.twitter.com/Xcjz4Cfgcq— Fantom Insider (@fantom_insider) March 6, 2023
Despite the growth in Fantom’s key ecosystem metrics in the last month, its DeFi landscape has dealt with a decline in the value of assets locked (TVL) on the protocol since early February.
After peaking at $571.62 million on 2 February, Fantom’s TVL since decreased by 32%.
Read Fantom’s [FTM] Price Prediction 2023-24
According to DefiLlama, the network’s TVL stood at $386.85 million at the time of writing. In fact, out of the 255 DeFi protocols housed within Fantom, only 20 of them experienced growth in their TVL over the past month.
A majority of these protocols encountered a significant decrease in the worth of assets sent to their smart contracts during the last 30 days, with many registering a decline in double digits.
Under the influence of the bears
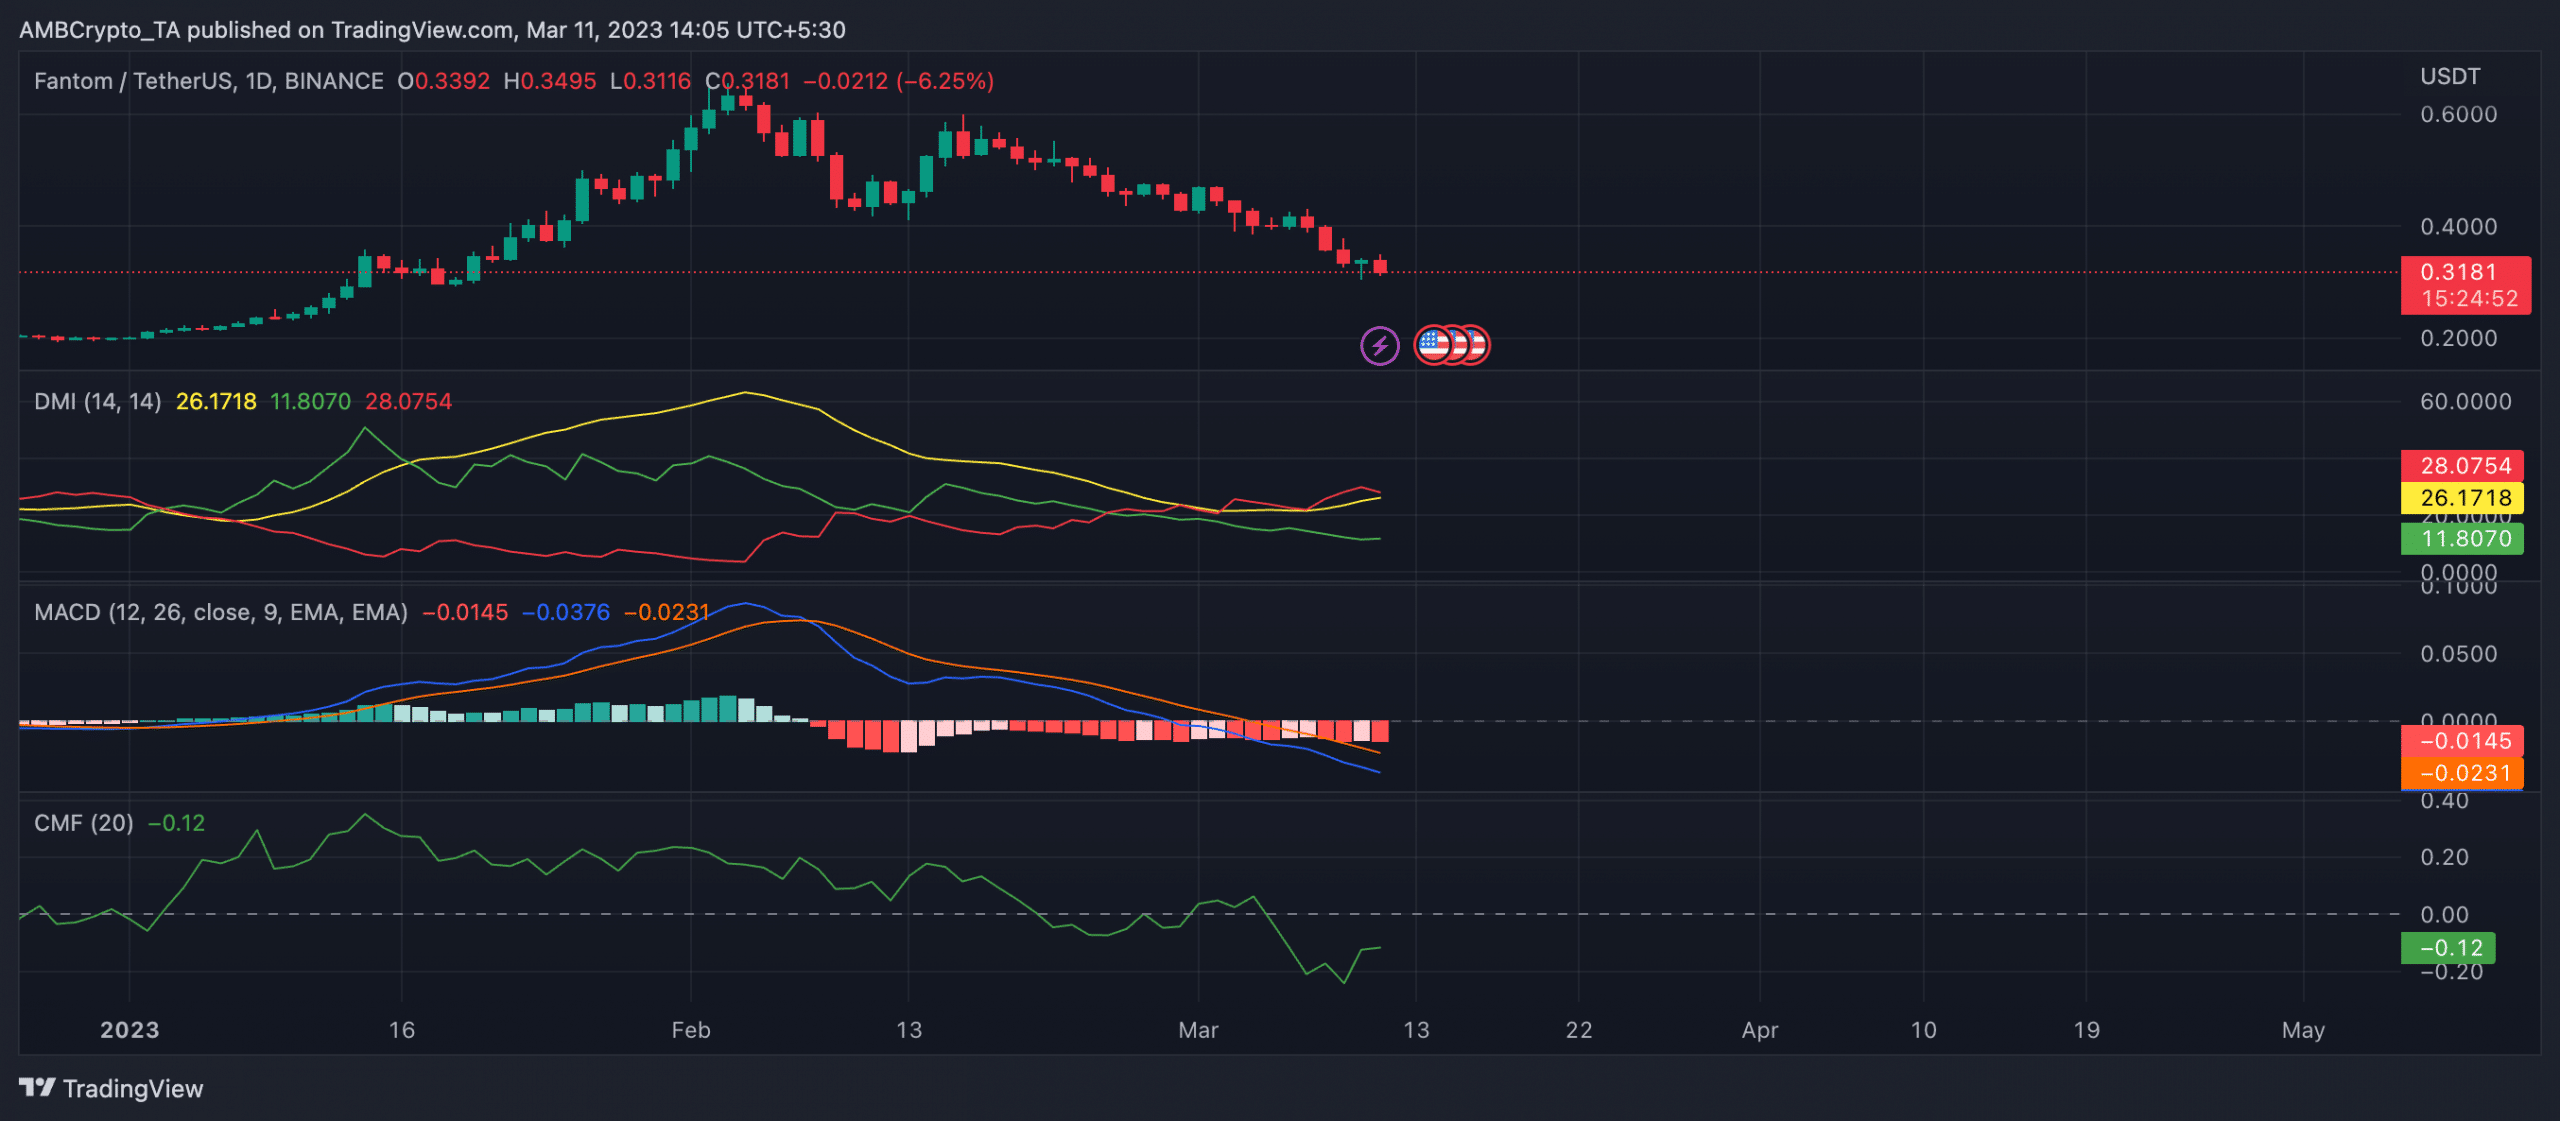
Selling at $0.3195 per FTM token at press time, the alt’s value has declined by 37% in the last month. An assessment of price movement on a daily chart confirmed the commencement of a new bear cycle on 7 February.
FTM’s Moving Average Convergence Divergence (MACD) indicator has since been marked only by growing red histogram bars. Upon the commencement of the new bear cycle, FTM bears regained control of the market, and increased coin distribution culminated in a price drawdown.
The Directional Movement Indicator (DMI) indicated the re-emergence of FTM bears. At press time, the negative directional index (red) at 28.07 rested above the positive directional index (green) at 11.80, confirming that the sellers overpowered the buyers at press time.
Realistic or not, here’s FTM market cap in BTC‘s terms
Lastly, as of this writing, the token’s Chaikin Money Flow (CMF) rested below its center line to return a negative value of -0.12. This signaled an increased exit of liquidity from the FTM market, making a change in conviction imperative for a price reversal.


![Kaspa [KAS] on a long-term downtrend? Here's why it should worry investors!](https://ambcrypto.com/wp-content/uploads/2025/06/Kaspa-Featured-400x240.webp)