Fantom’s price jumps 18% – Why the outrage? What of its predictions?
FTM witnessed an 18% intraday price rally on 14th December, pushing prices to their highest since May.

- FTM’s price rallied by almost 20% on 14th December.
- This caused its price to soar to its highest level since May.
Fantom [FTM] enjoyed a meteoric rise on the 14th of December, experiencing an impressive 18% intraday rally. This surge propelled the cryptocurrency to its highest price point since May, AMBCrypto found.
At press time, the altcoin exchanged hands at $0.4224. Although it has since shed some of these gains, FTM remained at a 6% high in the past 24 hours, data from CoinMarketCap showed.
Demand for FTM at its highest
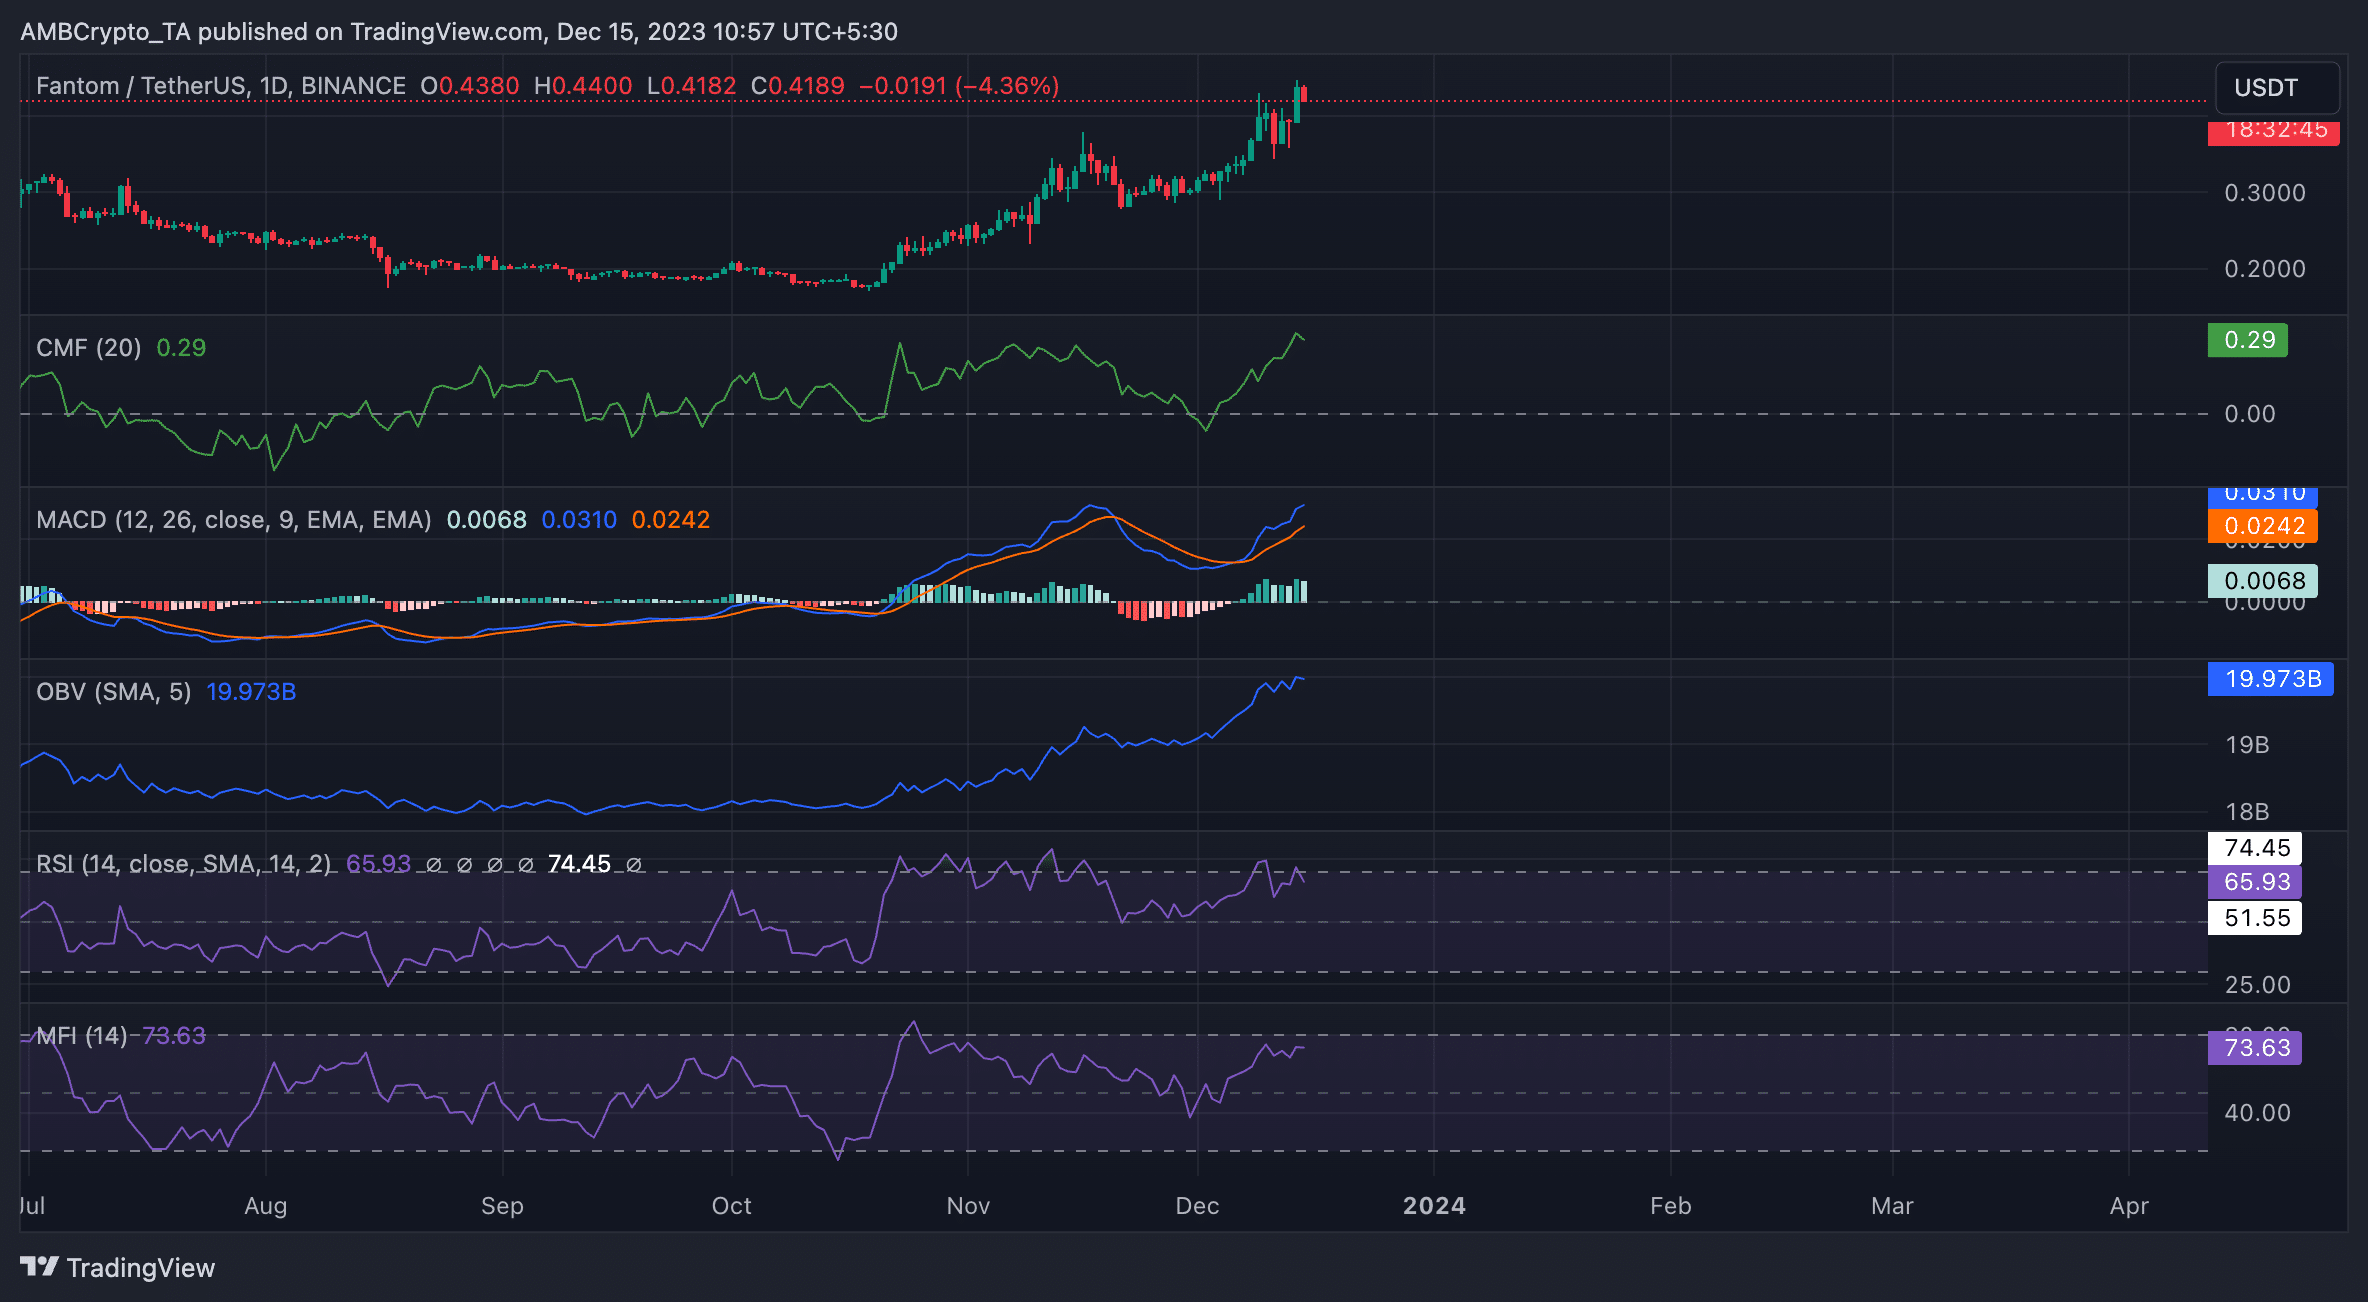
The last week has seen a surge in demand for FTM. An assessment of the token’s performance on a daily chart revealed the commencement of a new bull cycle on 6th December.
On that day, the token’s Moving Average Convergence/Divergence indicator (MACD) witnessed its MACD line intersect its trend line in an uptrend.
When the MACD line of an asset crosses above the trend line and starts trending upward, it is considered a bullish signal.
This crossover suggested that the short-term moving average (MACD line) has risen above the longer-term moving average (signal line), indicating the re-emergence of bulls.
Since the bulls emerged to displace the bears on 6th December, FTM’s price has increased by over 20%.
Since the MACD crossover, the token’s Chaikin Money Flow (CMF) has initiated an uptrend. At press time, it was spotted at its highest level since January.
This indicator measures the volume of money flowing into and out of the asset. Therefore, when it rises in this manner, more money is entering the market, driving the price upwards.
Further, showing that FTM accumulation exceeded token distribution, its key momentum indicators were positioned close to overbought highs. For example, the token’s Relative Strength Index (RSI) was 65.93, while its Money Flow Index (MFI) was 73.63.
Likewise, at 19.97 billion at press time, FTM’s On-balance volume sat at an all-time high. The indicator is used to gauge an asset’s buying and selling pressure.
A rising OBV indicates strong buying pressure, suggesting investors are accumulating the asset. Since 6th December, FTM’s OBV has gone up by 3%.
Read Fantom’s [FTM] Price Prediction 2023-24
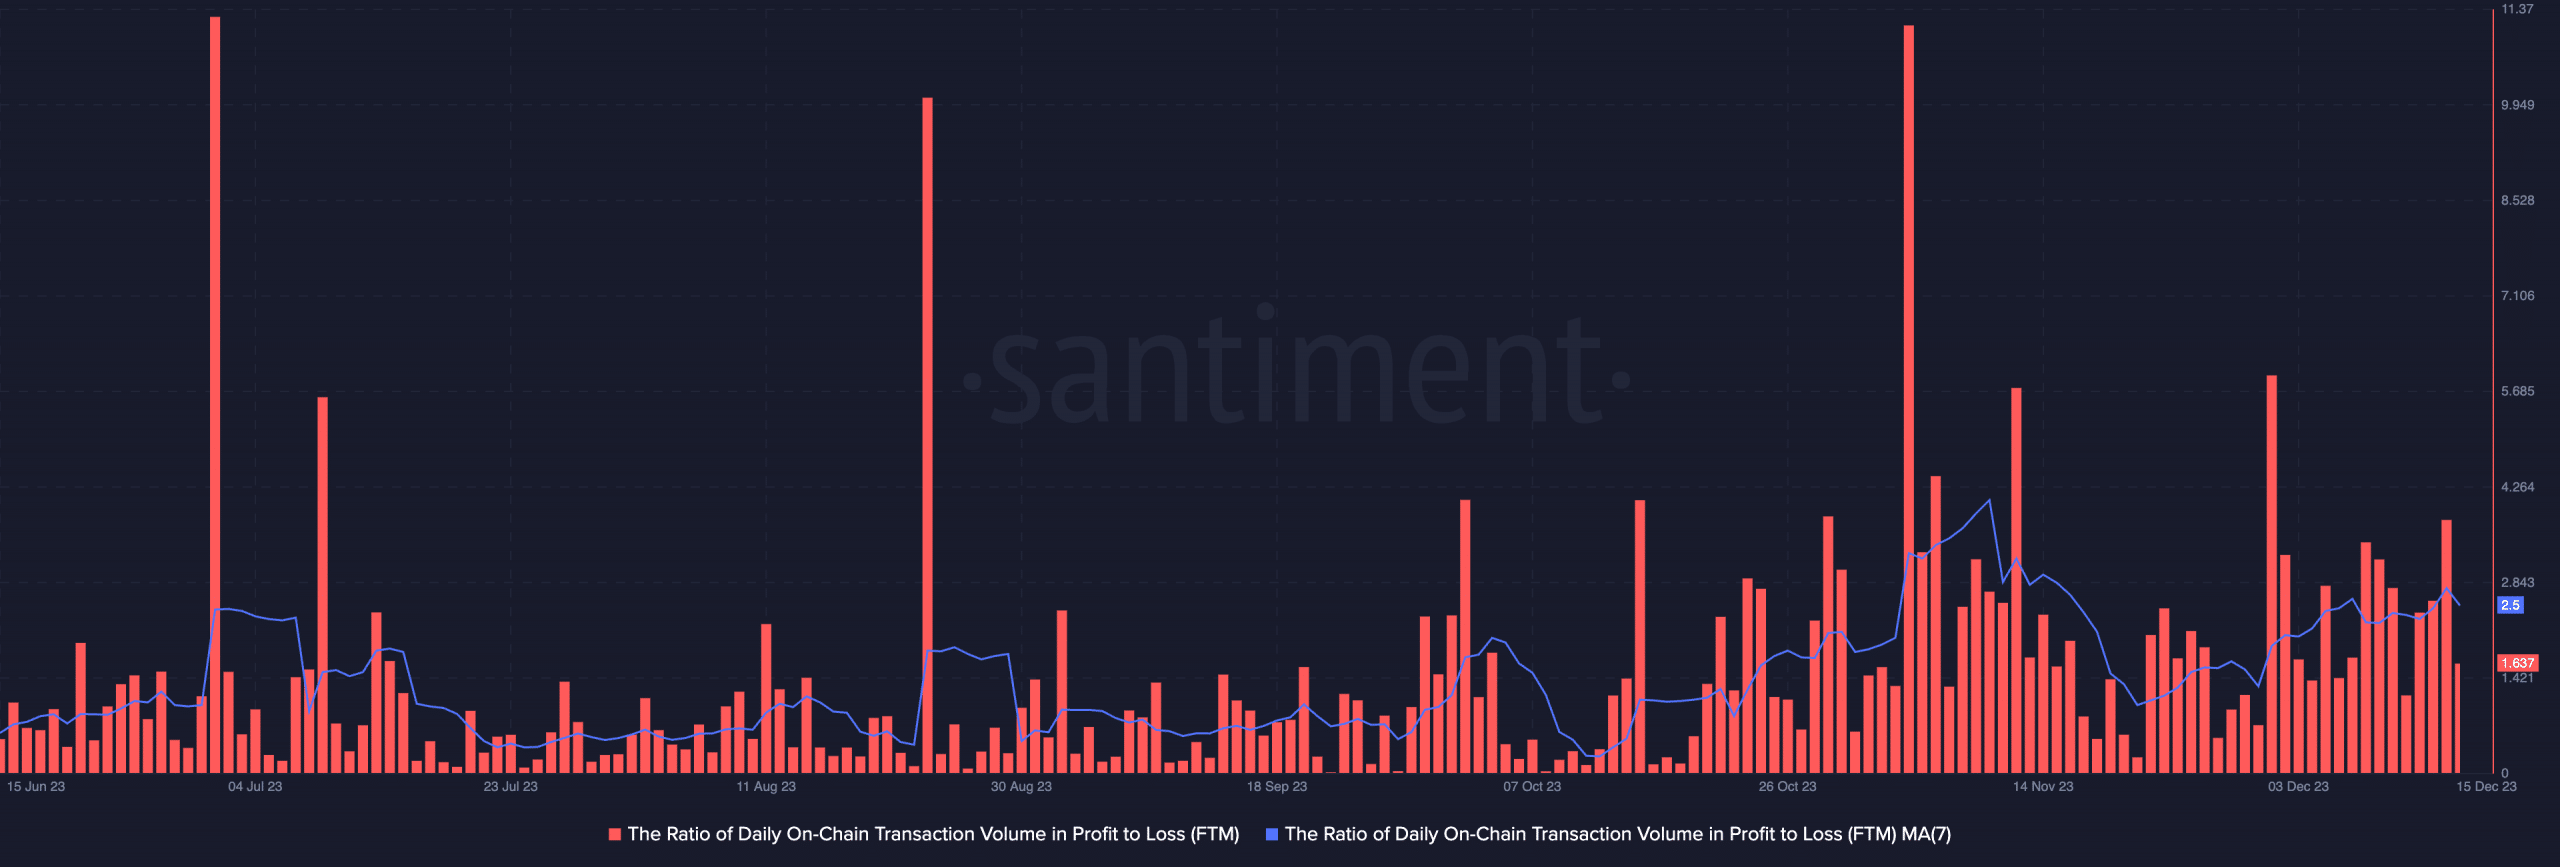
FTM transactions yield profit
The price surge in the last week has resulted in a corresponding uptick in the ratio of daily FTM transactions in profit to loss.
The ratio assessed on a seven-day moving average was 2.5. This meant that for every FTM transaction that has returned a loss in the last seven days, 2.5 transactions ended in a profit.