- FTM’s TVL declined by 8% in the last week.
- DeFi space witnessed growth, but metrics and indicators were bearish.
Fantom Insider recently posted the Fantom [FTM] network’s weekly report, which highlighted quite a few interesting metrics. A major negative development was a decline in Fantom’s Total Value Locked (TVL), which dropped by over 8%. As per the data, FTM’s TVL declined from $764 million to $719 million over the past seven days.
THE #FANTOM ON-CHAIN WEEKLY RECAP
Below is the on-chain performance of @FantomFDN in the last 7 days!
📈 Implemented over 2.83M transactions
✅ Gained more than 1.12M in total unique addressesExplore more below 👇#Fantom #FTM $FTM #Onchain @AndreCronjeTech pic.twitter.com/ZDl3Cm3lR5
— Sonic Insider (@insider_sonic) February 28, 2023
The tweet also mentioned quite a few other key metrics, such as total transactions, which exceeded 2.8 million. It was interesting to note that while the network’s unique addresses increased considerably, FTM’s daily transactions declined in the last few days. Nonetheless, though the network’s TVL declined, FTM’s DeFi space registered steady growth.
Realistic or not, here’s FTM market cap in BTC’s terms
DeFi ecosystem on a steady growth
Covalent, a unified API provider, recently pointed out that Fantom’s performance in 2023 has been decent as its number of transactions remained relatively on the higher side this year. The tweet also showed that there has been a considerable increase in the number of monthly users in the network, reflecting its increased adoption and usage.
6/ For DeFi users working around other Layer 1s’ limitations, Fantom opens up a new world of possibilities 🗺️
🚀 Monthly active users on Fantom have skyrocketed in the last quarter.
👥 This shows that Fantom has a strong core community that has grown fast within a short time. pic.twitter.com/JLA5S0fp4G
— Covalent (@Covalent_HQ) February 27, 2023
Can Fantom’s DeFi growth help FTM?
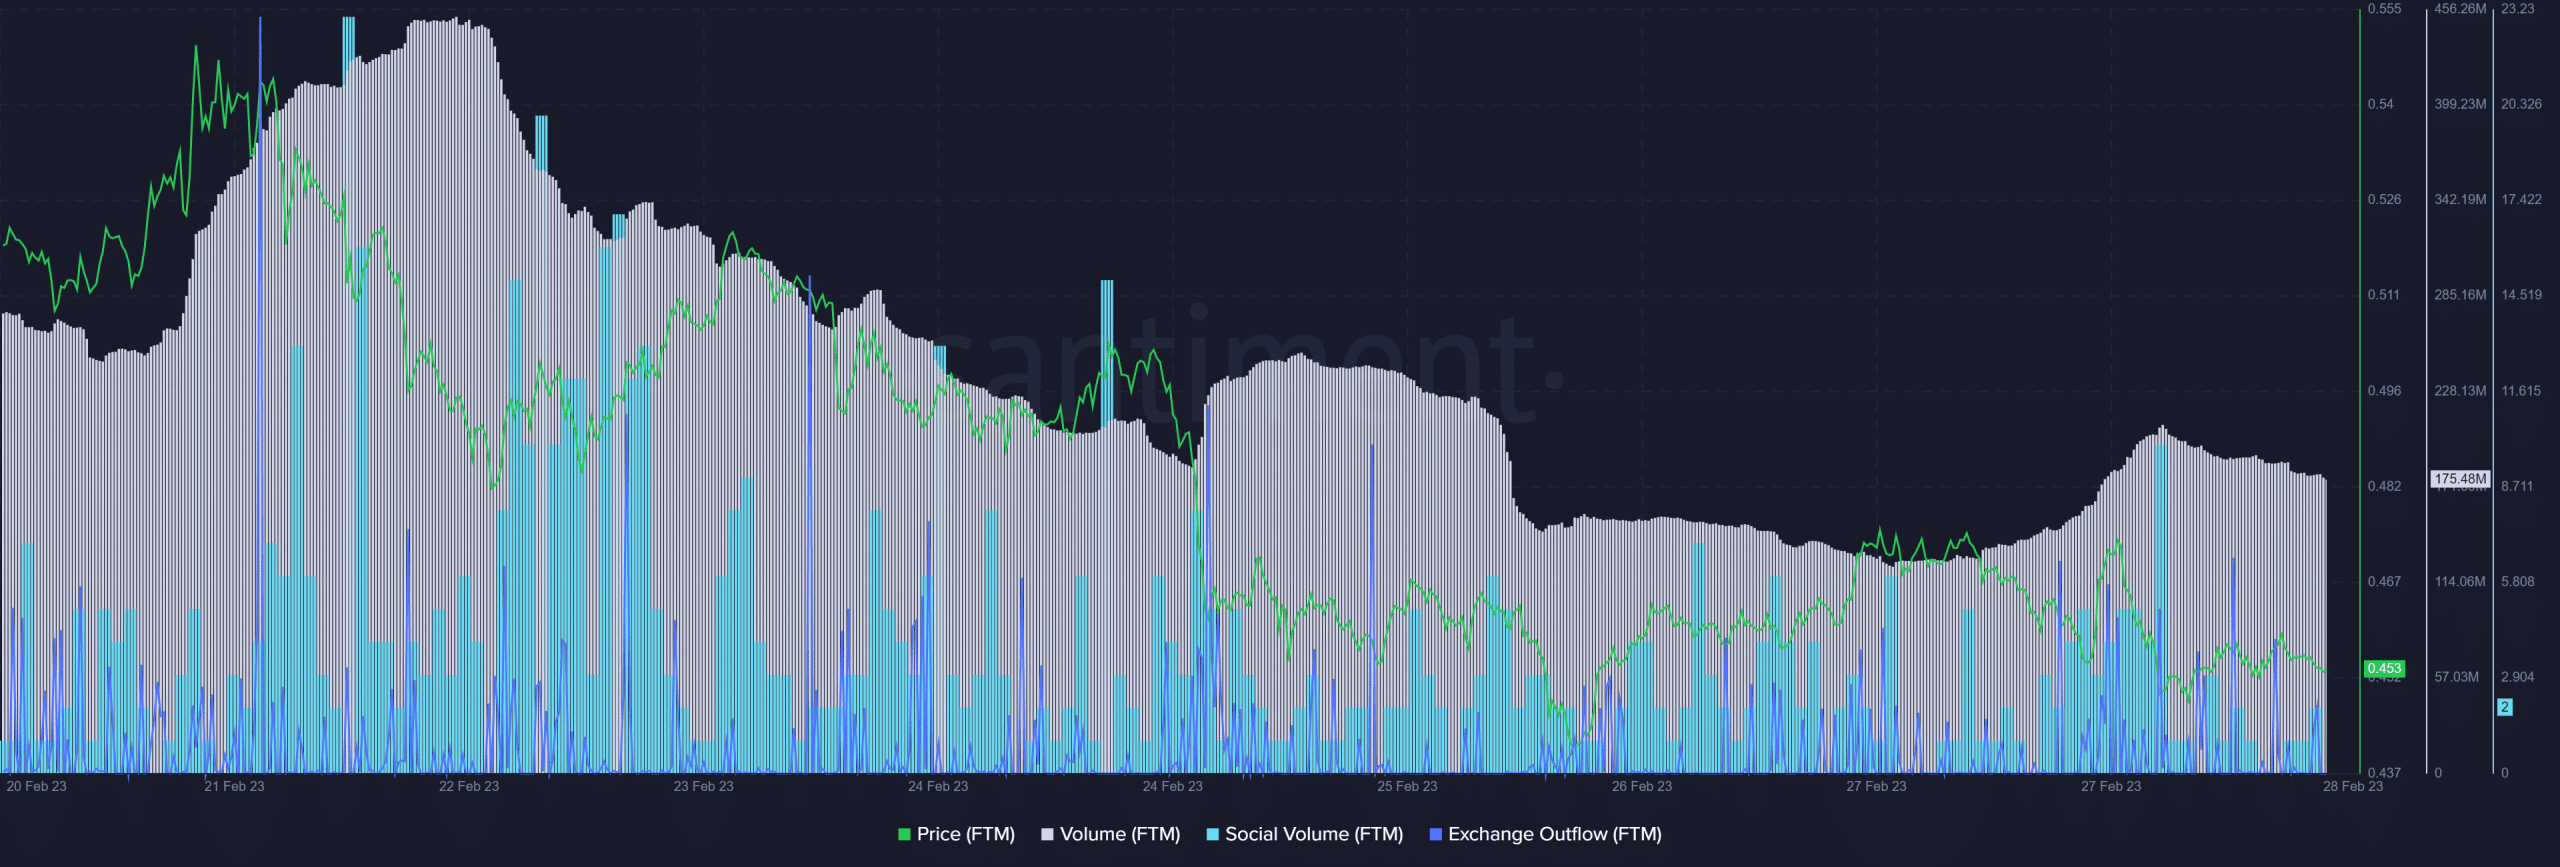
While the aforementioned datasets looked promising for the network, FTM’s performance on the price front was not up to par. According to CoinMarketCap, FTM registered a weekly price decline of over 14%, and at press time, it was valued at $0.4529 with a market capitalization of over $1.25 billion.
Santiment’s chart further revealed quite a few factors that can be blamed for this performance. For instance, FTM’s trading volume declined considerably, suggesting less interest from investors. FTM’s exchange outflow also declined, which was a bearish signal.
The token’s popularity also took a blow as its social volume went down. As per LunarCrush, bullish sentiment around FTM declined by 16% last week, suggesting less confidence among investors in FTM.
How much are 1,10,100 FTMs worth today?
Can this worsen the situation?
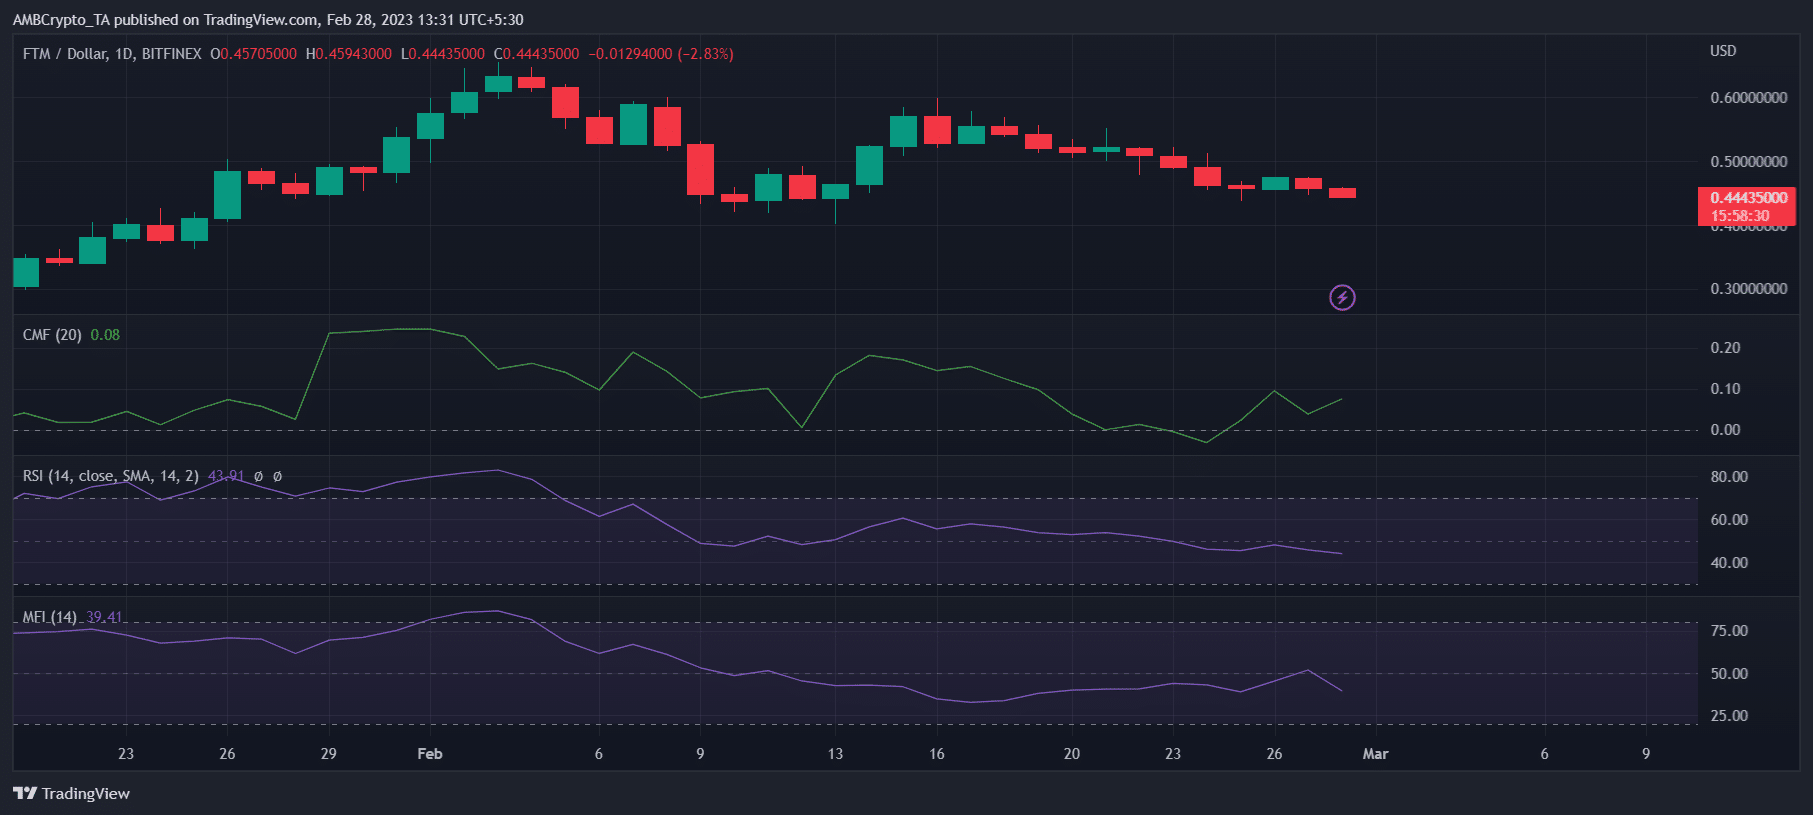
FTM’s daily chart gave more reasons for concern and suggested the possibility of a further downtrend in the coming days. For example, the Money Flow Index (MFI) registered a sharp decline and was heading further below the neutral mark.
The Relative Strength Index (RSI) followed the same trend, further increasing the chances of a price decline. However, FTM’s Chaikin Money Flow (CMF) displayed a divergence, as it registered an uptick while its price dropped.