Fantom: Where to next after another support level bites the dust

Disclaimer: The findings of the following analysis are the sole opinions of the writer and should not be considered investment advice
Bitcoin lost the $38k-level less than 48 hours ago. And, although market participants have seen high volatility, the overall direction has been to the downside.
Fantom has followed Bitcoin’s footsteps and the price of Fantom has also been on a downtrend over the past few days. The mid-February bounce was illusory for the bulls, and the move to $2.15 was a hunt for liquidity that trapped long positions.
FTM- 1 hour chart
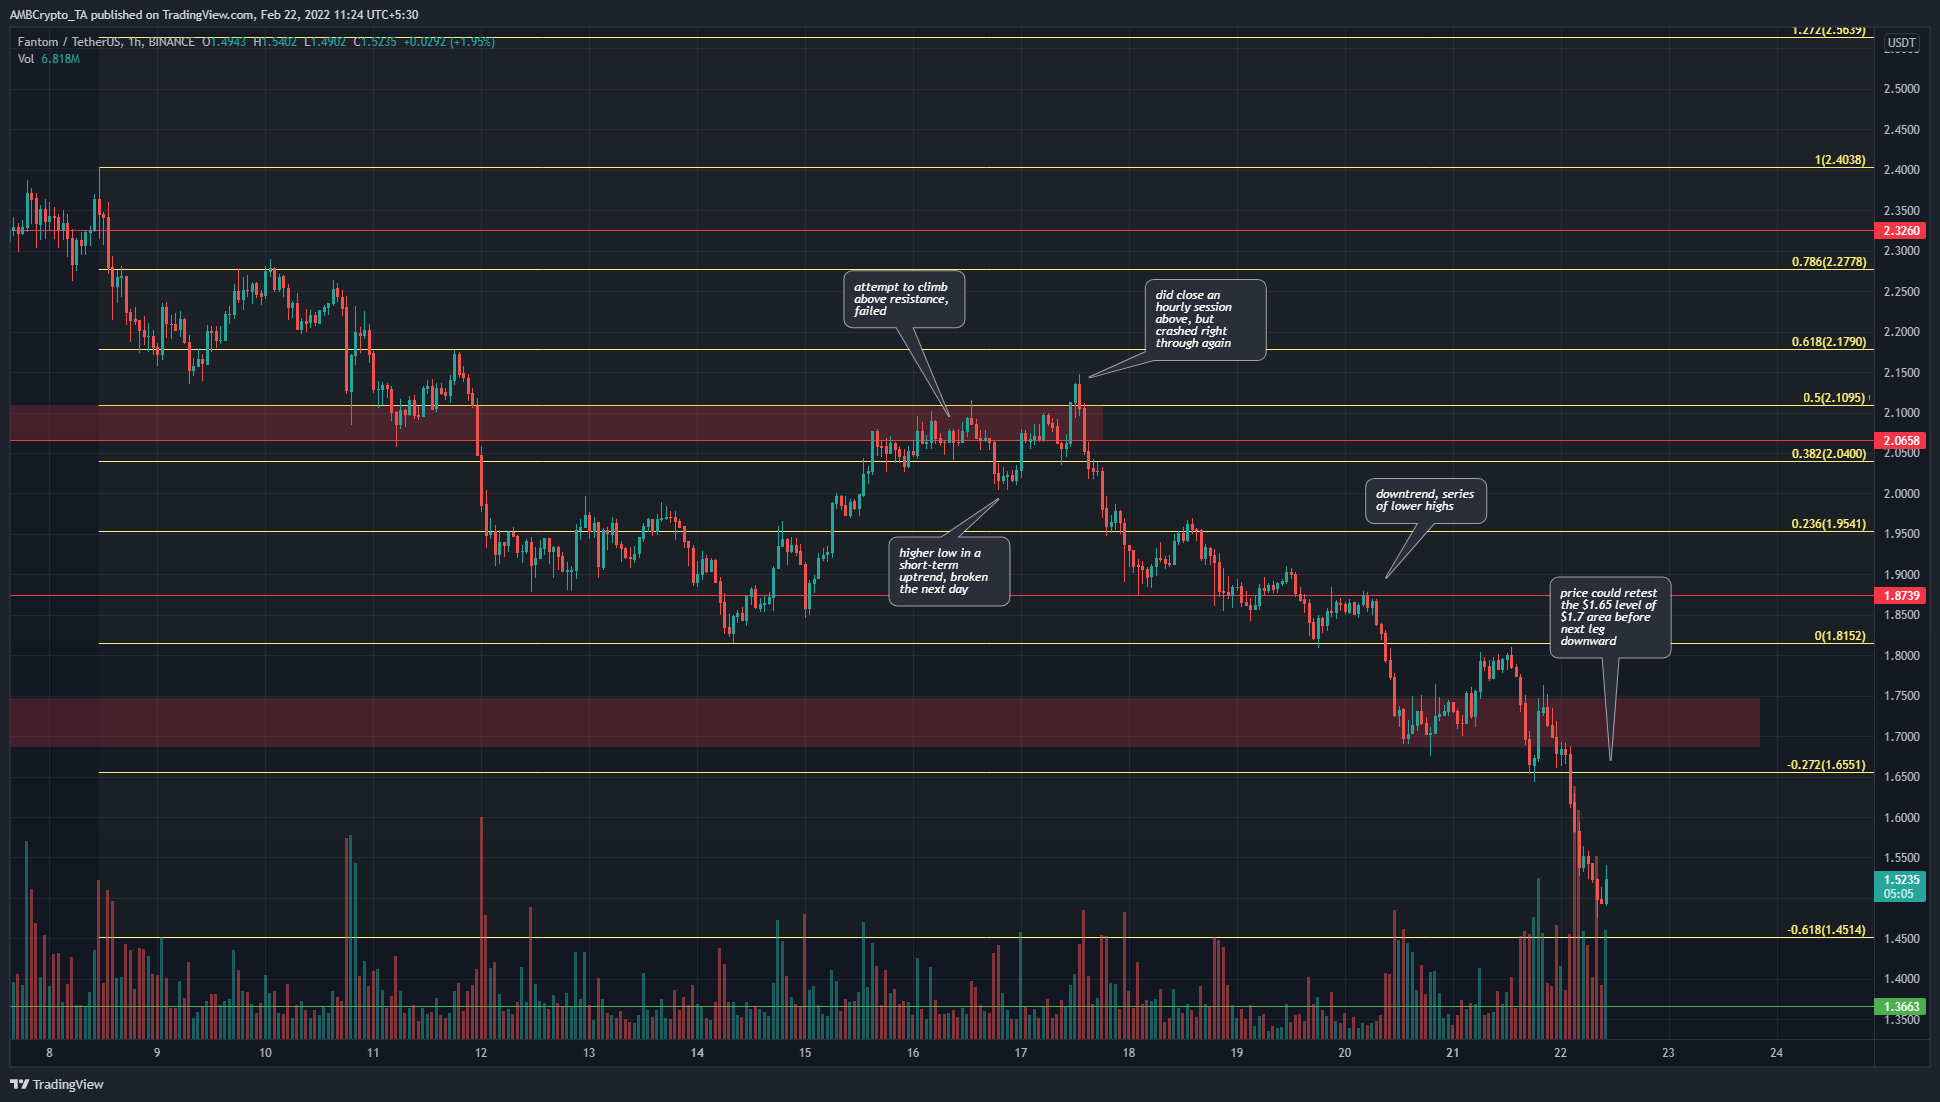
Hindsight is 20/20, but even in mid-February, when the price failed to climb past $2.1, it was still not conclusively out of the woods. While it did make a higher low at $2, the $2.17 and $2.27-levels were still likely candidates as levels where the bears could step in.
The Fibonacci retracement levels (yellow) were plotted based on FTM’s drop from $2.4 to $1.81 earlier in February, and the 27.2% and 61.8% extension levels had given price targets of $1.65 and $1.45. A week ago, the price found support at $1.81 and climbed as high as $2.15 before the bears took the driving seat. This saw the market embark on another leg south.
The price registered a minor bounce from $1.65 to $1.75 before dropping once more under $1.65. This showed that the $1.65-$1.75 zone could be a place FTM retests before its next leg south.
Rationale
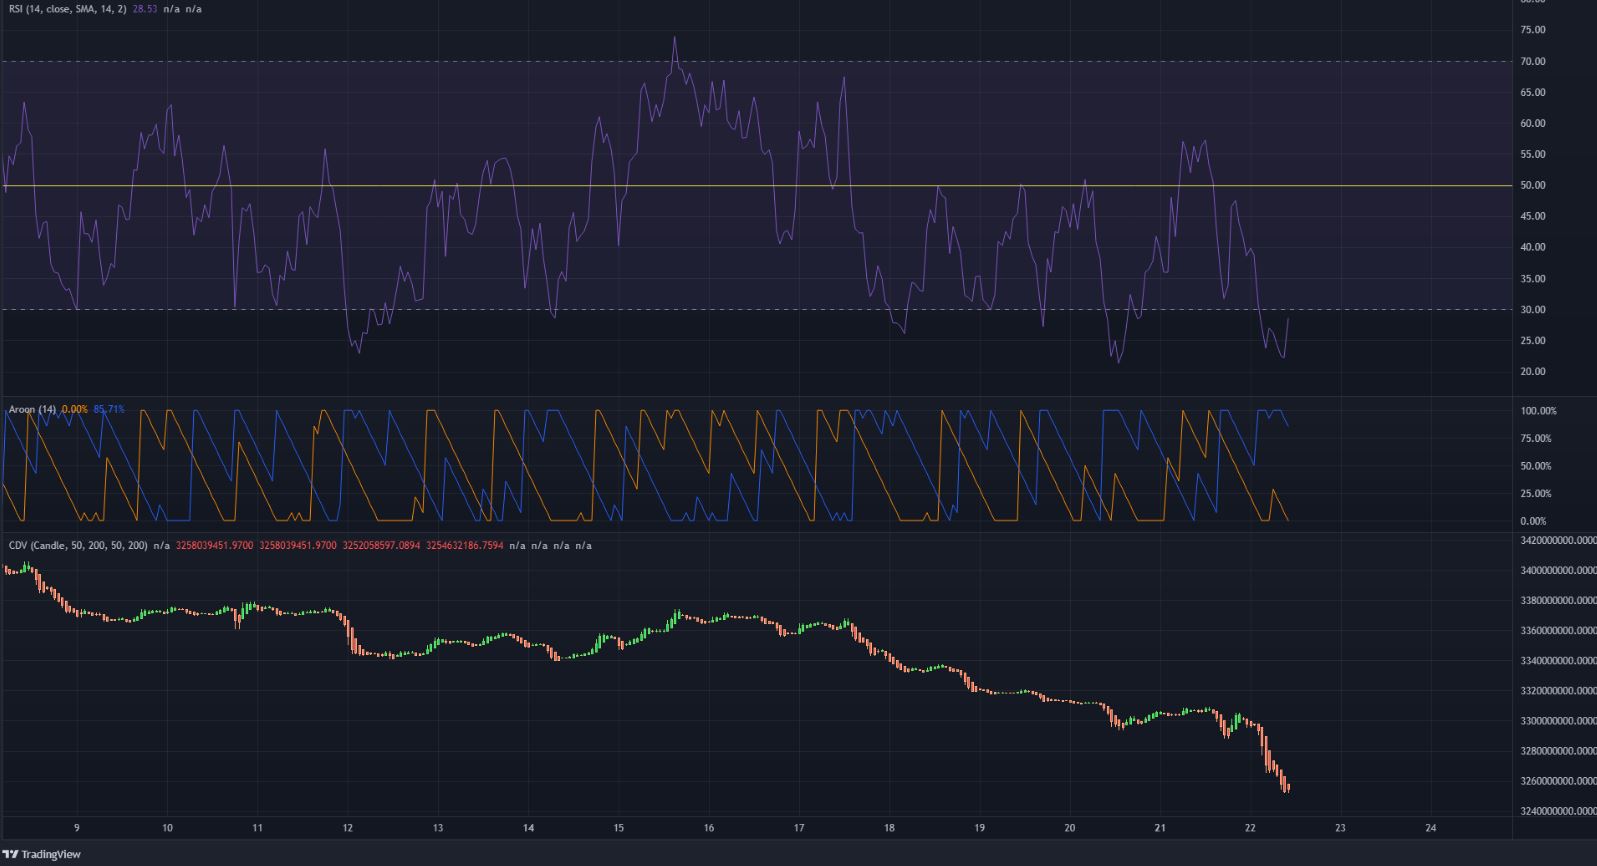
The indicators pictured strong bearish momentum in recent days. The RSI has been below neutral 50 over the past few days, indicating a downtrend. At the time of writing, the RSI stood at 28.5, which was oversold territory. Moreover, the Aroon indicator showed that a downtrend has been predominant over the past week, with brief bounces.
The CDV was also on a downtrend – A sign that selling volume was much higher than buying over the past two weeks.
Conclusion
Bulls have not been convincing over the last few days, and demand is yet to be seen in strength. For FTM, the next levels of support lie at $1.45 and $1.36, and the $1.3-$1.35 area could see demand step in.