
- Fartcoin traders can be optimistic in the short-term.
- The 1-day chart showed that the three-month downtrend was coming to an end.
Fartcoin [FARTCOIN] was likely on its way to establishing an uptrend. The Bitcoin [BTC] price trajectory over the past few days has been bearish, which pushed FARTCOIN into a 40% correction.
The corrective move ended on the 31st of March, and the memecoin was up 35% since the lows of $0.383 on the 1st of April.
Fartcoin bulls shift the momentum
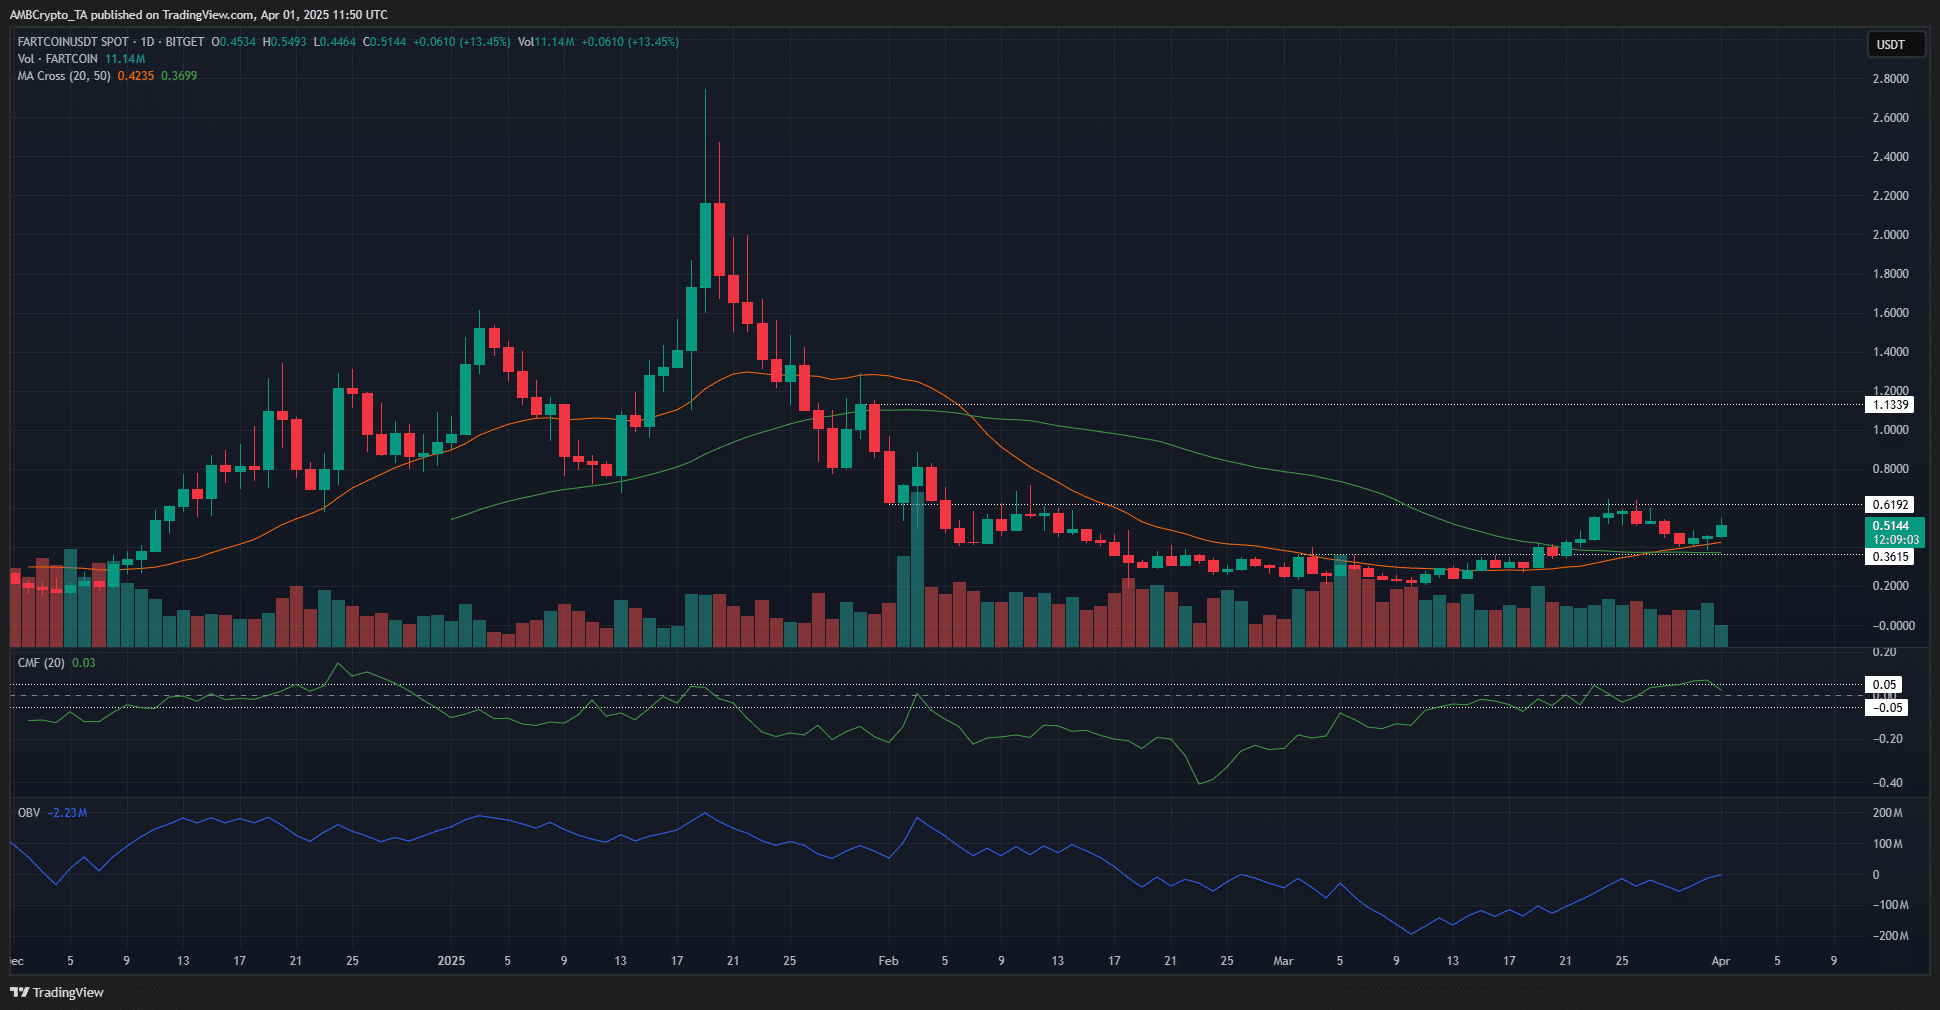
Source: FARTCOIN/USDT on TradingView
On the 1-day chart, Fartcoin appeared to be reversing its bearish trend. The 20 and 50-day moving averages formed a bullish crossover on the 28th of March.
Over the past couple of days, the 20DMA has acted as a dynamic support level to the price.
The CMF briefly poked its head above +0.05 to signal sizeable capital inflows, but was quick to withdraw into neutral territory. Meanwhile, the OBV was on the verge of pushing above the late February highs.
Together, the volume indicators showed rising buying pressure, even if it wasn’t overwhelmingly strong. This meant that the chances of a bullish reversal were growing stronger.
FARTCOIN has already surpassed the $0.3615 resistance and flipped it to support. This move was important and marked its bullish structure shift. The $0.619 level was likely to be flipped to support next.

Source: FARTCOIN/USDT on TradingView
The 4-hour chart showed a possible range formation over the past week. The mid-range level at $0.508 has served as support in the past and could act as resistance in the hours following press time.
The H4 chart’s CMF was subdued, as a result of the sizeable pullback from $0.63 to $0.39, which marked the range’s extremes.
In recent hours, the quick price bounce propelled the RSI back above neutral 50 to reflect bullish momentum. Bulls would like to see the $0.508 mid-range level flipped to support soon, and can use that to go long.
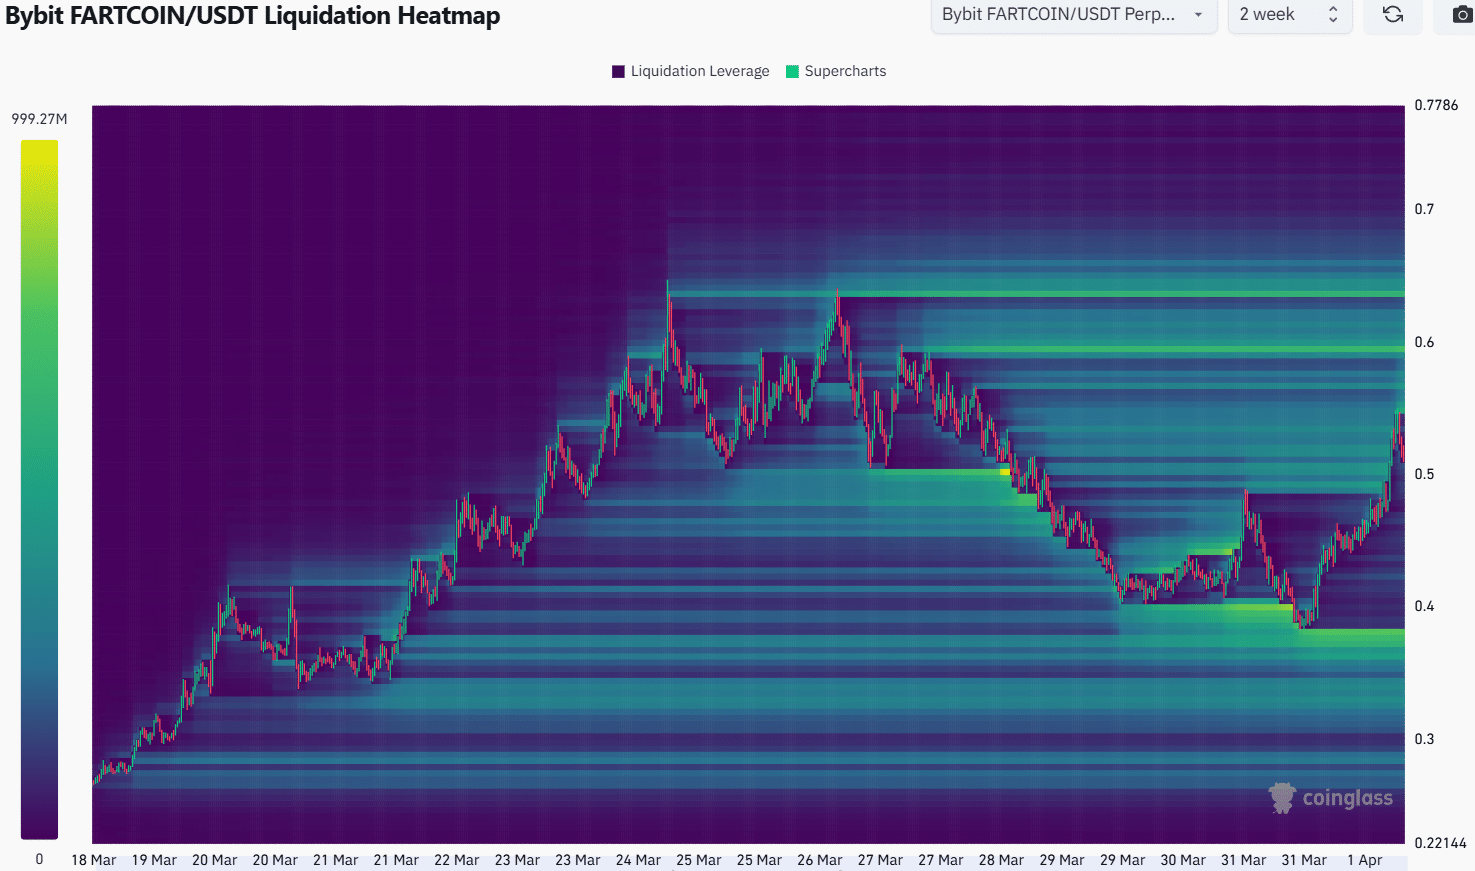
Source: Coinglass
The Fartcoin liquidation heatmap showed that there was significant liquidity at $0.556, $0.6, and $0.64. The liquidity pocket below the price was far away and roughly the same size as the ones above.
Hence, it was more likely that FARTCOIN would climb toward $0.64 in the coming days than reverse toward $0.38. Traders can thus anticipate a rally toward the short-term range high at $0.63, and potentially higher.
Disclaimer: The information presented does not constitute financial, investment, trading, or other types of advice and is solely the writer’s opinion


![Ethereum [ETH] targets $1,810 – Will THIS crucial level ignite a breakout?](https://ambcrypto.com/wp-content/uploads/2025/04/Gladys-59-400x240.jpg)