FET nears breakout: Could a 20-30% rally be next?

- FET consolidates near $1.33 as traders eye a breakout above $1.38 resistance.
- On-chain activity surges, while technical indicators and liquidations suggest potential bullish momentum.
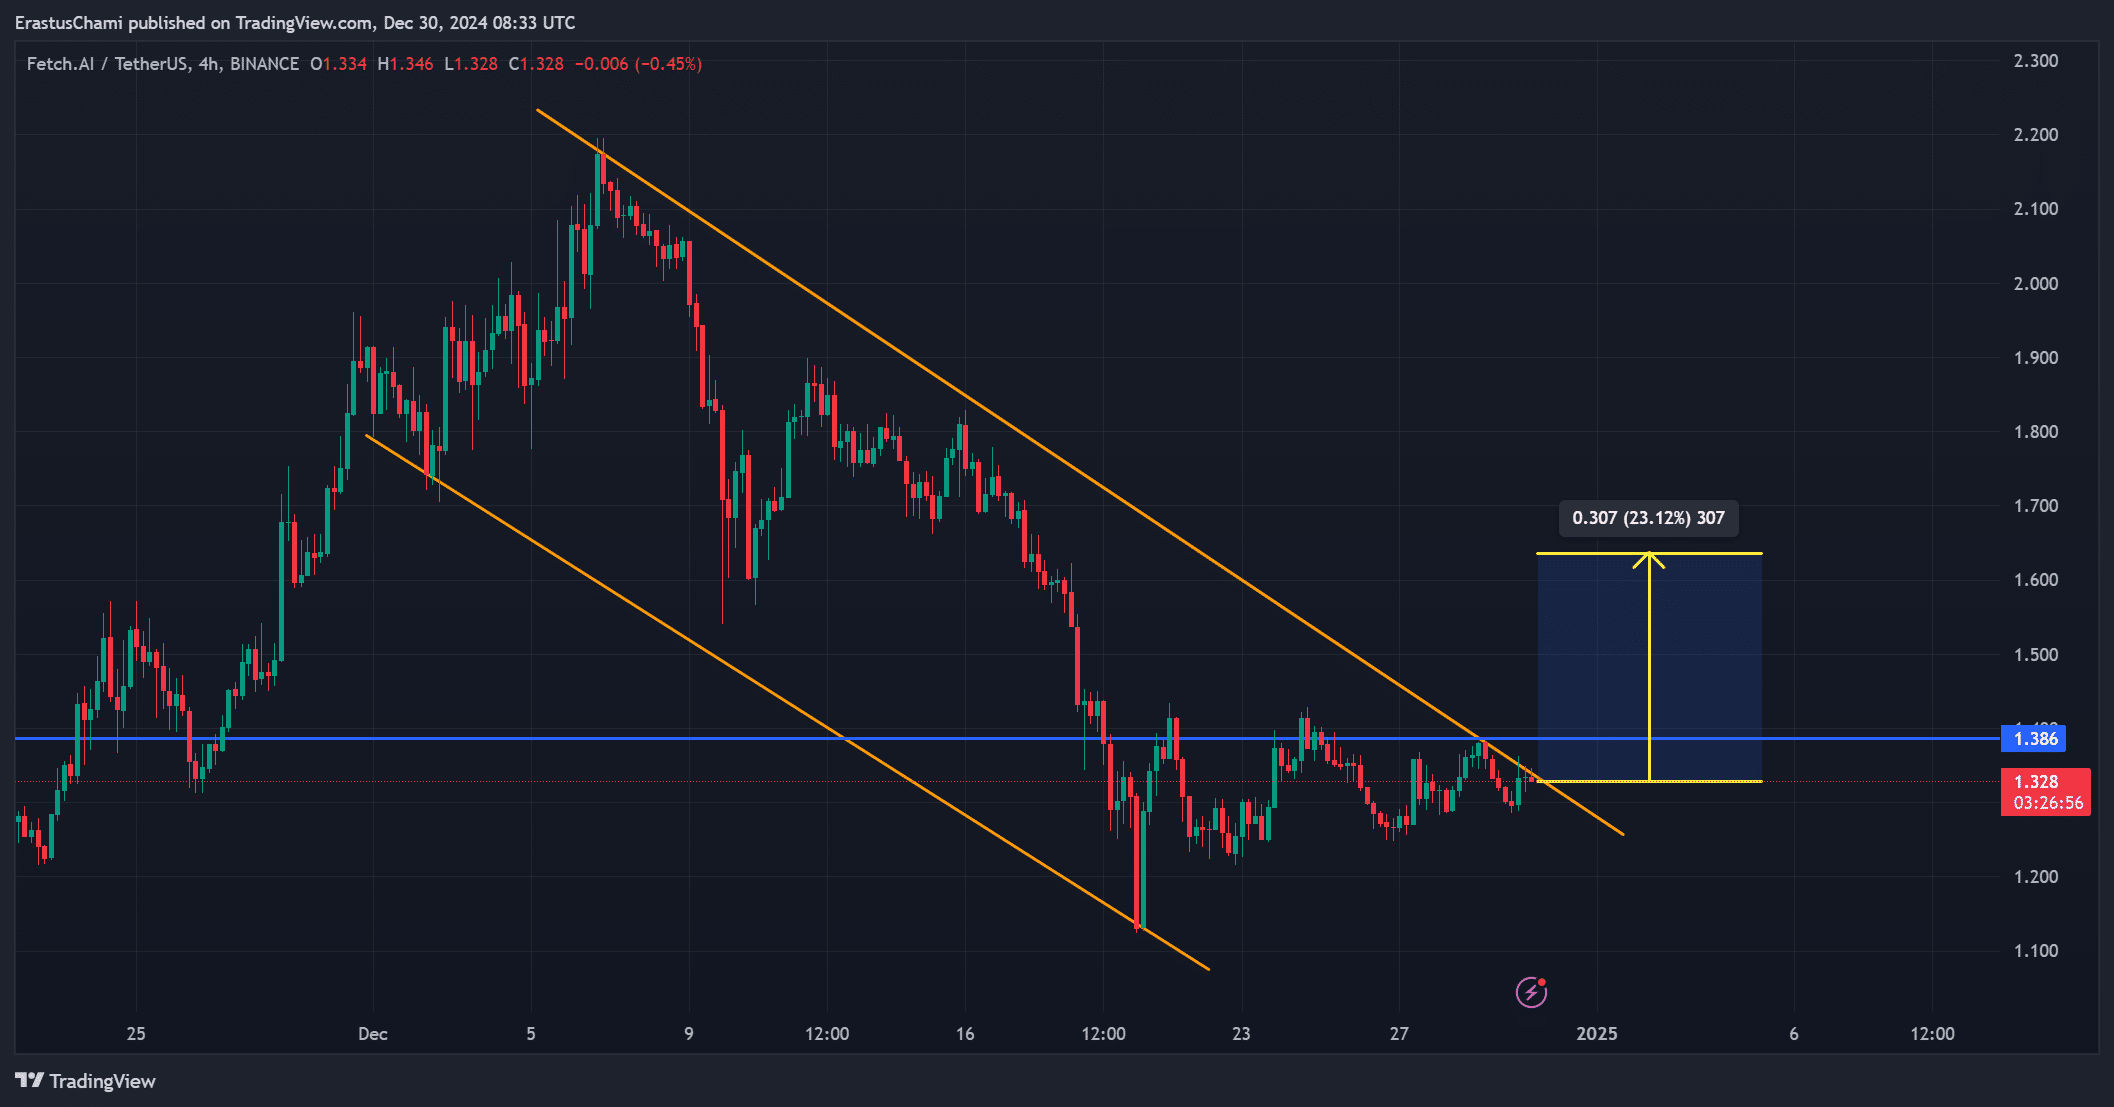
Artificial Superintelligence Alliance [FET] is drawing significant attention as it nears a potential trendline breakout that could trigger a 20-30% rally. At press time, FET is trading at $1.33, reflecting a slight 1.19% dip in the last 24 hours.
However, growing on-chain activity and strong technical indicators suggest that bullish momentum may soon take hold. Will FET meet these expectations and stage a remarkable rally?
Is a breakout above $1.38 on the horizon?
FET’s price is currently trading within a descending channel, with $1.38 serving as the critical resistance level for a bullish breakout.
A move beyond this threshold could propel the price toward $1.60, representing the anticipated 20-30% surge.
Historical price patterns show that FET has successfully broken out of similar setups in the past. However, sustained volume and bullish momentum are essential to confirm this scenario and attract further investor interest.
On-chain activity shows growing engagement
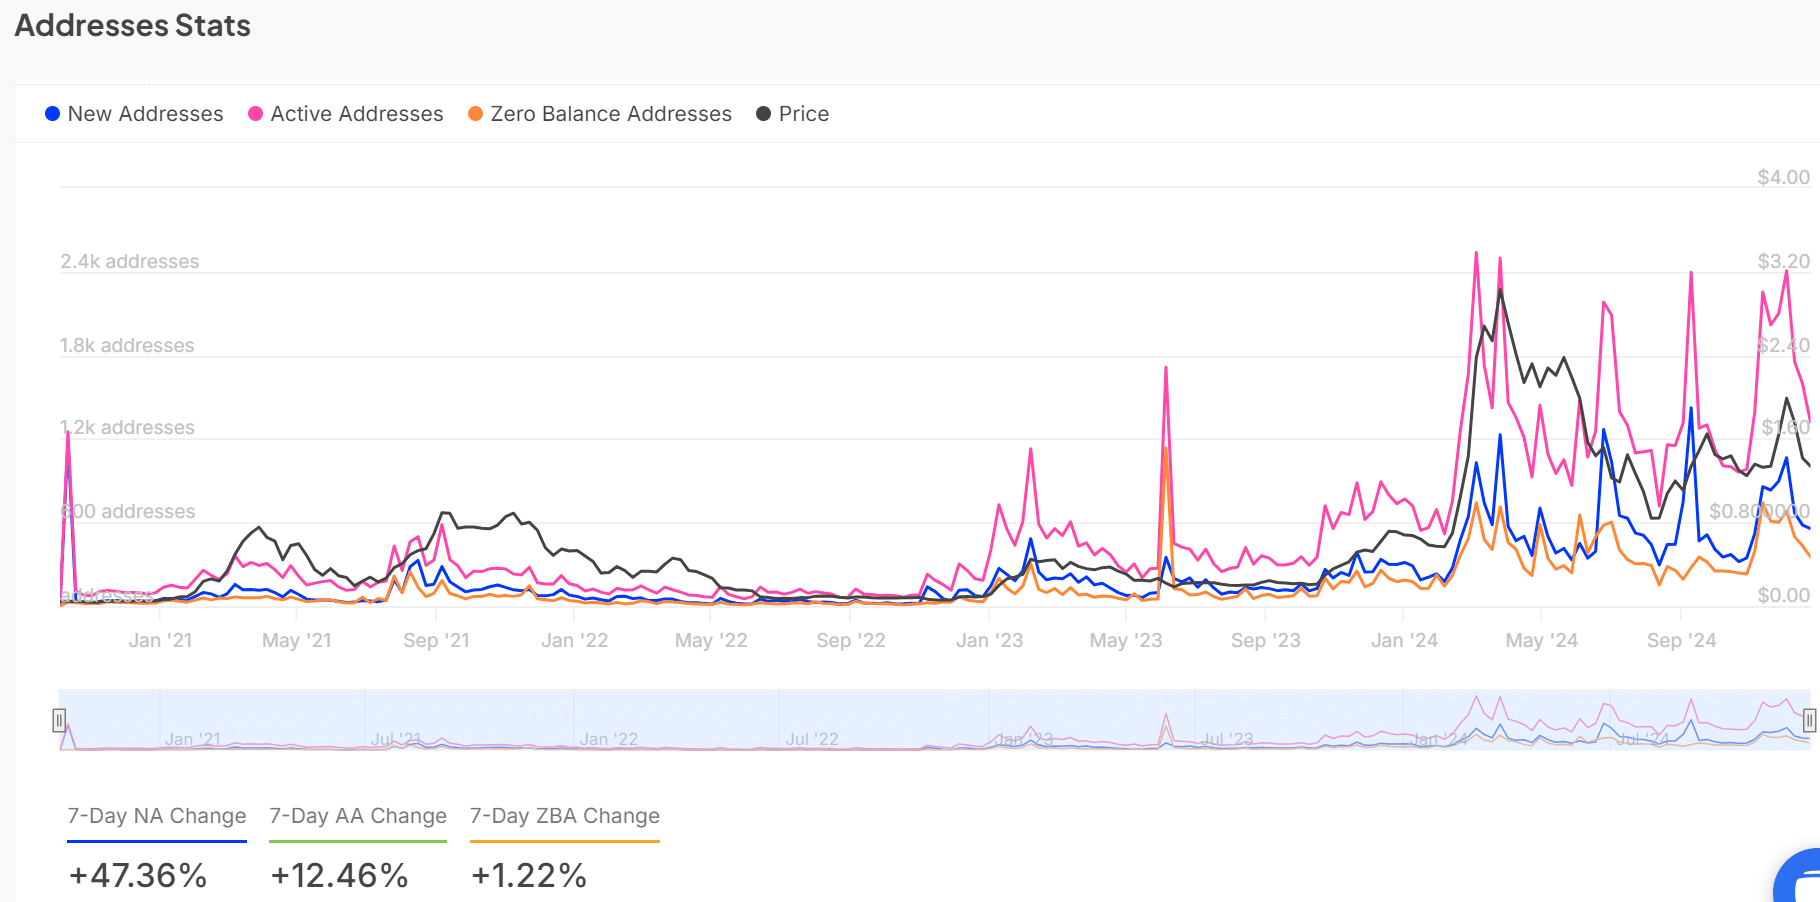
Fetch.AI is seeing a surge in network activity, with new addresses increasing by 47.36% and active addresses rising by 12.46% over the past week.
These impressive numbers reflect heightened interest in FET and growing adoption within its ecosystem.
Furthermore, this increased activity suggests confidence among investors, which often precedes significant price movements.
How exchange reserves signal market sentiment
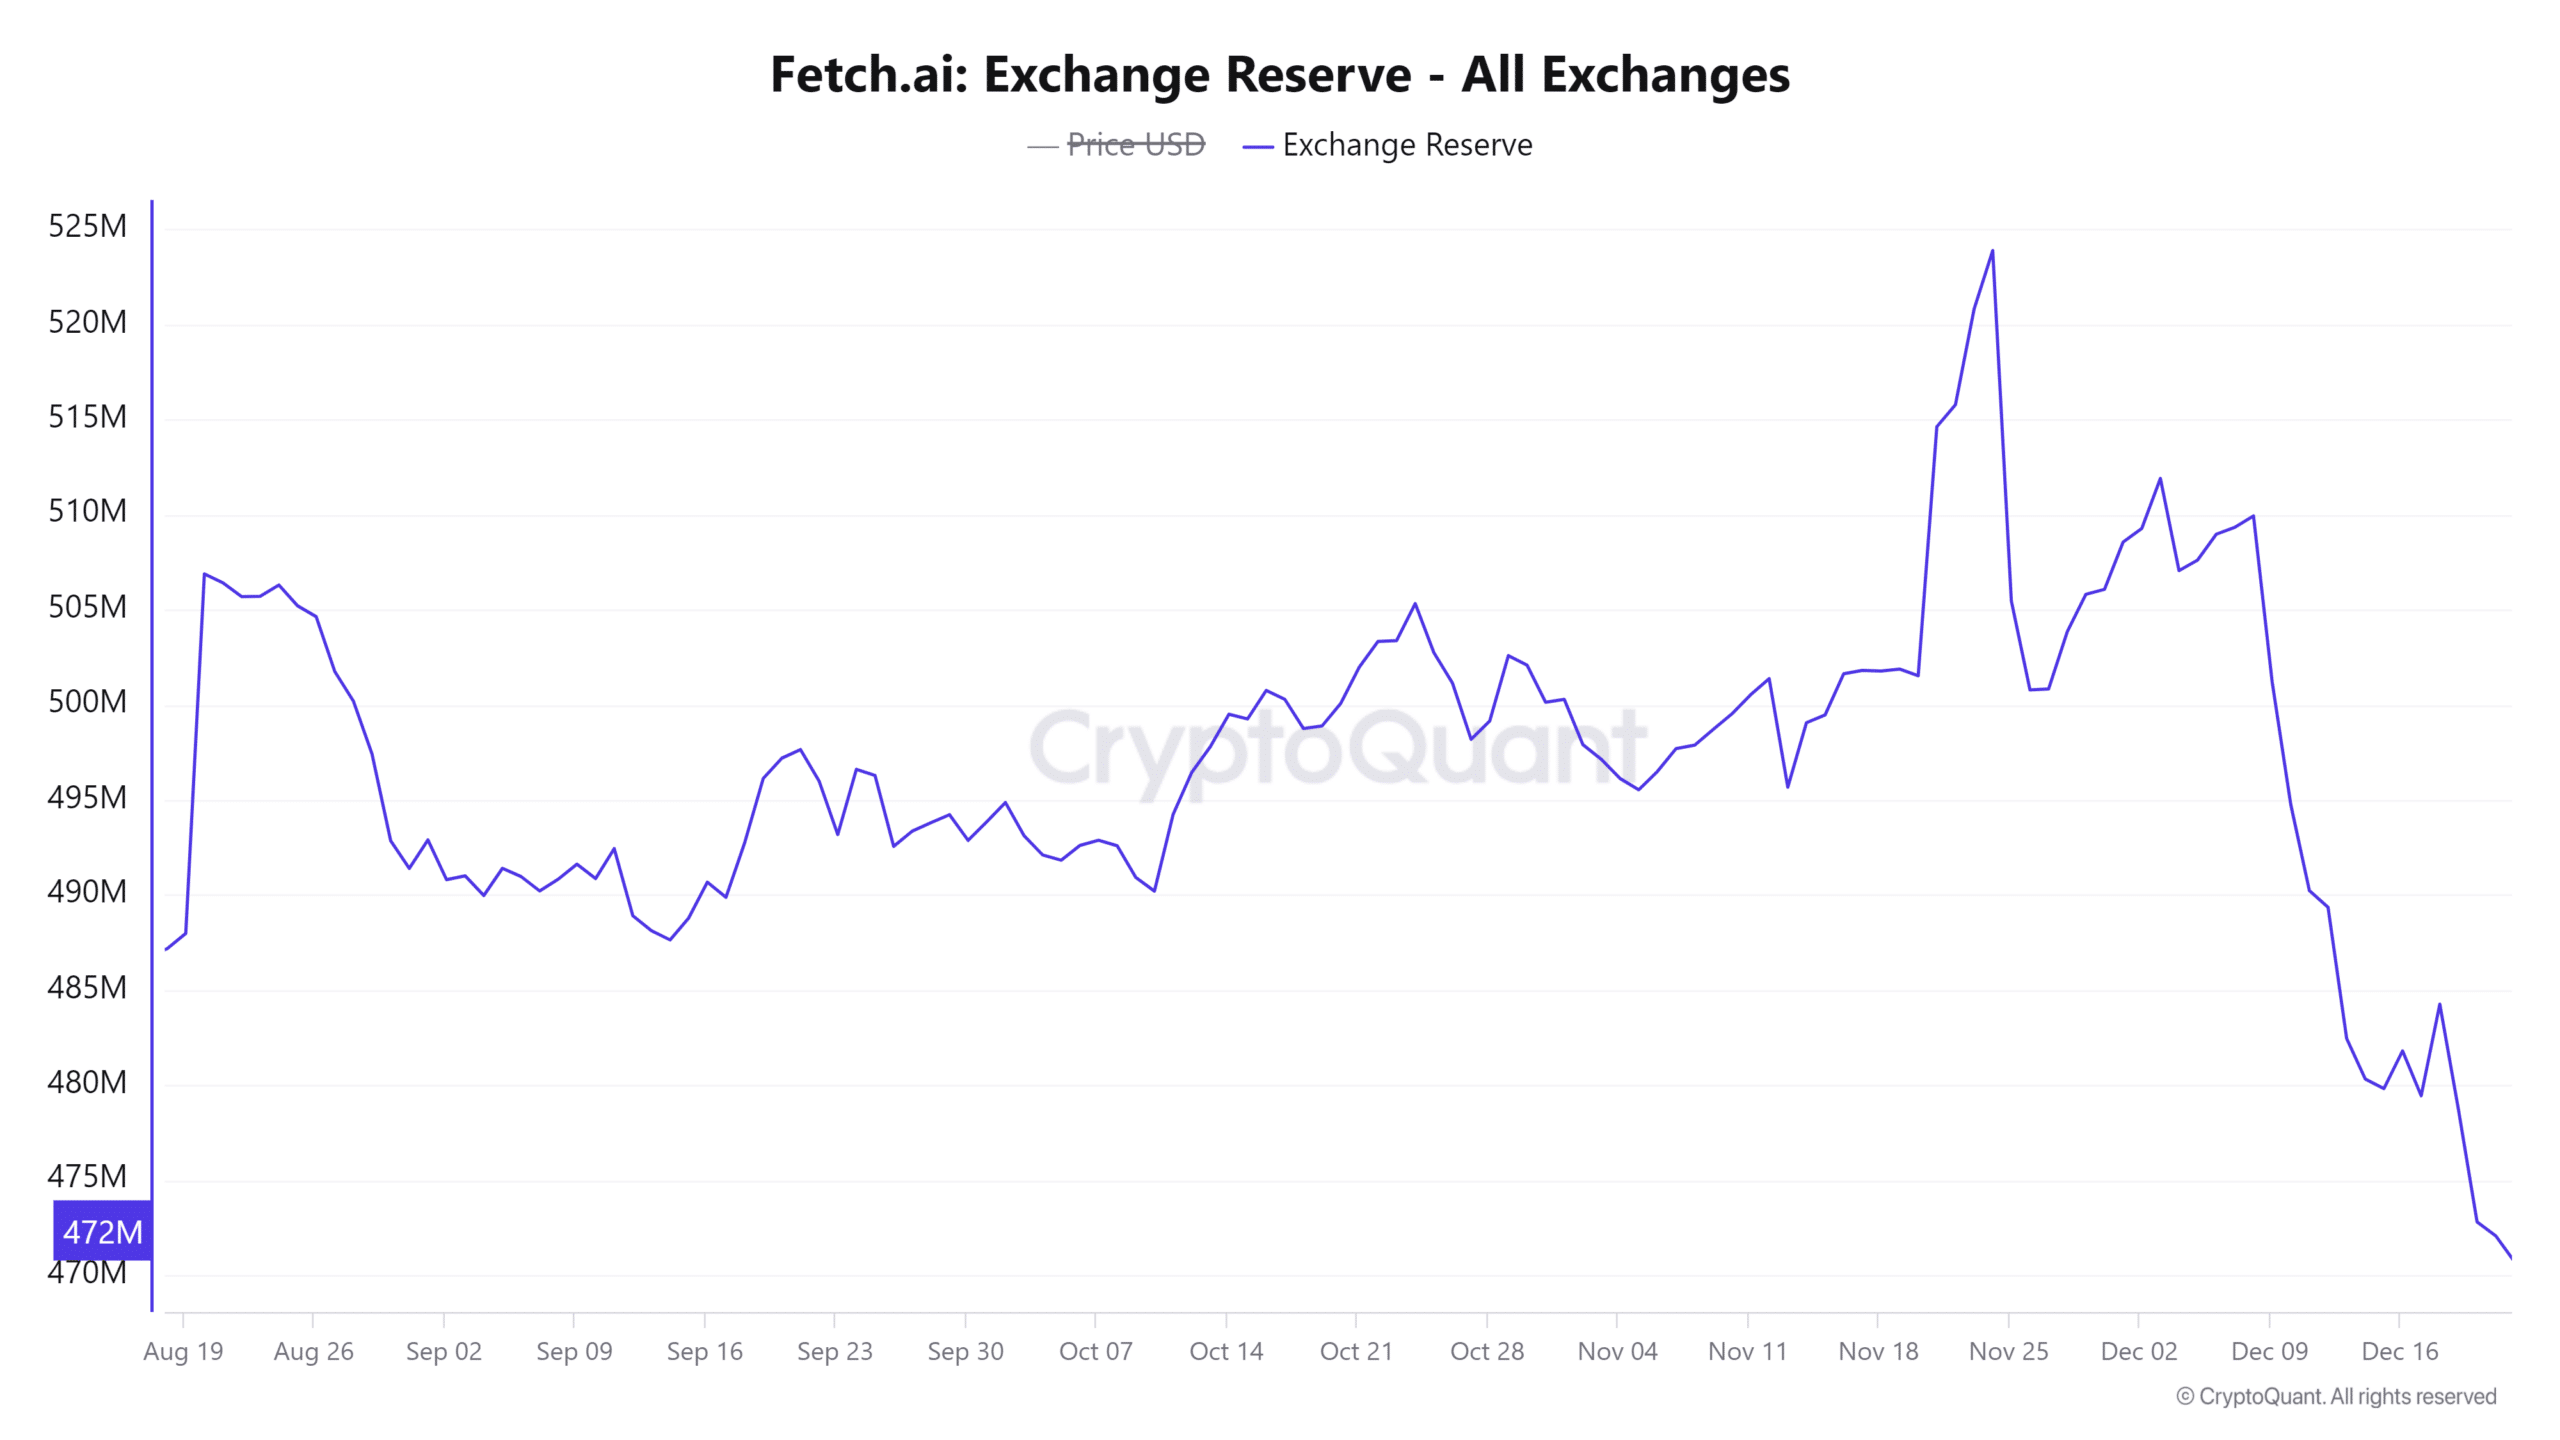
Exchange reserves have risen slightly by 0.12% to 471.4M FET, suggesting traders are holding coins on exchanges with caution.
However, a shift toward lower reserves could indicate accumulation, creating upward price pressure.
Therefore, keeping a close watch on this metric is critical for identifying sentiment changes and potential bullish signals.
FET technical indicators hint at possible momentum
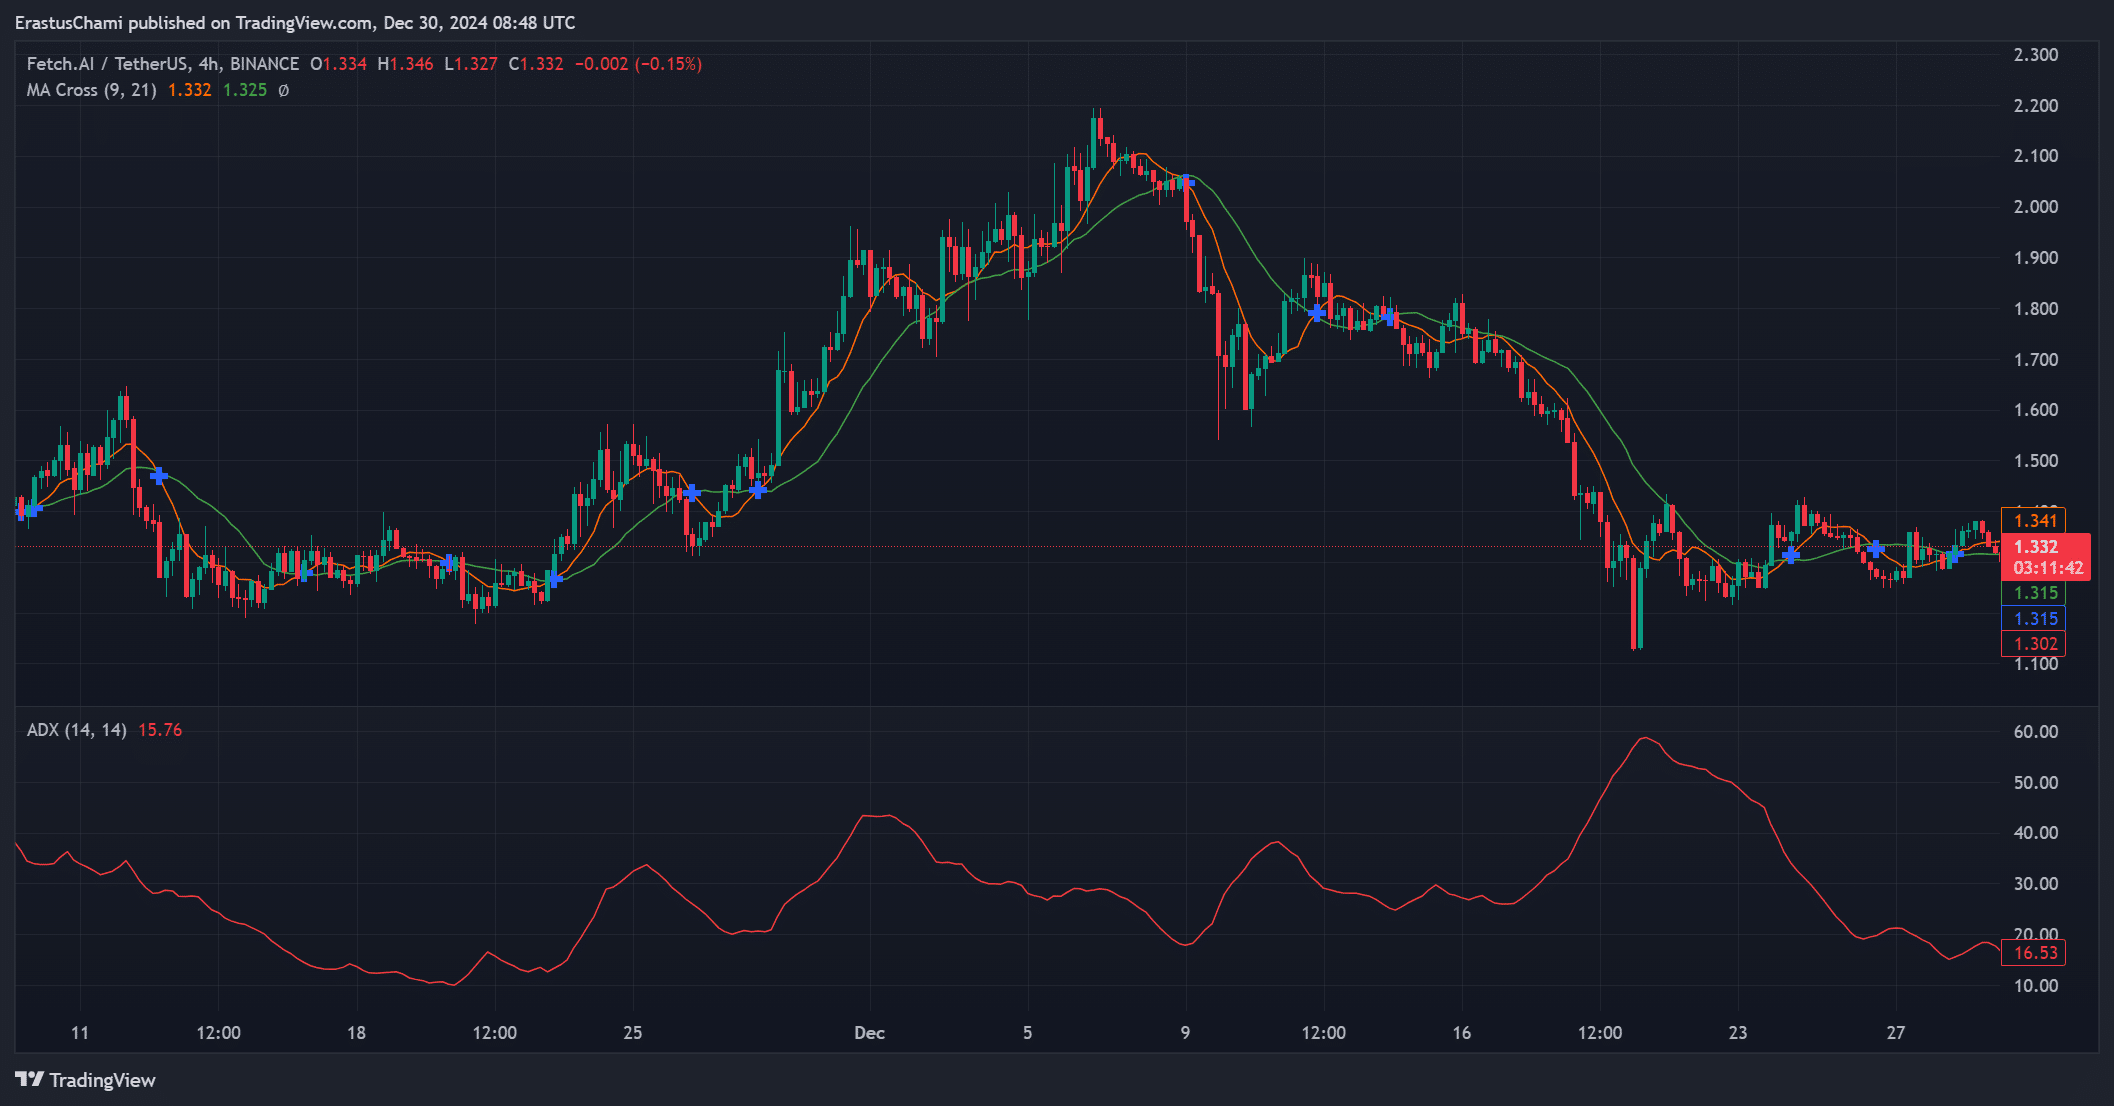
Technical indicators for FET paint a mixed picture. The moving average (MA) cross suggests a possible upward trajectory, adding to bullish hopes.
However, the Average Directional Index (ADX) at 15.76 indicates weak trend strength, requiring confirmation from price action and volume. This leaves traders eagerly awaiting stronger signals.
Liquidations could fuel bullish momentum
Liquidation data shows $13K in short liquidations compared to $1.56K in longs, highlighting bearish dominance in the short term.
However, a breakout above $1.38 could trigger significant short liquidations, potentially driving a sharp price rally. Such a scenario could amplify bullish sentiment and create substantial upward momentum.
Read Artificial Superintelligence Alliance [FET] Price Prediction 2024-25
Fetch.AI has all the elements in place for a 20-30% rally if it breaks above the $1.38 resistance level.
Increasing network activity, favorable technical signals, and potential liquidations suggest a strong bullish setup. Therefore, FET appears poised to deliver on its rally expectations in the near future.


