FET struggles against selling pressure – Could $0.295 be the final bottom?
FET sellers have no intent of relinquishing their grip on the market.

- FET may be set to remain in its downtrend and fall towards $0.42 next
- Lack of buying pressure meant no recovery was in sight at press time
Artificial Superintelligence Alliance [FET] has joined the list of altcoins that have fallen below their 2024 lows. In fact, the sentiment across the market has been growing increasingly bearish. Hundreds of millions of dollars worth of liquidations have been seen in the crypto market each day over the past two weeks.
The selling pressure that drove Bitcoin [BTC] below the $92k range low has not yet fully abated. And, investors must remain cautious. With Artificial Superintelligence Alliance token plunging towards new lows each week, and no recovery in sight, investors might want to remain sidelined.
Where will FET mark a local bottom on the charts?

The daily timeframe revealed a strong bearish trend in progress. The Directional Movement Index’s ADX (yellow) and -DI (red) were both above 20, highlighting the downward trend. The Choppiness Index’s reading was 39.92. This meant that the market was less choppy and had a strong directional trend, bearish in this case.
The OBV backed up this finding by trending downwards since mid-December. This downtrend seemed to be characterized by persistent selling volume behind FET. Hence, it was not a consolidation phase that saw accumulation from holders. According to the OBV, buyers were scant and scattered.
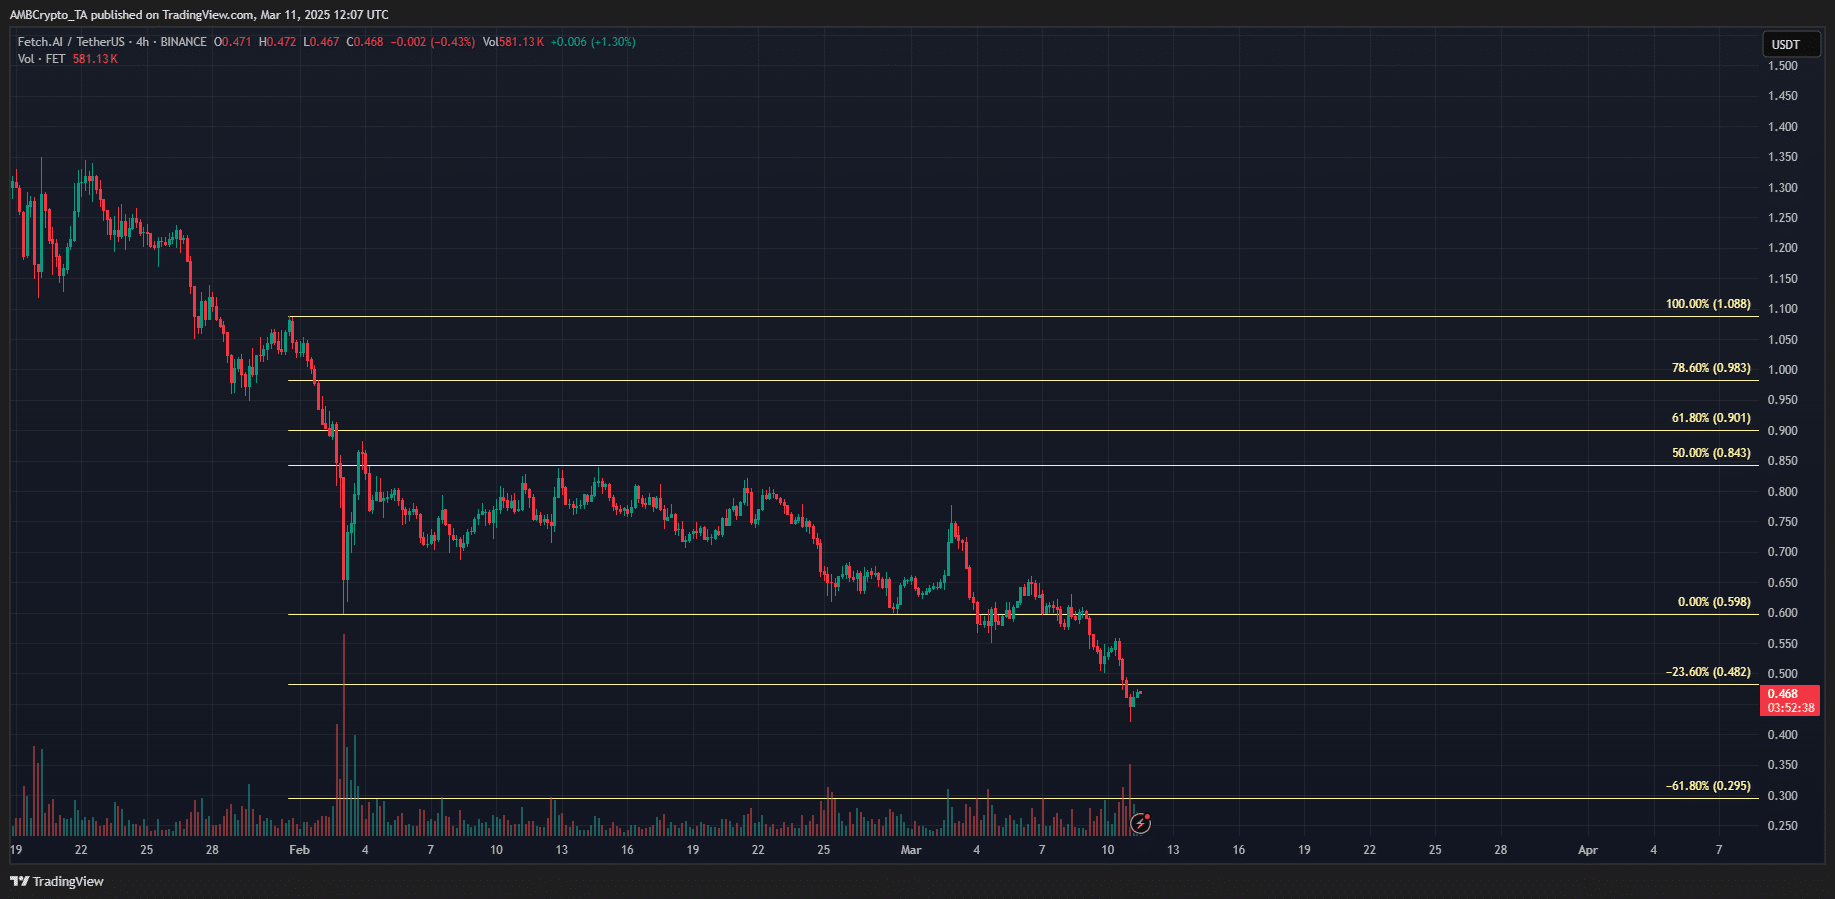
The 4-hour chart illuminated the lower timeframe situation. It showed that the $0.6 support from February was tested multiple times. And, it eventually gave way in the first week of March. The Fibonacci extension levels showed that the 23.6% level at $0.482 posed little opposition to the price.
Hence, it may be likely that FET would retest the $0.48-$0.52 region as resistance before falling lower. The 61.8% extension level at $0.295 would be the next target. The $0.35-$0.37 level could also act as support on the way down.
Traders can expect a bounce to $0.5-$0.52, followed by a drop to $0.37 or $0.42. If the downtrend continues, more losses and a move to $0.295 might be plausible.
Disclaimer: The information presented does not constitute financial, investment, trading, or other types of advice and is solely the writer’s opinion
![Stacks [STX] crashes to $0.13 even as PoX-5 testnet goes live – Why?](https://ambcrypto.com/wp-content/uploads/2026/07/IMG-20260725-WA0006.jpg)