FET tests key support level: Can it reverse the 14% price drop?

- Market sentiment around the AI token turned bearish in the last few days.
- Most technical indicators hinted at a continued price drop.
Artificial Superintelligence Alliance [FET] bears have been controlling the token’s price as it witnessed major price corrections. However, things can change soon if a condition is met. Let’s have a closer look at what’s going on with FET.
FET to turn bullish again?
CoinMarketCap’s data revealed that FET’s price fell to a massive correction last week as its value dropped by 14%. The bears kept the control in the last 24 hours as well by pushing the token down by more than 8%.
At the time of writing, FET was trading at $1.11 with a market capitalization of over $2.7 billion, making it the 28th largest crypto.
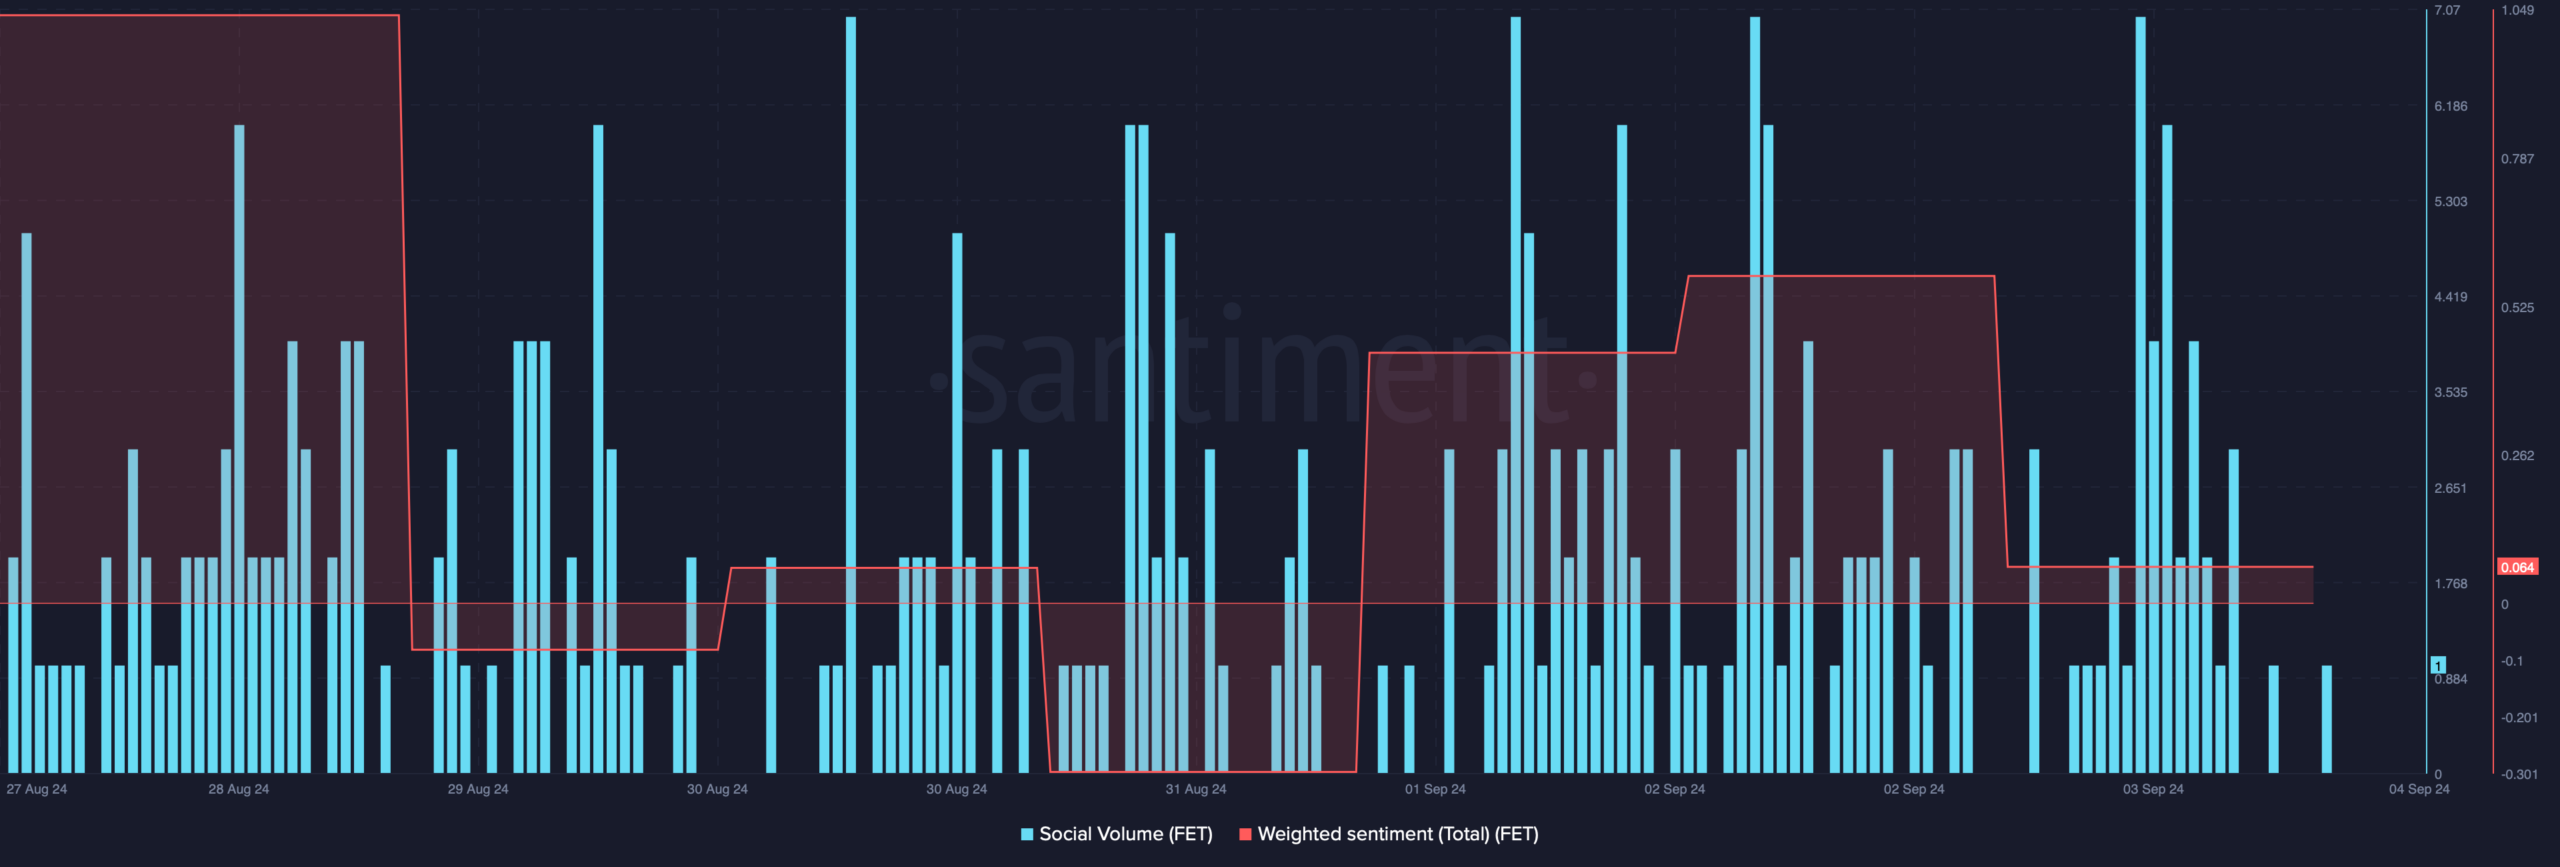
Because of the price downtick, the token’s weighted sentiment also fell. This meant that bearish sentiment around the token increased in the market. But its social volume remained stable, reflecting FET’s popularity in the crypto space.
The better news was that this downtrend might be short-lived as the token was testing a crucial support level. World Of Charts, a popular crypto analyst, recently posted a tweet revealing this.
In case of a successful test of the support, investors might witness FET beginning its journey towards $1.5 once again.
What to expect from FET
Since there were chances of FET turning bullish, AMBCrypto checked its on-chain data to find how likely it is for the token to register greens. As per our analysis of Santiment’s data, buying pressure on the token increased substantially in the last few days.
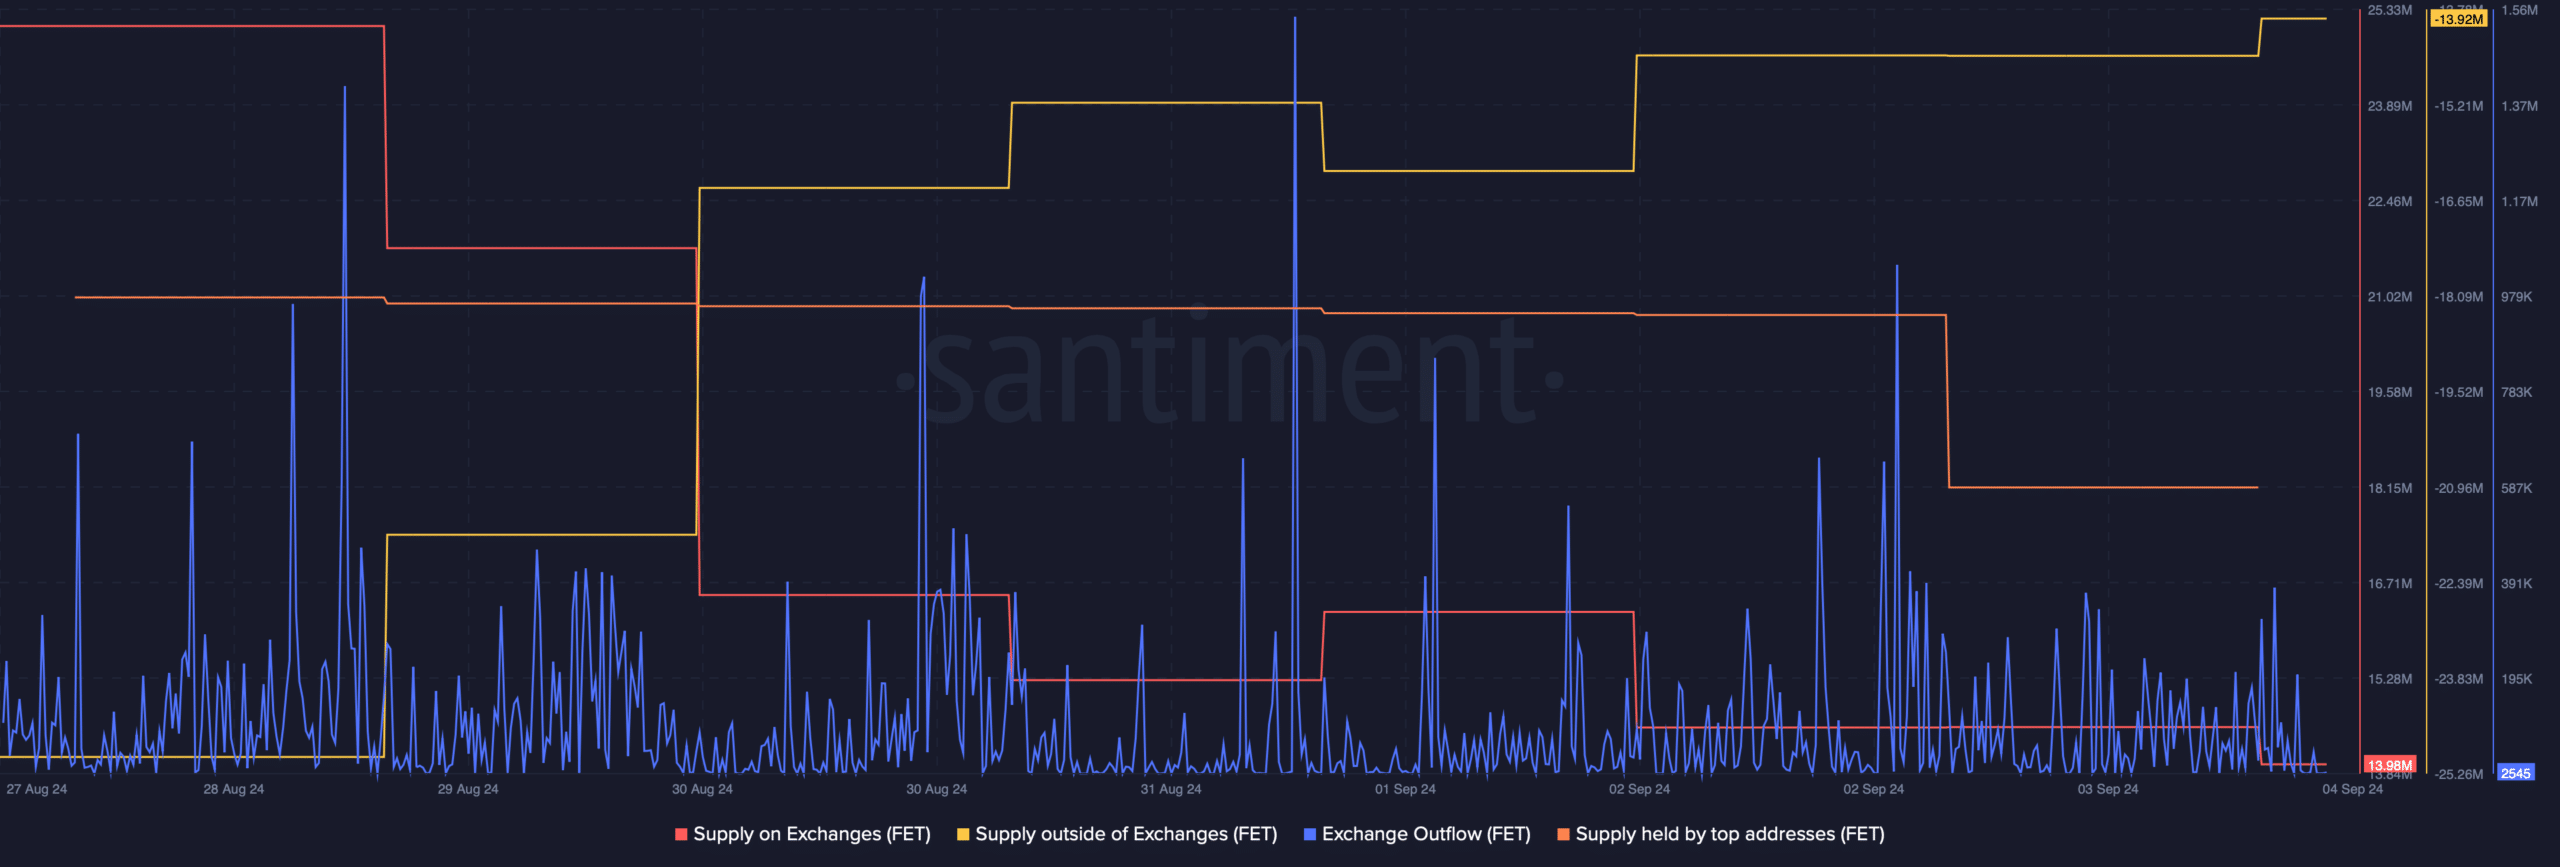
This was evident from the rise in its supply outside of exchanges while its supply on exchanges dropped. The fact that investors were buying FET was further proven by the increase in exchange outflow.
However, the whales didn’t have much confidence in the token as the supply held by top addresses declined on the 3rd of September. Therefore, we checked Hyblock Capital’s data.
As per our analysis, FET’s whale vs retail delta had a value of 0 at press time. For starters, this indicator ranges from -100 to 100, with 0 representing whales and retail positioned exactly the same.
Read FET Price Prediction 2024- 2025
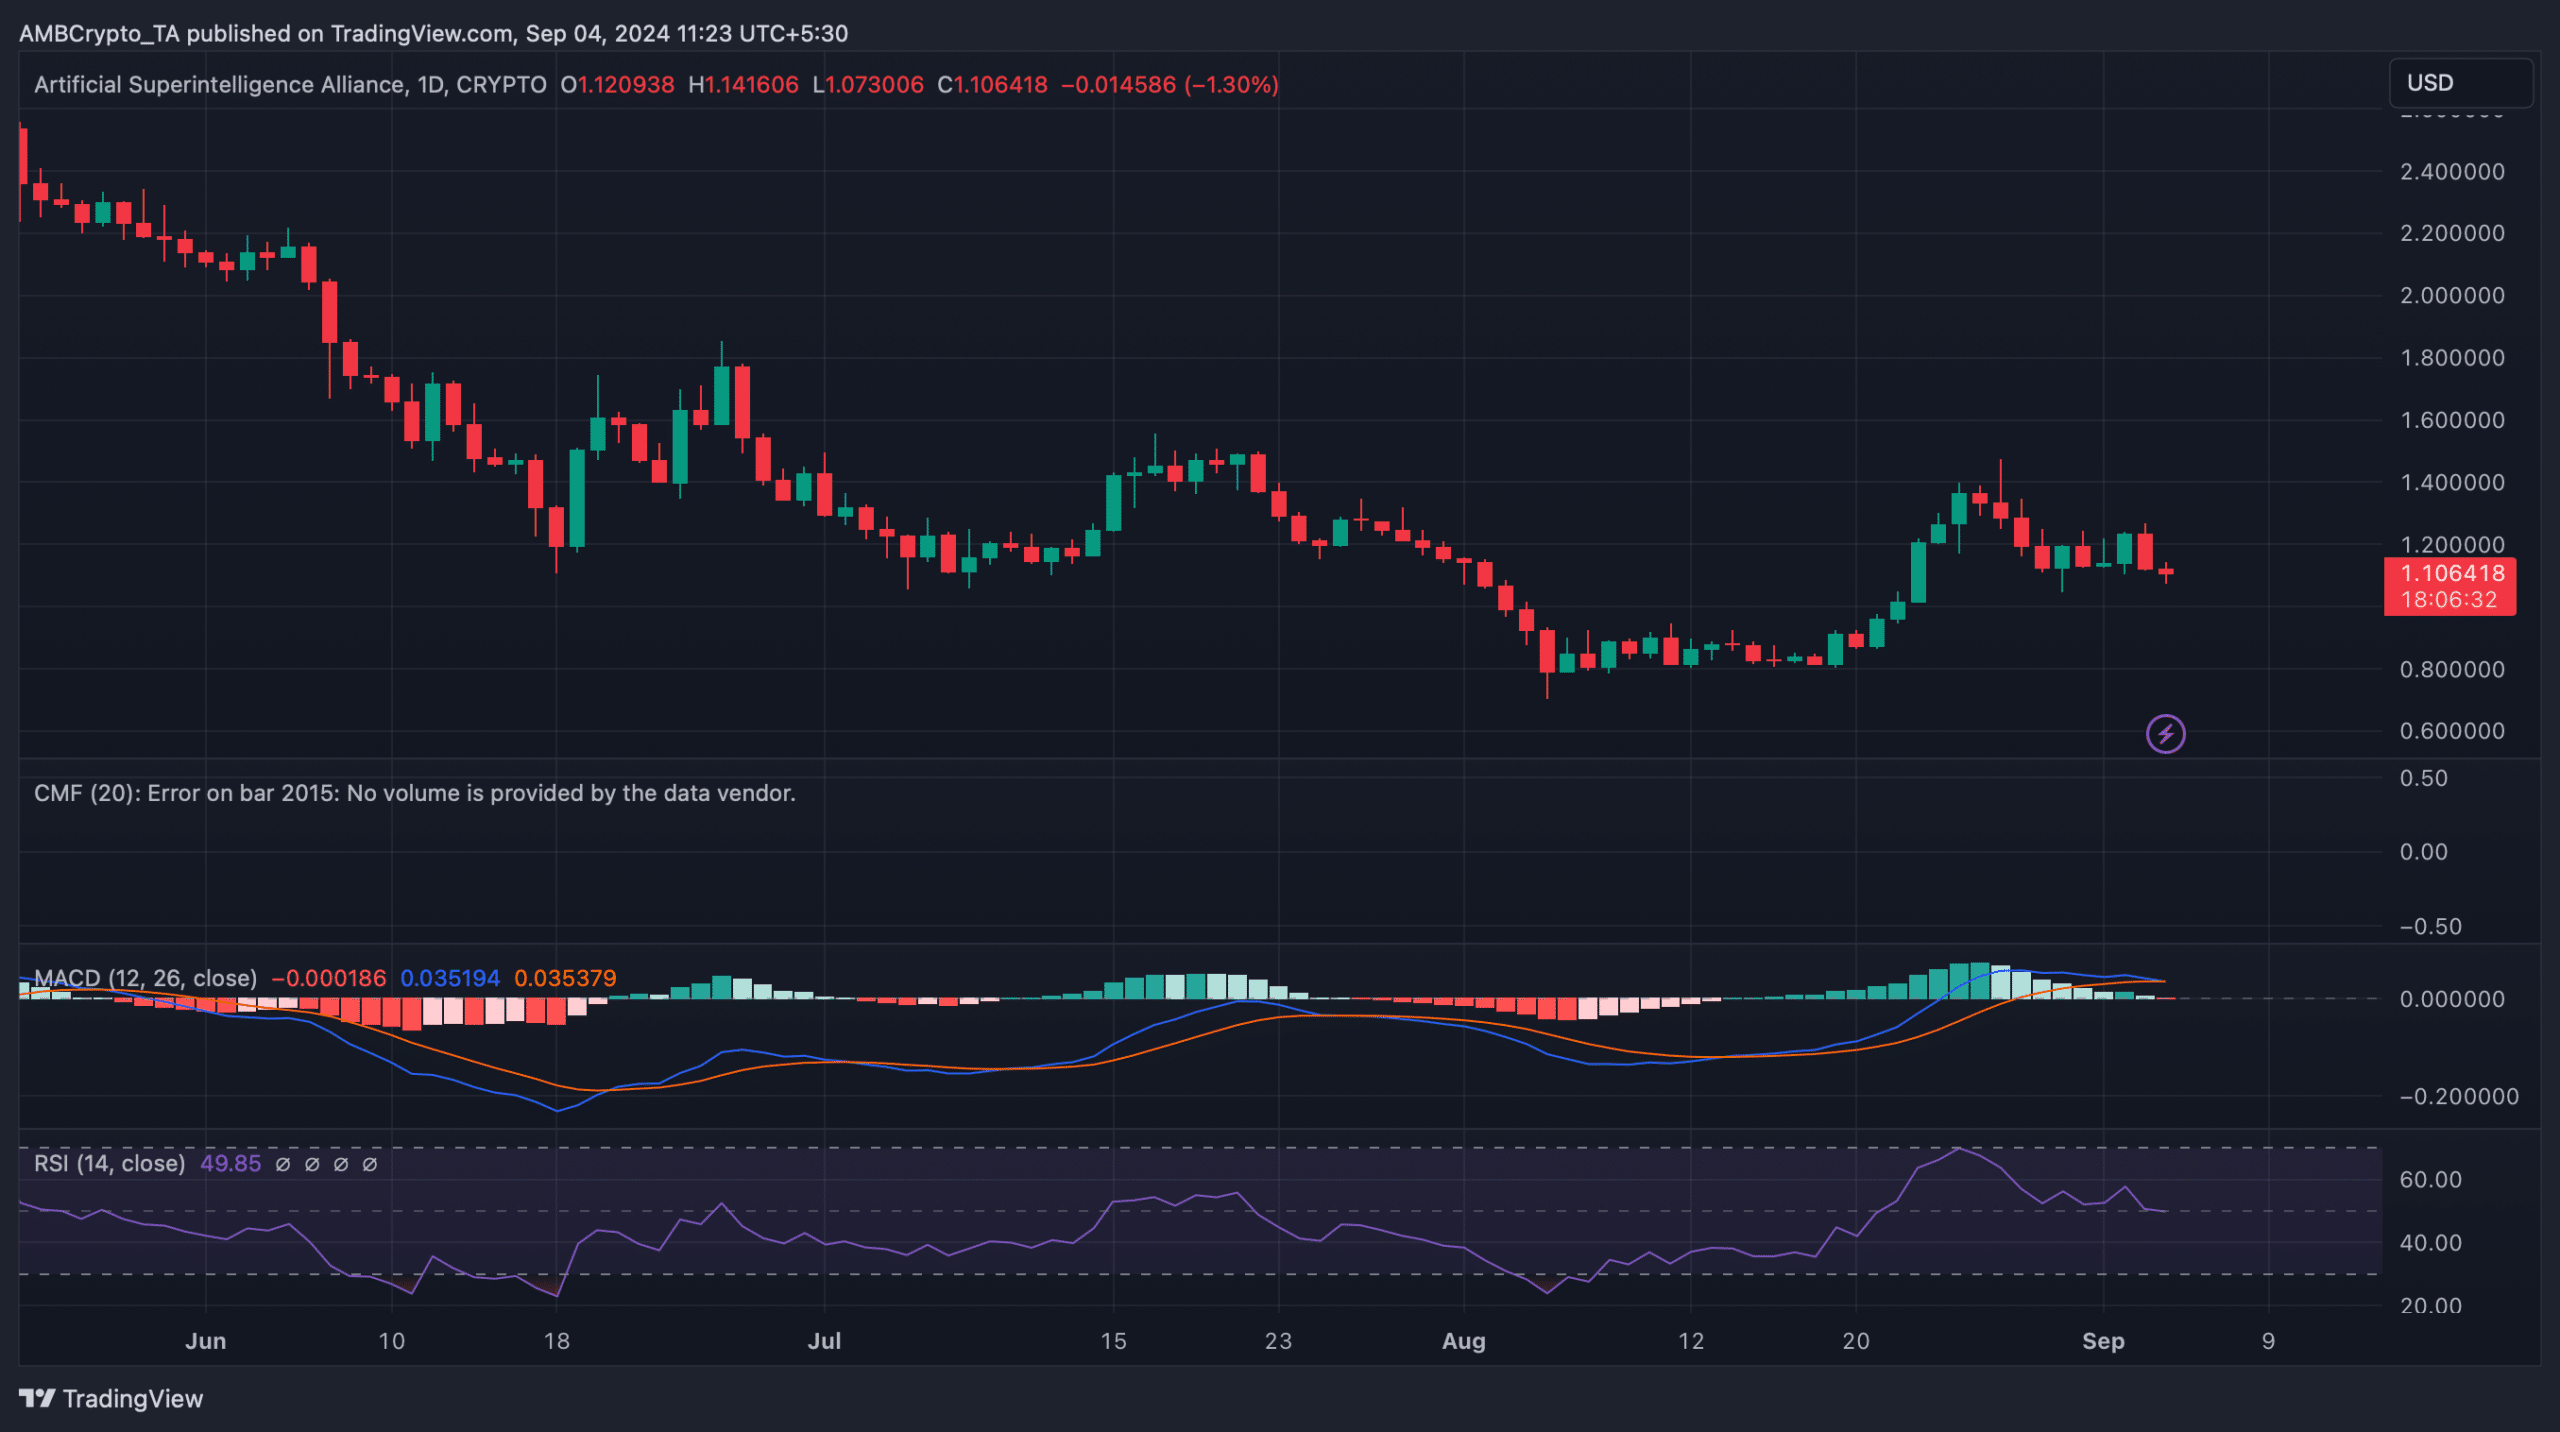
We then assessed the token’s daily chart to better understand the odds of Fet successfully testing its support. The technical indicator MACD displayed the possibility of a bearish crossover.
The Relative Strength Index (RSI) also registered a downtick. Both of these indicators suggested that FET might not be able to test its support, which might result in a continued price decline.


