- FET has made enormous gains in the past two months and demand has not slowed down
- A break of the local swing high has occurred and signaled a bullish continuation
Fetch.ai [FET] reached an all-time high of $3.34 on the 27th of March. At press time it was trading at $3.09, just below the swing high that the token set on the 10th of March. The price action indicated bullish continuation was underway.
The trading volume was strengthening, and the sentiment in the futures market was firmly in favor of the bulls.
AMBCrypto plotted some key levels for FET in the coming weeks. The Superintelligence Alliance announcement served to kindle bullish euphoria.
The Fibonacci extension levels could be pivotal
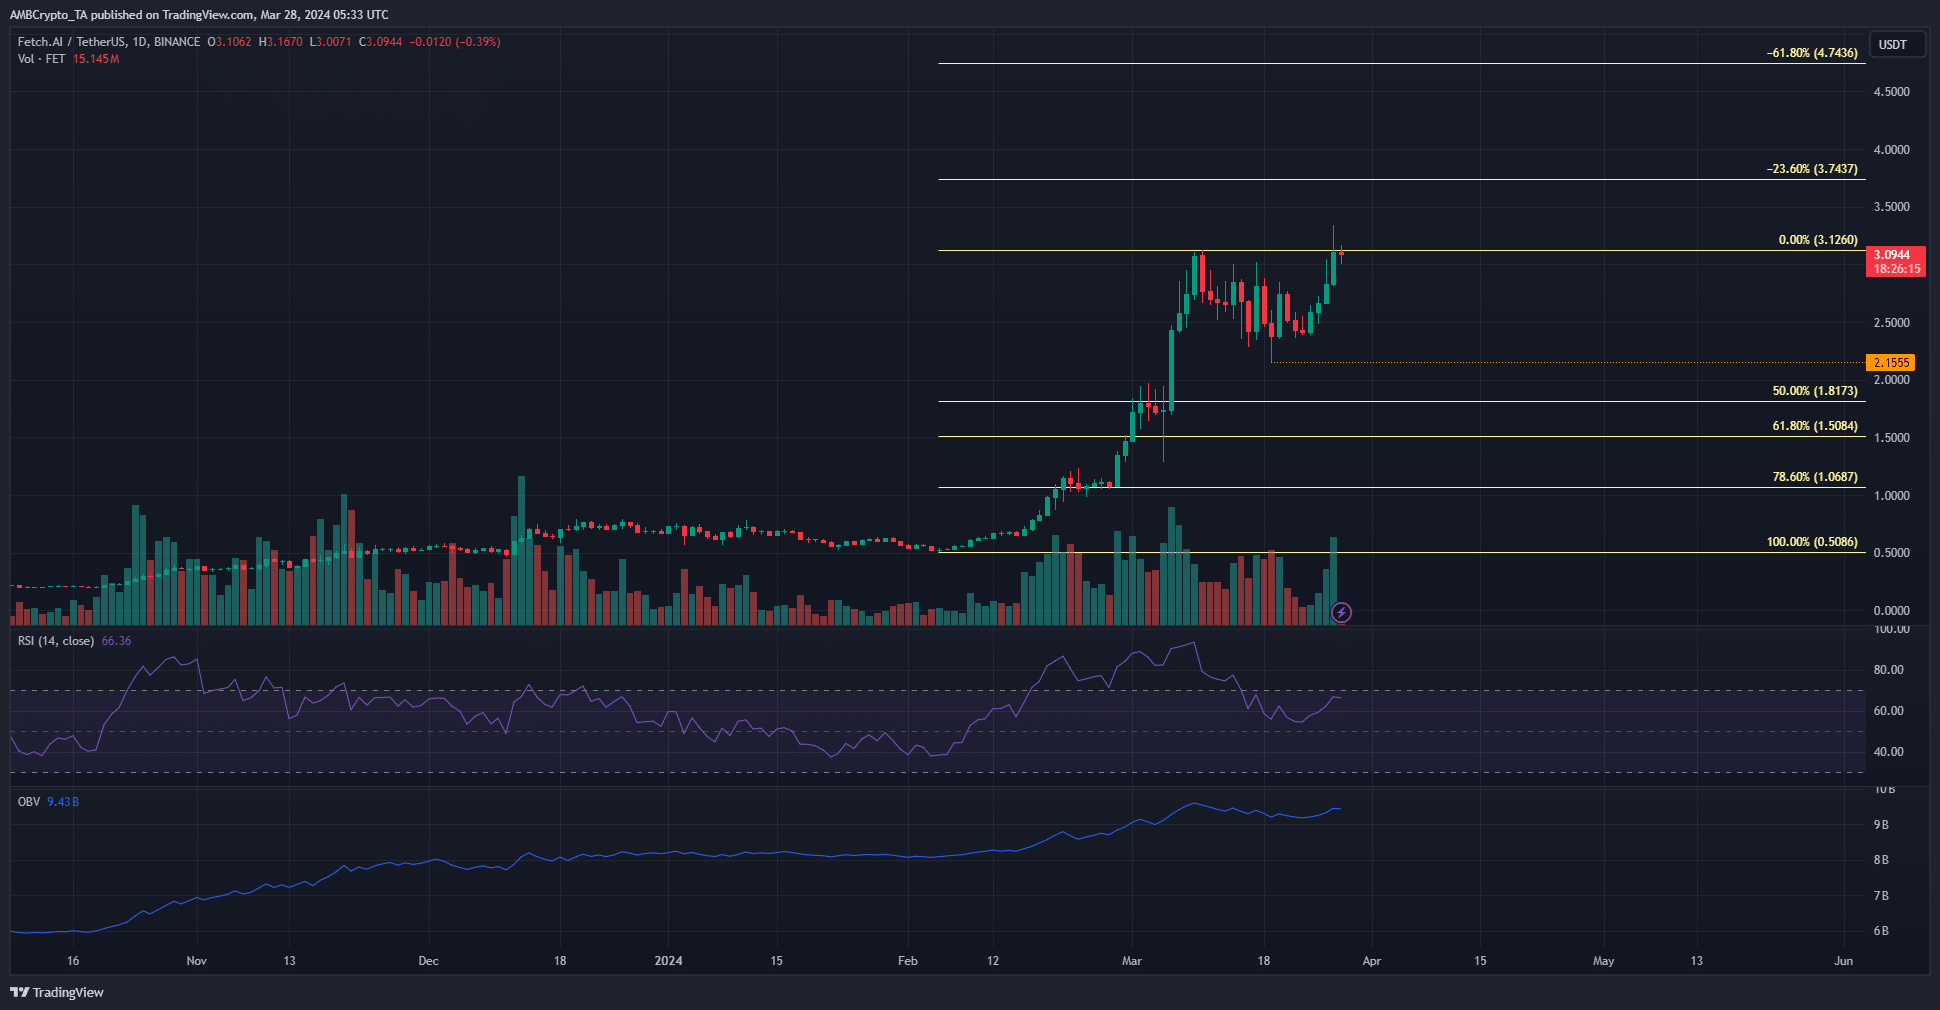
Source: FET/USDT on TradingView
On the daily chart, FET had made a swing low at $0.5086 in February before embarking on the current rally. This move measured 508% in under two months and was set to reach higher. The OBV also trended higher to indicate buying volume was immense during the rally.
The past two weeks saw the OBV dip but it was a minor pullback compared to the gains made since February. The RSI on the daily timeframe also stayed above neutral 50 to signal bullish momentum.
The Fibonacci retracement levels were plotted based on the February-March rally. It showed the 50% retracement level was at $1.81, but FET’s pullback halted at $2.15. This showed that bullish conviction was sky-high.
The 61.8% and 100% extension levels at $4.74 and $5.74 are the next targets for holders to book profits.
Analyzing the short-term sentiment
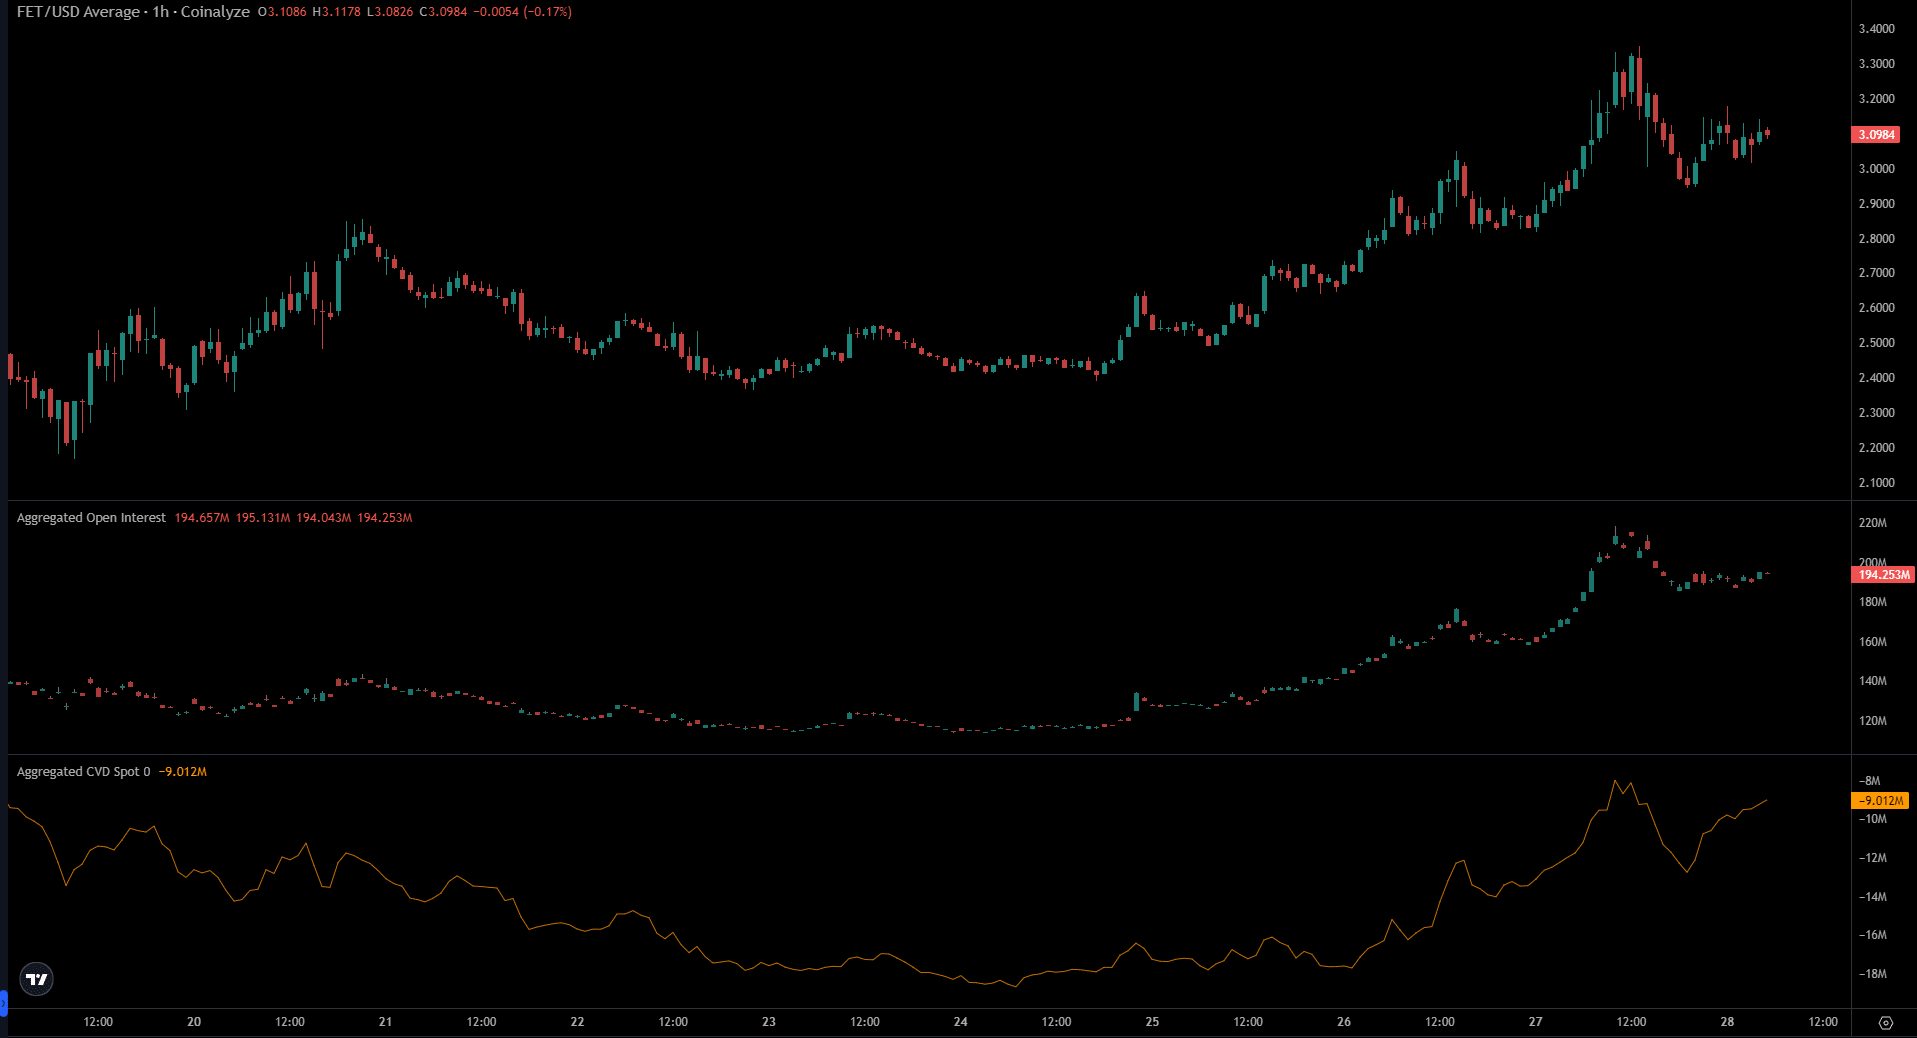
Source: Coinalyze
The uptick in trading volume and the shallow pullback showed bulls were dominant on the 1-day timeframe.
Is your portfolio green? Check the Fetch.ai Profit Calculator
Looking at the lower timeframe data from Coinalyze, AMBCrypto noted that both the Open Interest and the spot CVD were trending upward.
This showed that speculators were willing to go long as prices climbed past $2.8 on the 26th of March. It was another reflection of bullish conviction. The demand in the spot market was also encouraging.
Disclaimer: The information presented does not constitute financial, investment, trading, or other types of advice and is solely the writer’s opinion.