Altcoin
FET’s potential structure shift – Can it climb to $3.5 before 2025?
FET flashed bullish weekly trends, and a short-term target could be on the horizon soon.

- FET overall outlook was bullish despite starting off with 11% drawdown this week.
- Over $1.2B in leveraged positions risk liquidation if price trades back to around $2.
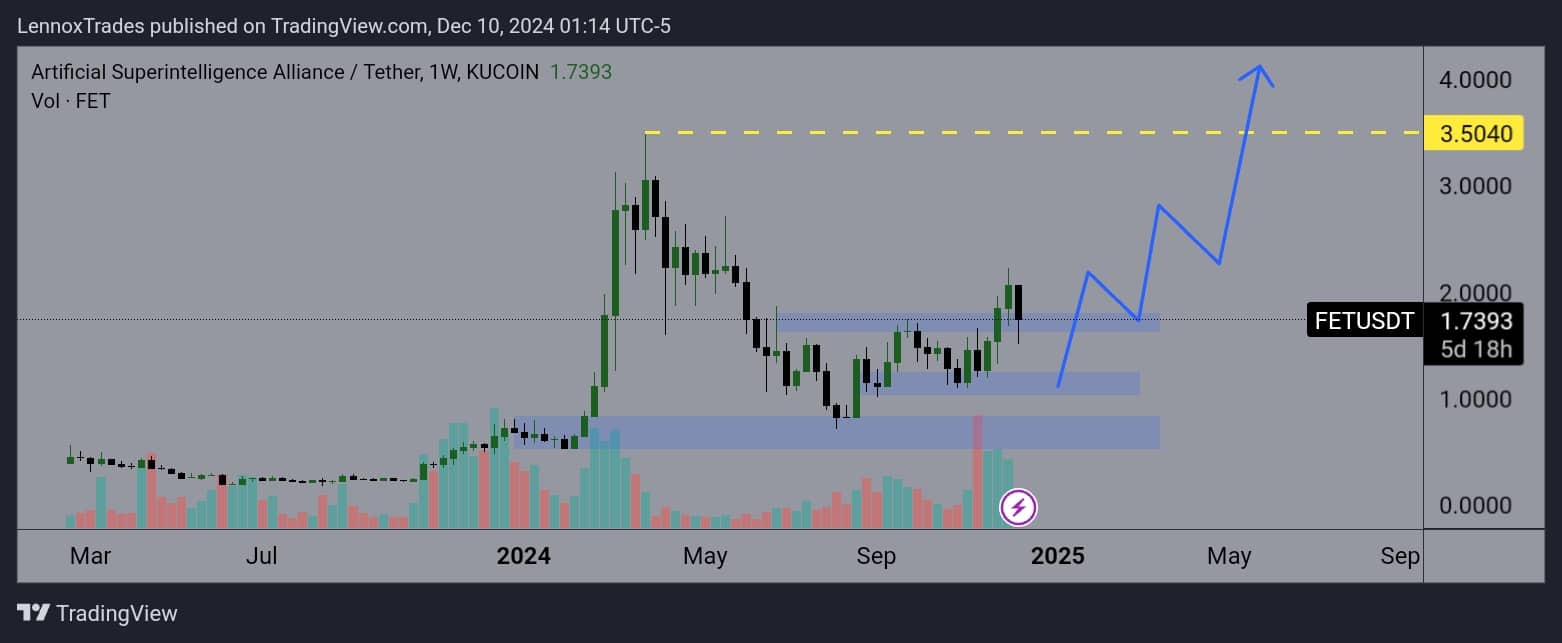
Artificial Superintelligence Alliance (FET) went down by more than 11% in the last 24 hours, with the daily trading volume surging by 150%+. In fact, an analysis of the weekly chart of FET/USDT depicted bullishness as the price was yet to break below $1.74 – A level that potentially determines structure shift in this case.
The solid uptrend formed with FET’s price progressively rising from $0.5 in September to its press time levels of $1.74. Here, the market structure was framed by a series of higher lows and higher highs, indicating strong buying pressure.
The $1.74-level is key as it has acted as a transition zone between bullish and bearish sentiments. However, the small bullish wick below this week’s candle suggested potential uptrend continuation.
The small wick represented buyers trying to push the price higher, although it does face some resistance near $2. To put it simply, the chart patterns suggested a possible hike towards $3.5, basing the continuation on the existing bullish momentum.
If the uptrend maintains its strength, and the market conditions remain favorable, reaching or surpassing the $3.5 target in the forthcoming weeks to months could be feasible. This would mean an over 99% hike from its press time price levels.
Key liquidation zones for FET
The 24-hour FET/USDT liquidation heatmap on Binance highlighted key liquidity zones and potential leveraged risks.
With FET’s price near $2.00, over $1.2 billion in leveraged positions seemed to be at risk of liquidations. Especially if the price rises above these average price levels.
The $1.8-level is a critical support zone, as the large number of liquidations at the level could trigger further price declines.
Conversely, the resistance zone was found near $2.1, where liquidations could propel upward price movements.
This scenario indicated potential volatility, with the price gravitating towards these high liquidity zones, impacting market dynamics significantly.
Daily active addresses
Analyzing FET on-chain activity revealed distinct trends in network engagement over time. The active addresses’ peaks hit new highs recently. Also, the significant observation was the correlation between spikes in active addresses and price hikes.
This pattern suggested an uptick in network activity, often coinciding with rising prices – Possibly indicating buying pressure or heightened trading activity.
The new addresses also peaked around these periods, which could imply new user adoption or greater interest in FET.
Conversely, zero balance addresses did not show a consistent pattern with the price, indicating that they could not directly influence price movements but rather reflected post-transaction states.
This activity seemed to be in line with FET’s bullish price action. This suggested that as more users engage with the network, possibly through transactions or by holding FET, its demand increases – A bullish signal.


