
- FLOKI has fallen below a key support level.
- Key technical indicators suggest the possibility of a further price decline.
Floki Inu [FLOKI] breached the lower line of its ascending channel to close below support on the 11th of June, AMBCrypto found.
At press time, the meme coin exchanged hands at $0.00023, having lost 28% of its value in the past seven days, according to CoinMarketCap.
FLOKI began to trend within the ascending channel on the 13th of April when its price initiated a rally. This channel is usually formed when an asset’s price movement consistently creates higher highs and higher lows.
However, by the 5th of June, FLOKI’s price rallied to an all-time high of $0.00035 and has since begun to decline. It trended downward toward the lower line of the channel, which had formed support at $0.00025.
On the 11th of June, the token’s price fell below support to close at $0.00023.
More declines on the horizon?
AMBCrypto assessed some key indicators and found that they hinted at the possibility of a further decline in FLOKI’s value.
For example, its key momentum indicators rested below their respective center lines. FLOKI’s Relative Strength Index (RSI) was 46.55, while its Money Flow Index (MFI) was 46.32.
These indicators identify overbought or oversold conditions in a market by measuring the momentum and changes in an asset’s price movements.
At their values at press time, FLOKI’s RSI and MFI suggested that selling pressure outweighed buying activity.
The meme coin’s negative Chaikin Money Flow (CMF) also confirmed this. This indicator measures how money flows into and out of an asset.
A negative CMF value indicates market weakness, which signals increased liquidity exit. This is a bearish sign, and traders interpret it as a precursor to a further price decline.
As of this writing, FLOKI’s CMF was -0.04.
Further, FLOKI’s Aroon Down Line (blue) confirmed the strength of its current downtrend. It was at 100% at press time.
This indicator measures an asset’s price trend strength and identifies potential reversal points.
When the Down Line is close to 100%, the downtrend is strong, and the most recent low was reached relatively recently.
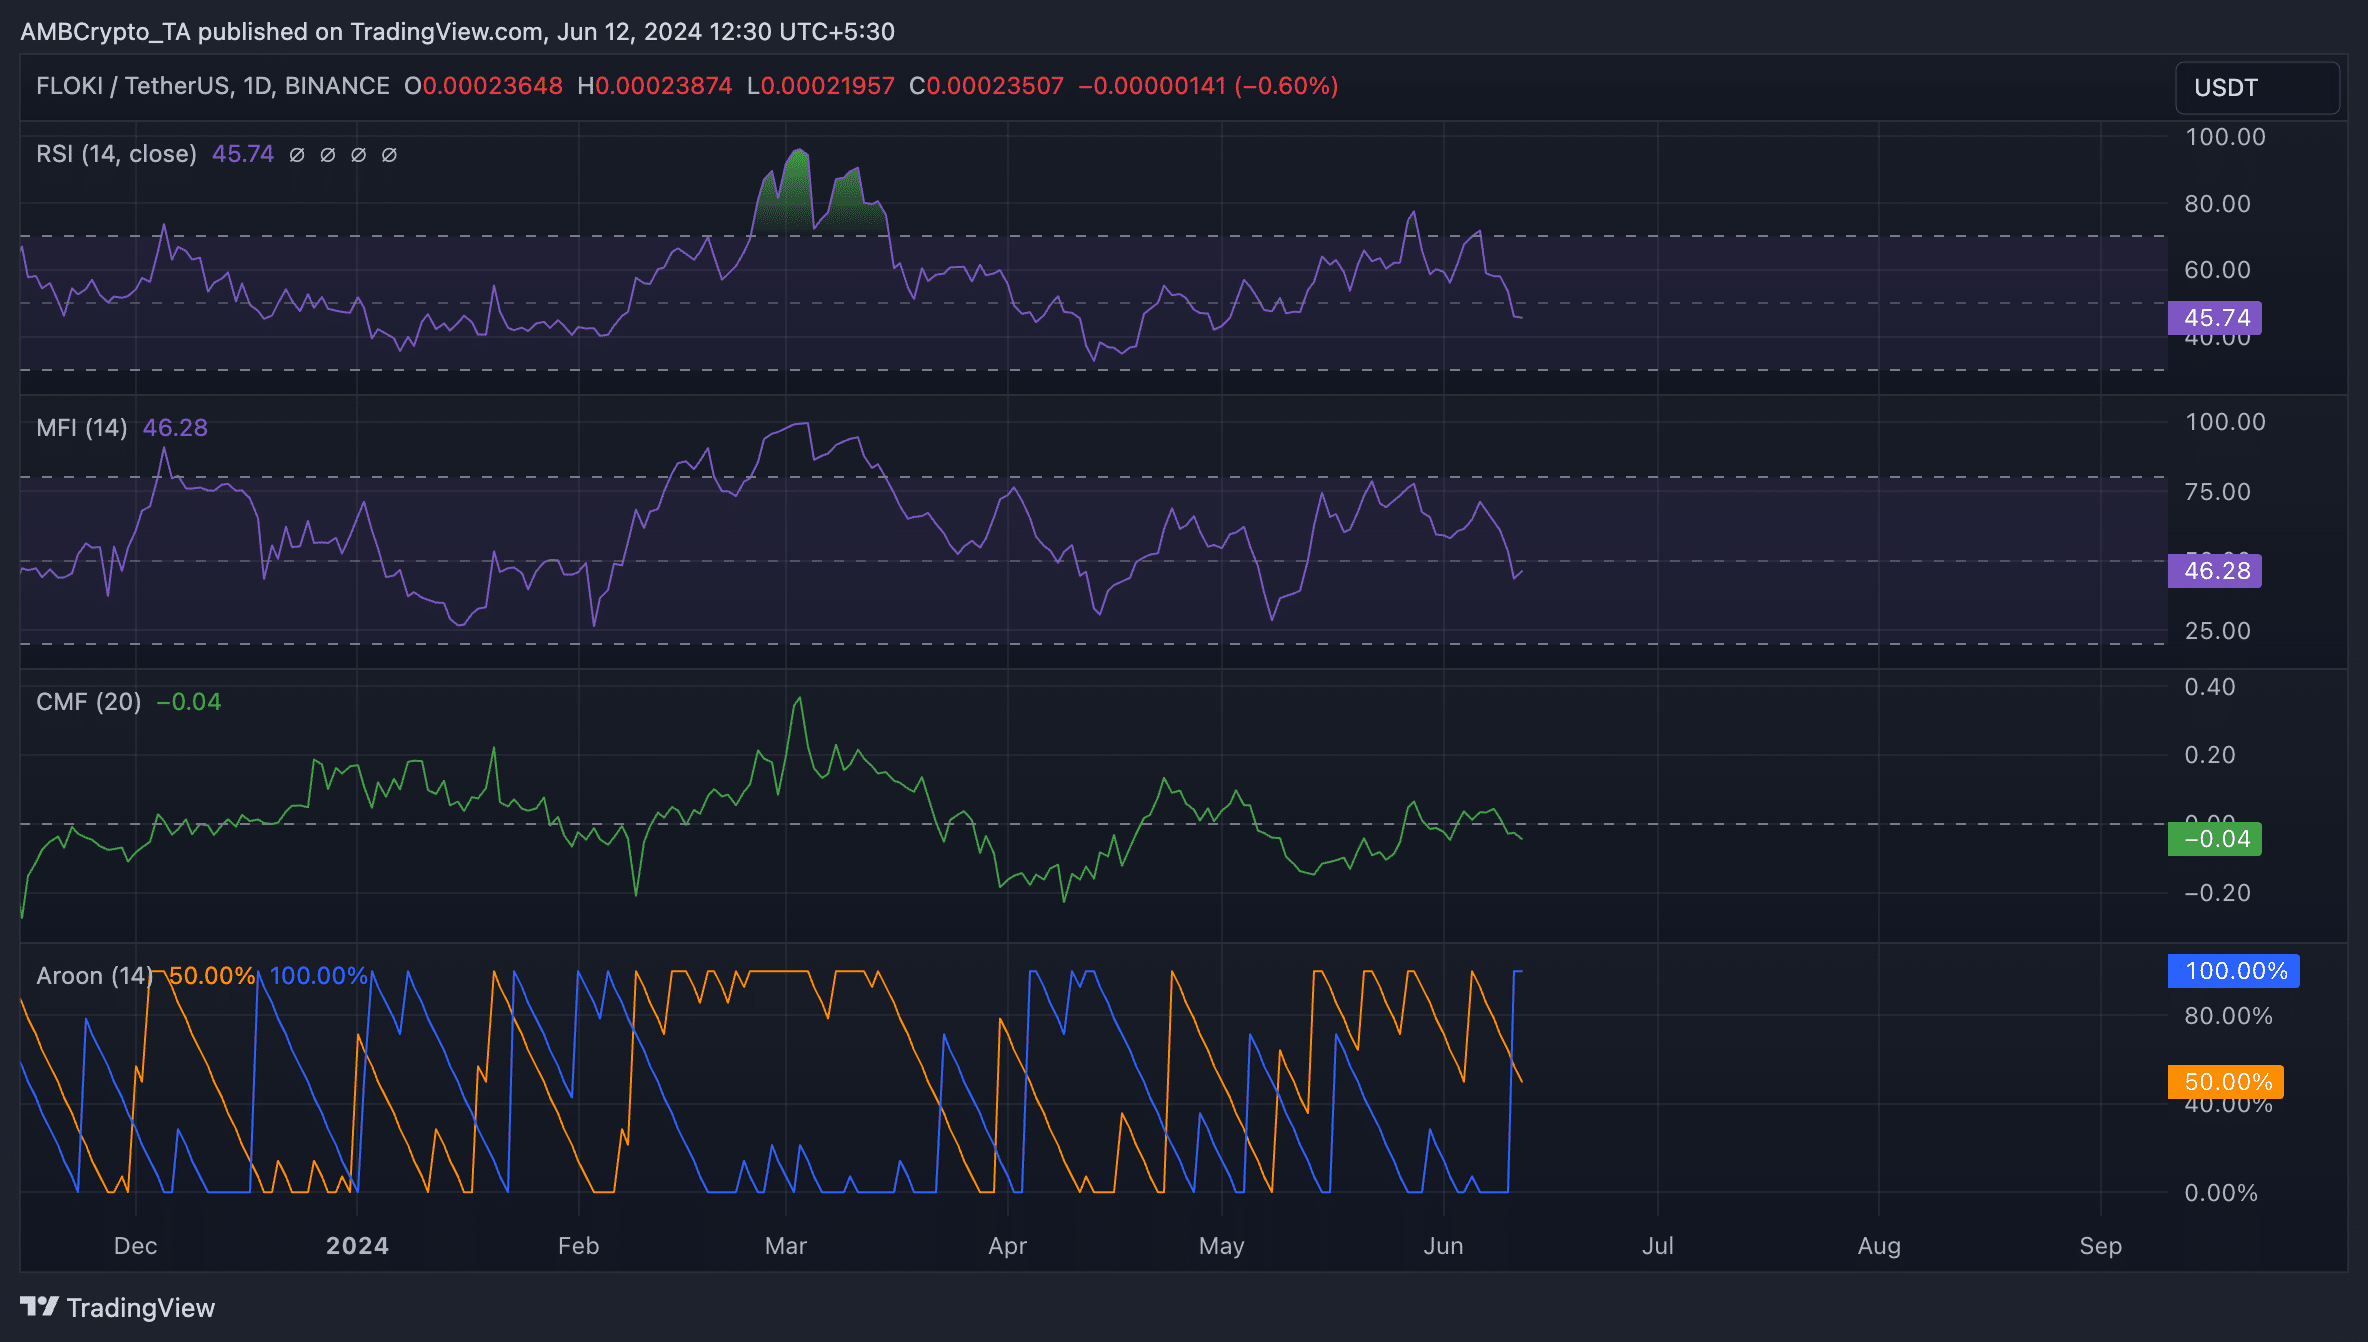
Source: TradingView
Realistic or not, here’s FLOKI’s market cap in DOGE terms
If this trend continues, FLOKI’s price may slip under the $0.0002 price territory to exchange hands at $0.0001.
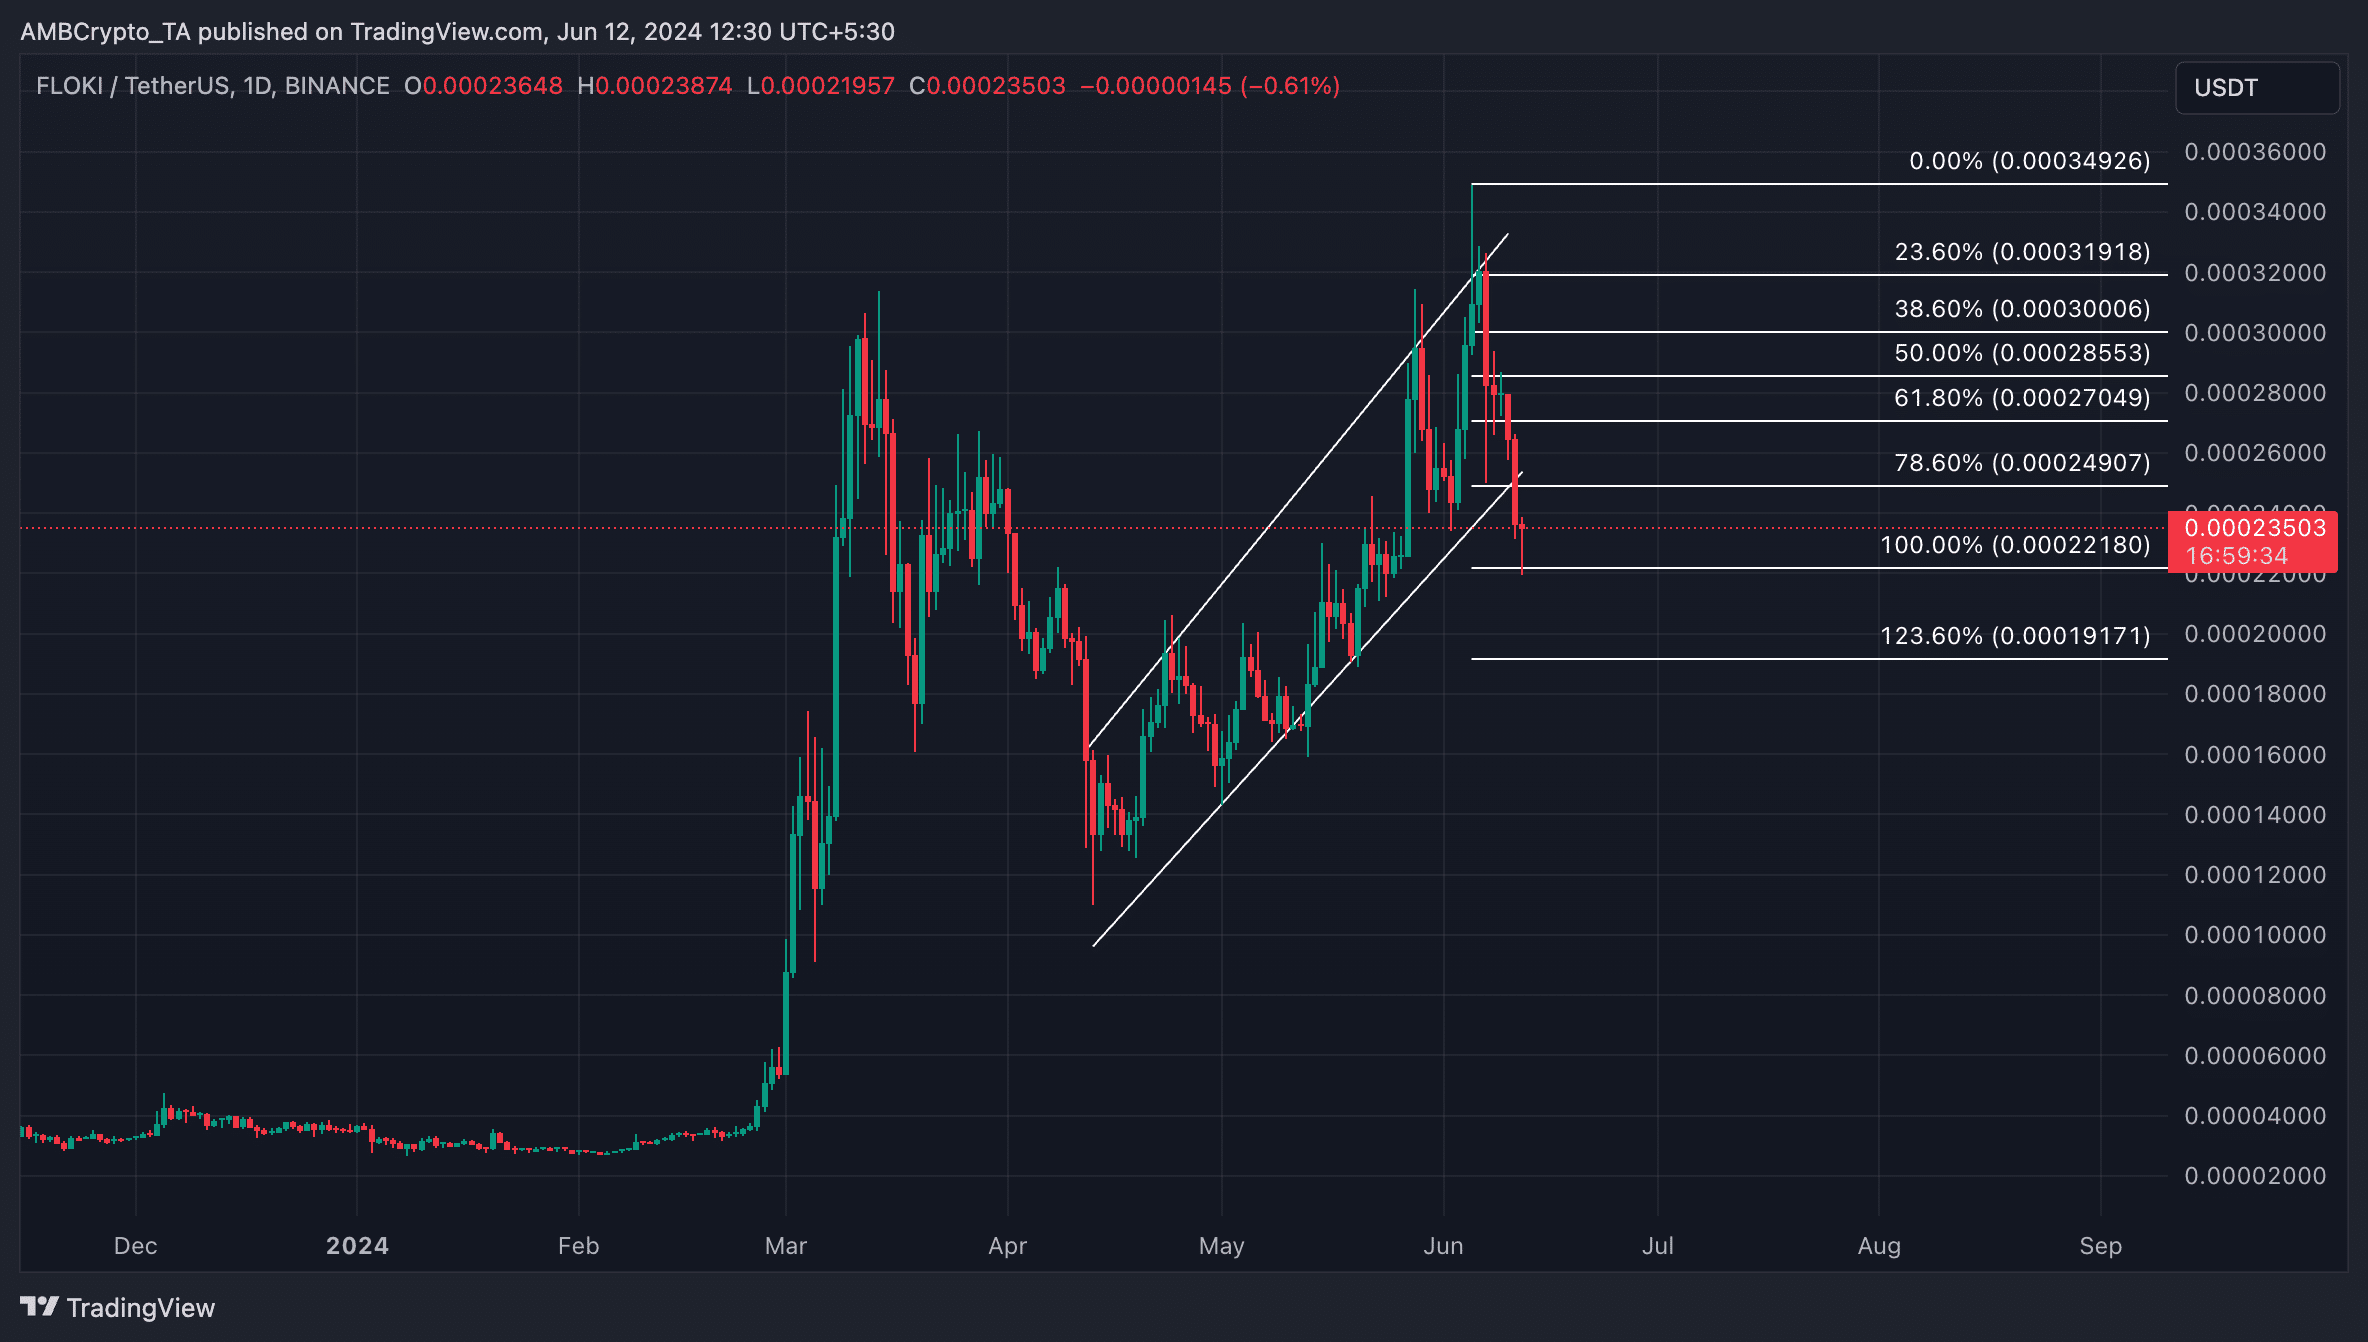
Source: TradingView
However, if this is invalidated and new demand for the meme coin surges, FLOKI’s price might rally toward support at $0.00025 and above.