For Monero bulls this zone remains a critical resistance level to overcome

Disclaimer: The information presented does not constitute financial, investment, trading, or other types of advice and is solely the opinion of the writer.
Bitcoin has formed a range between $22.8k and $18.8k over the past month, with $21.8k also serving as a crucial resistance level. Monero has been able to grind its way higher over the past month, but the longer-term trend still favored the bears. In such a fearful market, a move above the $135 resistance level could be unlikely for Monero bulls to pull off.
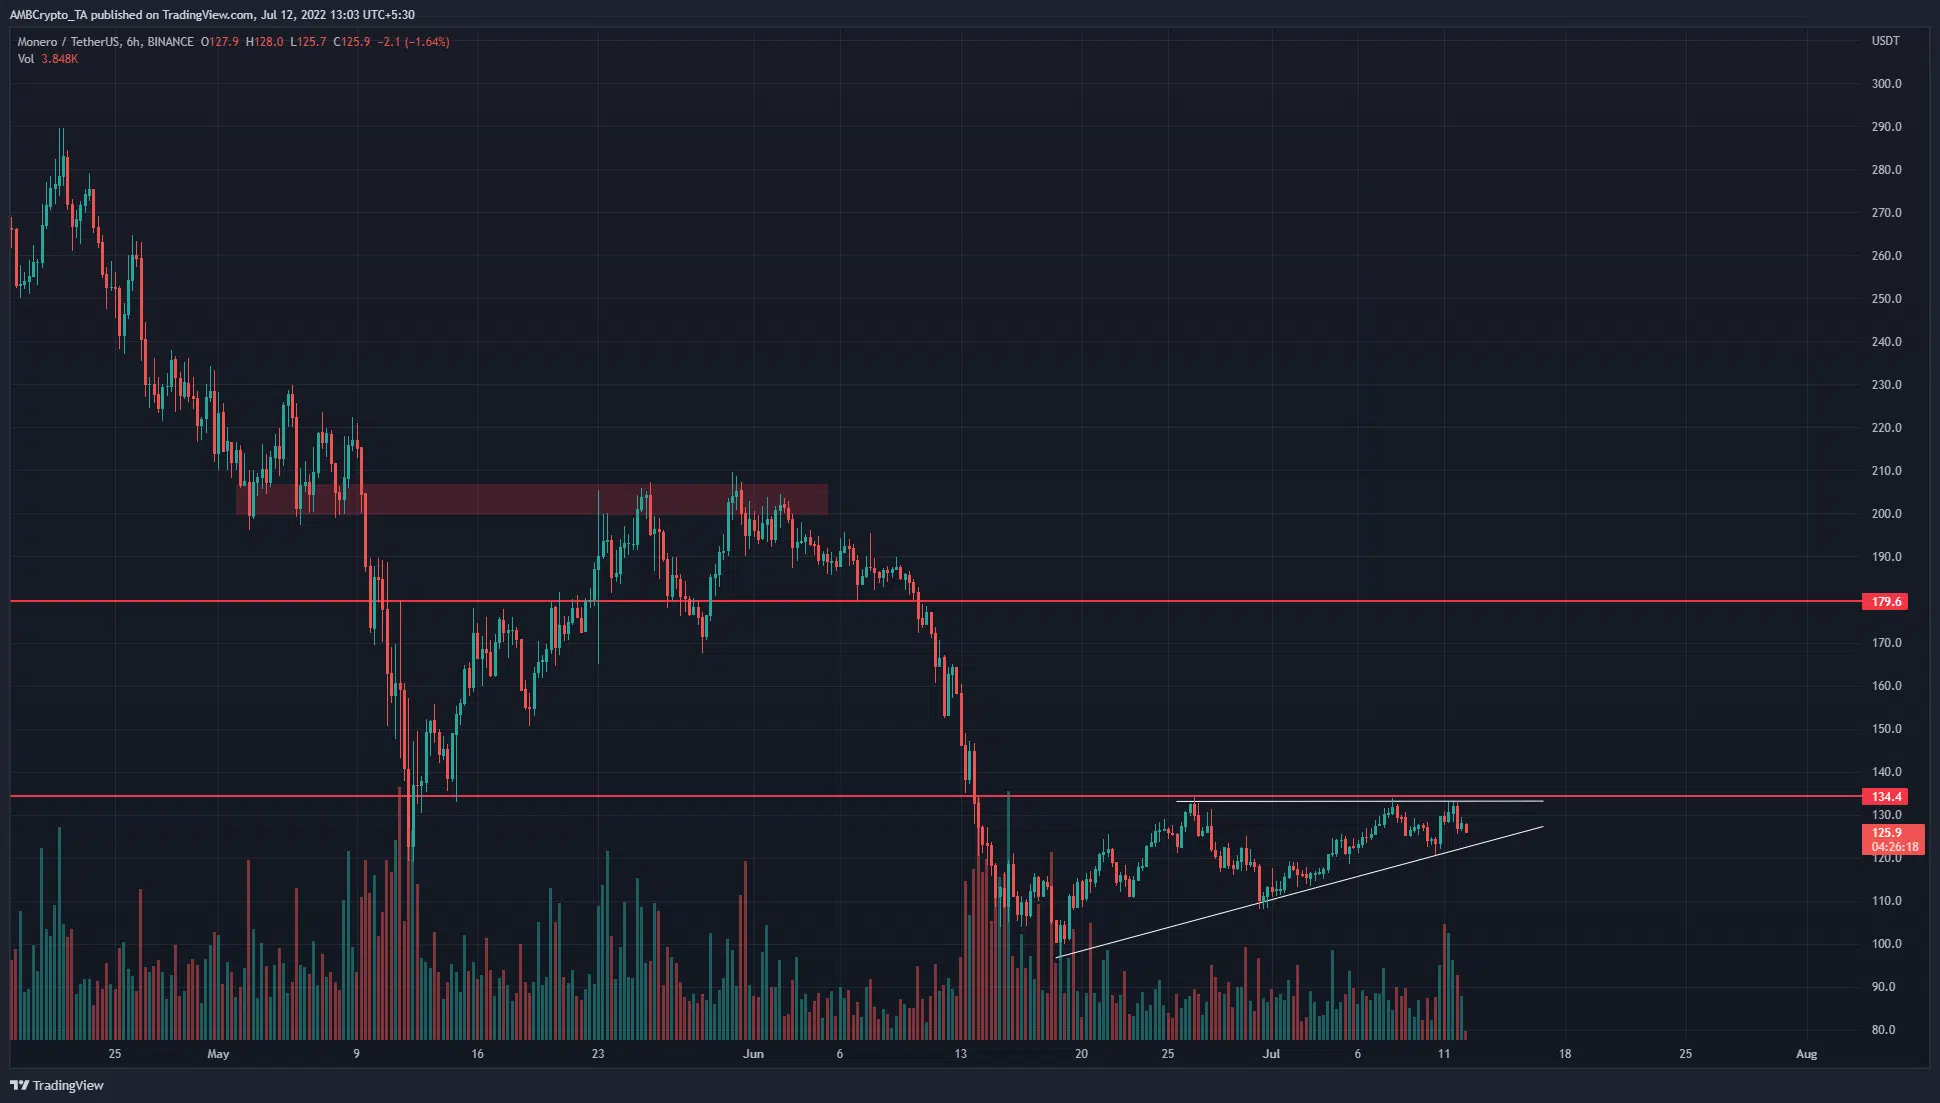
XMR- 6-Hour Chart
On the 6-hour chart, it can be seen that Monero has formed a series of lower highs since April. This downtrend has been pierced by periods of strong upward rallies, such as the mid-May rally from $130 to $200.
Despite the strong rallies, the higher timeframe market structure remained bearish. Key lower high levels on the long-term downtrend were not tested. Instead, former support zones were retested as resistance before the price headed lower once again.
This was what was happening once again. The $120-$130 zone acted as demand in May, but in June and July, the same zone has been retested as resistance multiple times. In fact, Monero formed an uptrend over the past month as it formed a series of higher lows.
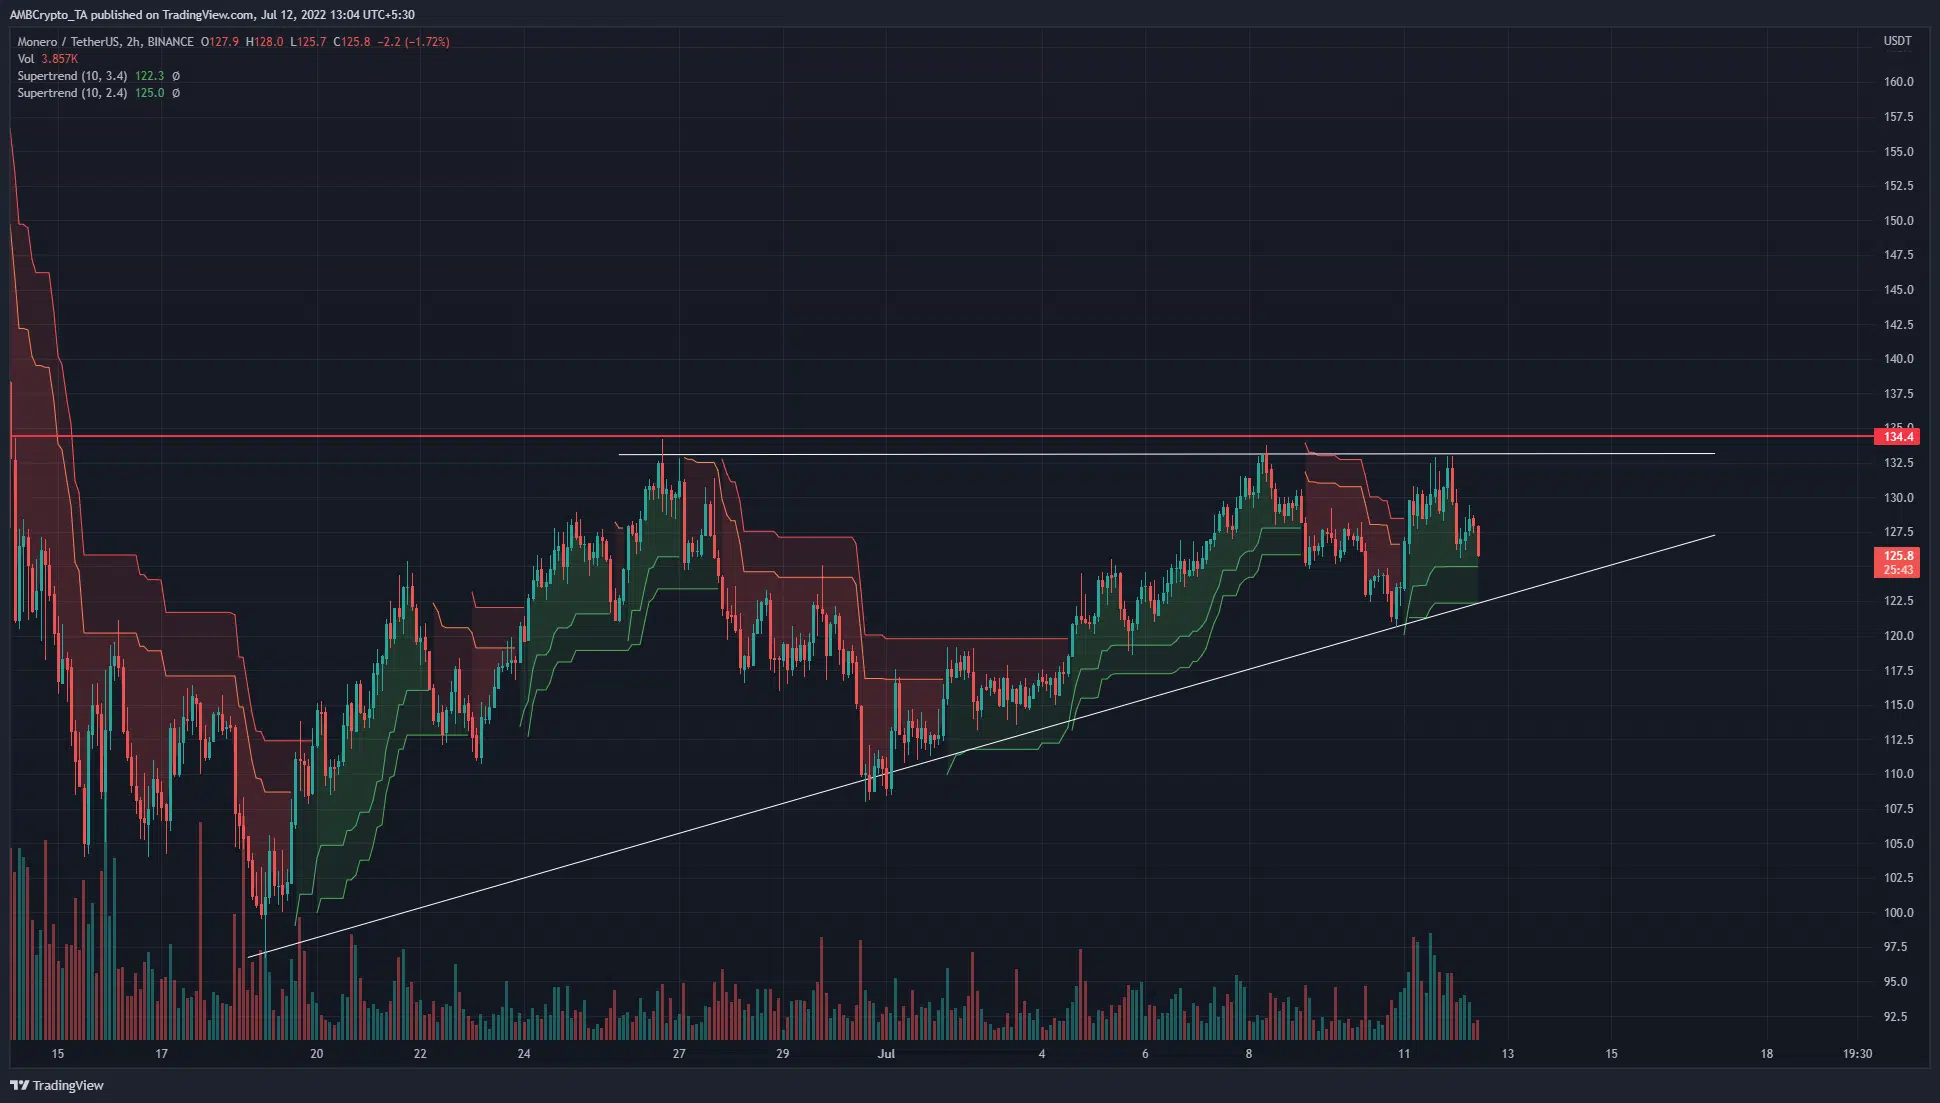
XMR- 2-Hour Chart
The 2-hour chart showed a rising triangle pattern (white). While this pattern generally indicates an uptrend after a breakout northward, the pattern has formed after a lengthy downtrend. At the same time, it has already been elaborated that the $130 zone was stiff resistance.
Therefore, a breakout and retest of $130-$135 can be a buying opportunity. Until then, buyers would need to remain cautious.
The two Supertrend indicators showed a buy signal for Monero. If the price breached the lower trendline and flipped it to resistance, the triangle pattern would be invalidated.
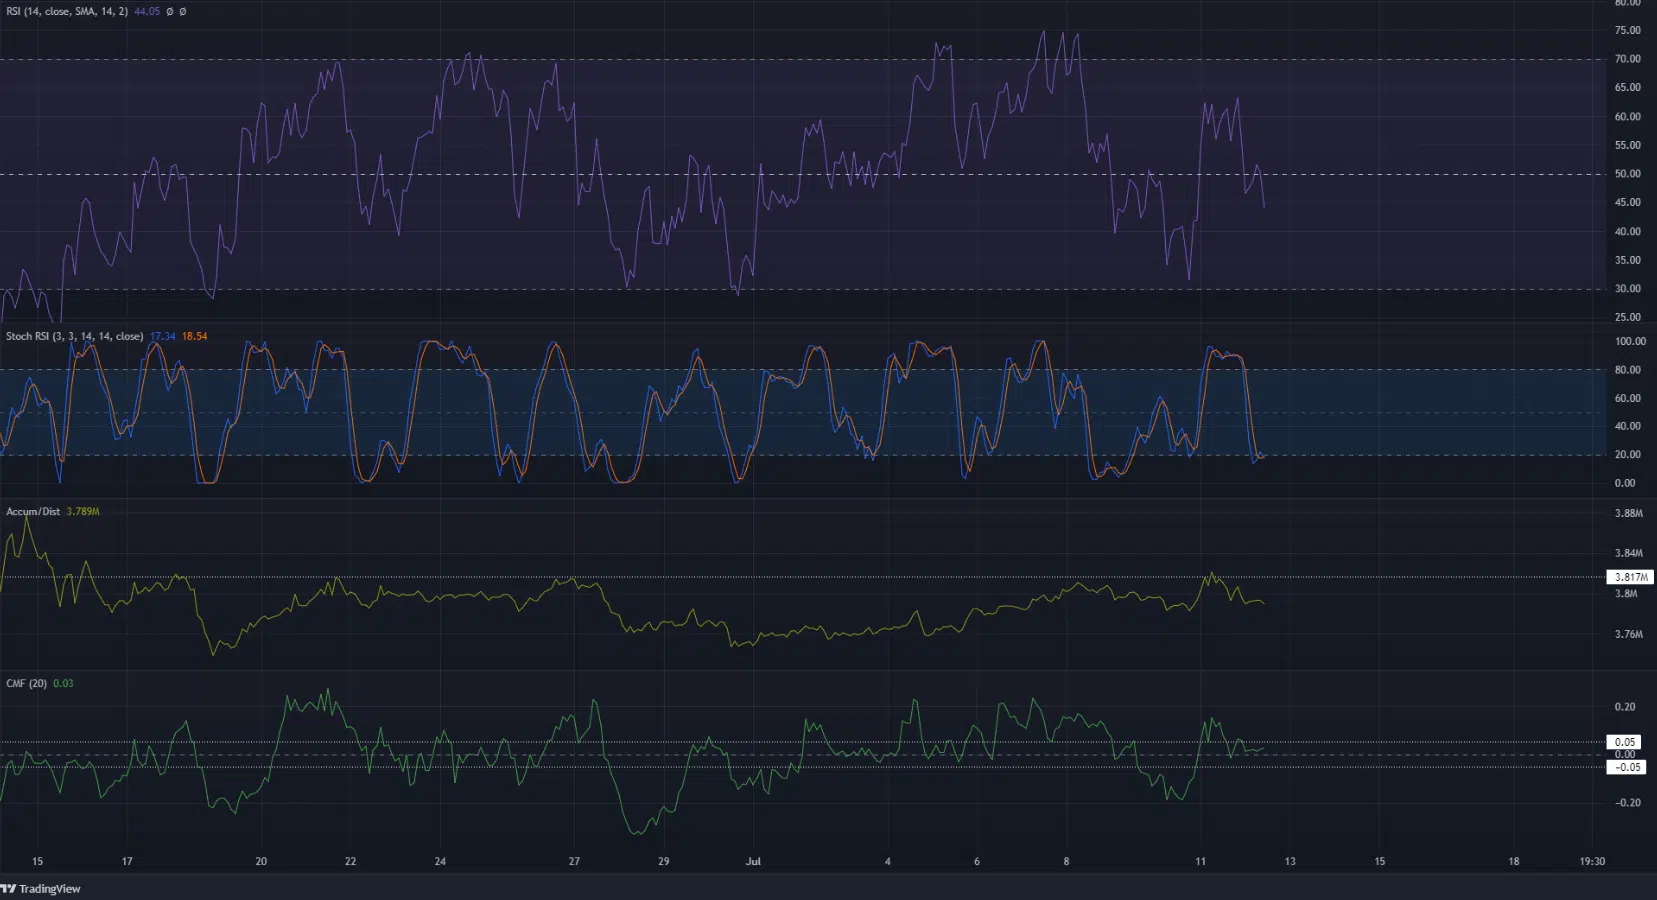
The RSI slipped below neutral 50 and retested it as resistance on the 2-hour chart. This highlighted bearish pressure to be rising behind Monero. However, the presence of the bullish Supertrends and the Stochastic RSI bullish crossover suggested a move upward could yet be possible.
The A/D line also struggled to breach a resistance level from last month, a bit similar to Monero on the charts. A trend reversal needs strong buying pressure, but the A/D did not yet show that. The CMF has also highlighted selling pressure in the past few days of trading.
Conclusion
The rallies to the $130 level on lower timeframes have been supported by good buying pressure. Yet, at the $130 mark, sellers step into the fray with conviction. Therefore, the $130-$135 zone remained a critical resistance level for Monero bulls to overcome.
A breakout from the triangle pattern and a subsequent retest can be used to enter a long position. The invalidation of the breakout idea is the $125 area. Similarly, a breakdown and retest of the lower line can be monitored to enter a short position, with a stop-loss above $135.


