Forget $600, will BNB fall below $550 instead?

- BNB has witnessed a 9% pullback over the past four days.
- Metrics indicated mixed signals towards the token.
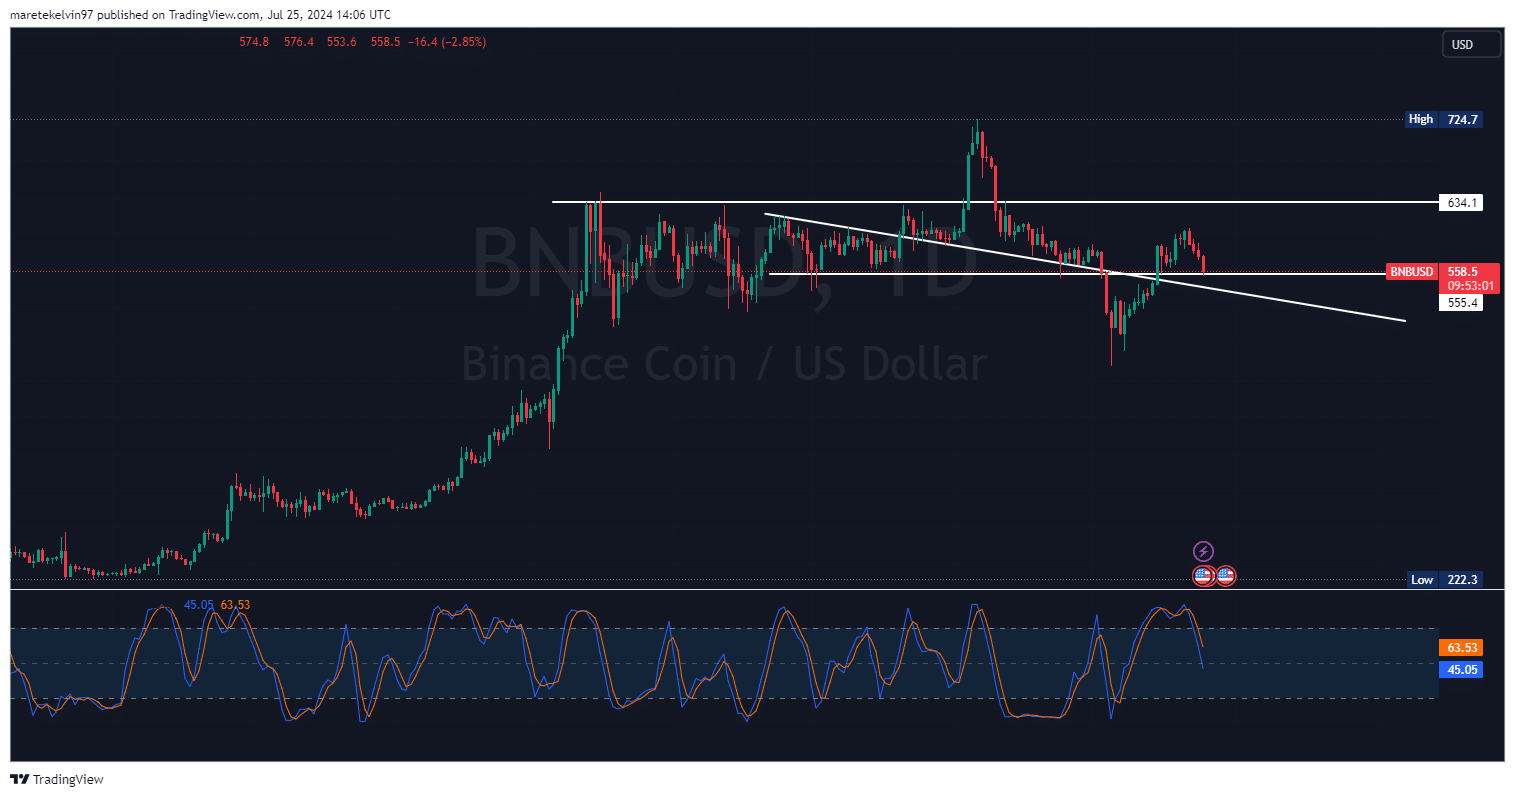
Binance Coin [BNB] has witnessed a significant downturn recently, as the altcoin dropped by 9% in the last four days.
As of this writing, BNB was testing a crucial support level of around $555. This level was a resistance that has turned to a support level recently, making it a key area to watch.
BNB’s ability to hold above or break below this level could determine its short-term market direction.
The stochastic RSI was in a neutral zone but approaching an oversold zone.
Indecision on BNB liquidation levels
AMBCrypto’s assessment of liquidation map data indicated a cluster of liquidation levels in the $550–$560 zone, which corresponded to the press time support level.
This accumulation of liquidity usually leads to an increase in price volatility. With increased volatility in BNB prices, a significant price move will follow.
Development activity remains strong
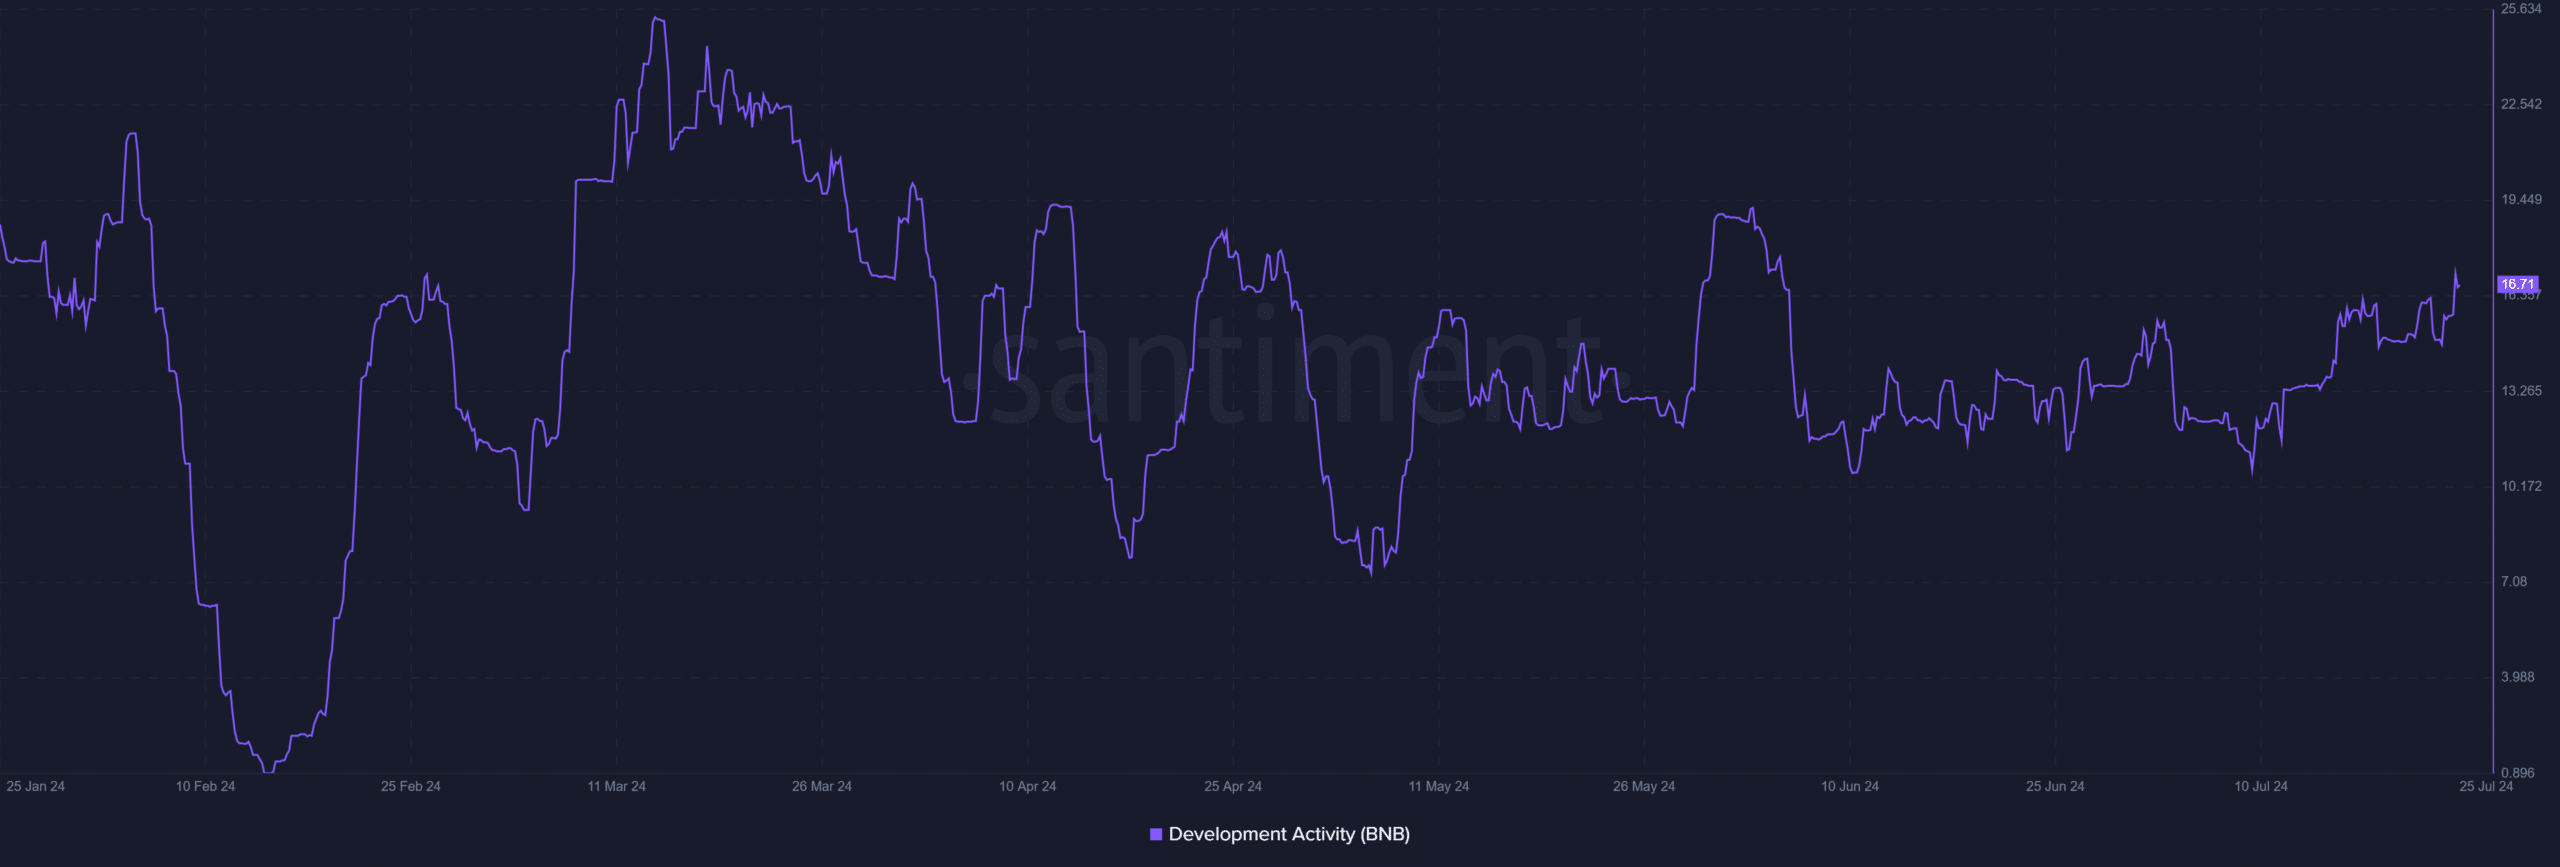
However, there has been a surge in the development activity of BNB, despite its declining prices. AMBCrypto’s analysis of Santiment data showed that development activity had remained fairly constant over time.
This could be a sign of strength for the coin’s fundamentals in the long run.
Per Coinglass’ Long/Short Ratio Chart, BNB had been experiencing a series of fluctuations of late. The bulls were seemingly taking control, as indicated by the recent spikes.
This indecision in the market indicated that investors were waiting for the market to take a specific direction despite the building bullish bias.
Read Binance’s [BNB] Price Prediction 2024-25
Is a reversal imminent?
The convergence of the key support level and clustered liquidation levels creates a volatile market outlook. A rejection of the current support could trigger a short squeeze, which could consequently lead to rapid upward movement.
However, a decisive break below the support level could fuel the bearish momentum.


