
- BTC was down by more than 5% in the last seven days.
- BTC’s price might plummet to 61k before turning bullish.
After a sharp decline, Bitcoin [BTC] dominance started to increase in the last few days. The recent rise in Bitcoin dominance was not a result of a BTC bull rally but rather a consequence of altcoins turning bearish.
Therefore, AMBCrypto checked BTC’s state to see how the rising dominance could impact the coin’s price.
Bitcoin’s rising dominance amidst a price drop
CoinMarketCap’s data revealed that BTC’s price dropped by more than 5% in the last seven days. This pushed the coin’s price below $63k.
In fact, in the last 24 hours alone, BTC was down by 2%. At press time, it was trading at $62,369.67, with a market capitalization of over $1.22 trillion.
The downturn was not only limited to BTC, as several altcoins, including Ethereum [ETH], also witnessed price corrections.
The overall decline in the altcoin market cap allowed BTC’s dominance to rise again after a steep decline on the 28th of April. At press time, Bitcoin dominance was 50.9%.

Source: CoinStats
Will rising dominance help BTC turn bullish?
Since BTC dominance was rising, AMBCrypto planned to check its metrics to find out how this affected investor sentiment. We found that selling pressure on BTC dropped in the last few hours as its exchange reserve declined.
Additionally, its net deposit on exchanges was also low compared to the last seven-day average. A look at CryptoQuant’s data revealed that miners were also selling at a slower pace, indicating their will to hold BTC.

Source: CryptoQuant
The increase in buying pressure and investors’ willingness to hold BTC might trigger a trend reversal, allowing BTC to paint its charts green. To better understand whether that’s possible, we then analyzed BTC’s daily chart.
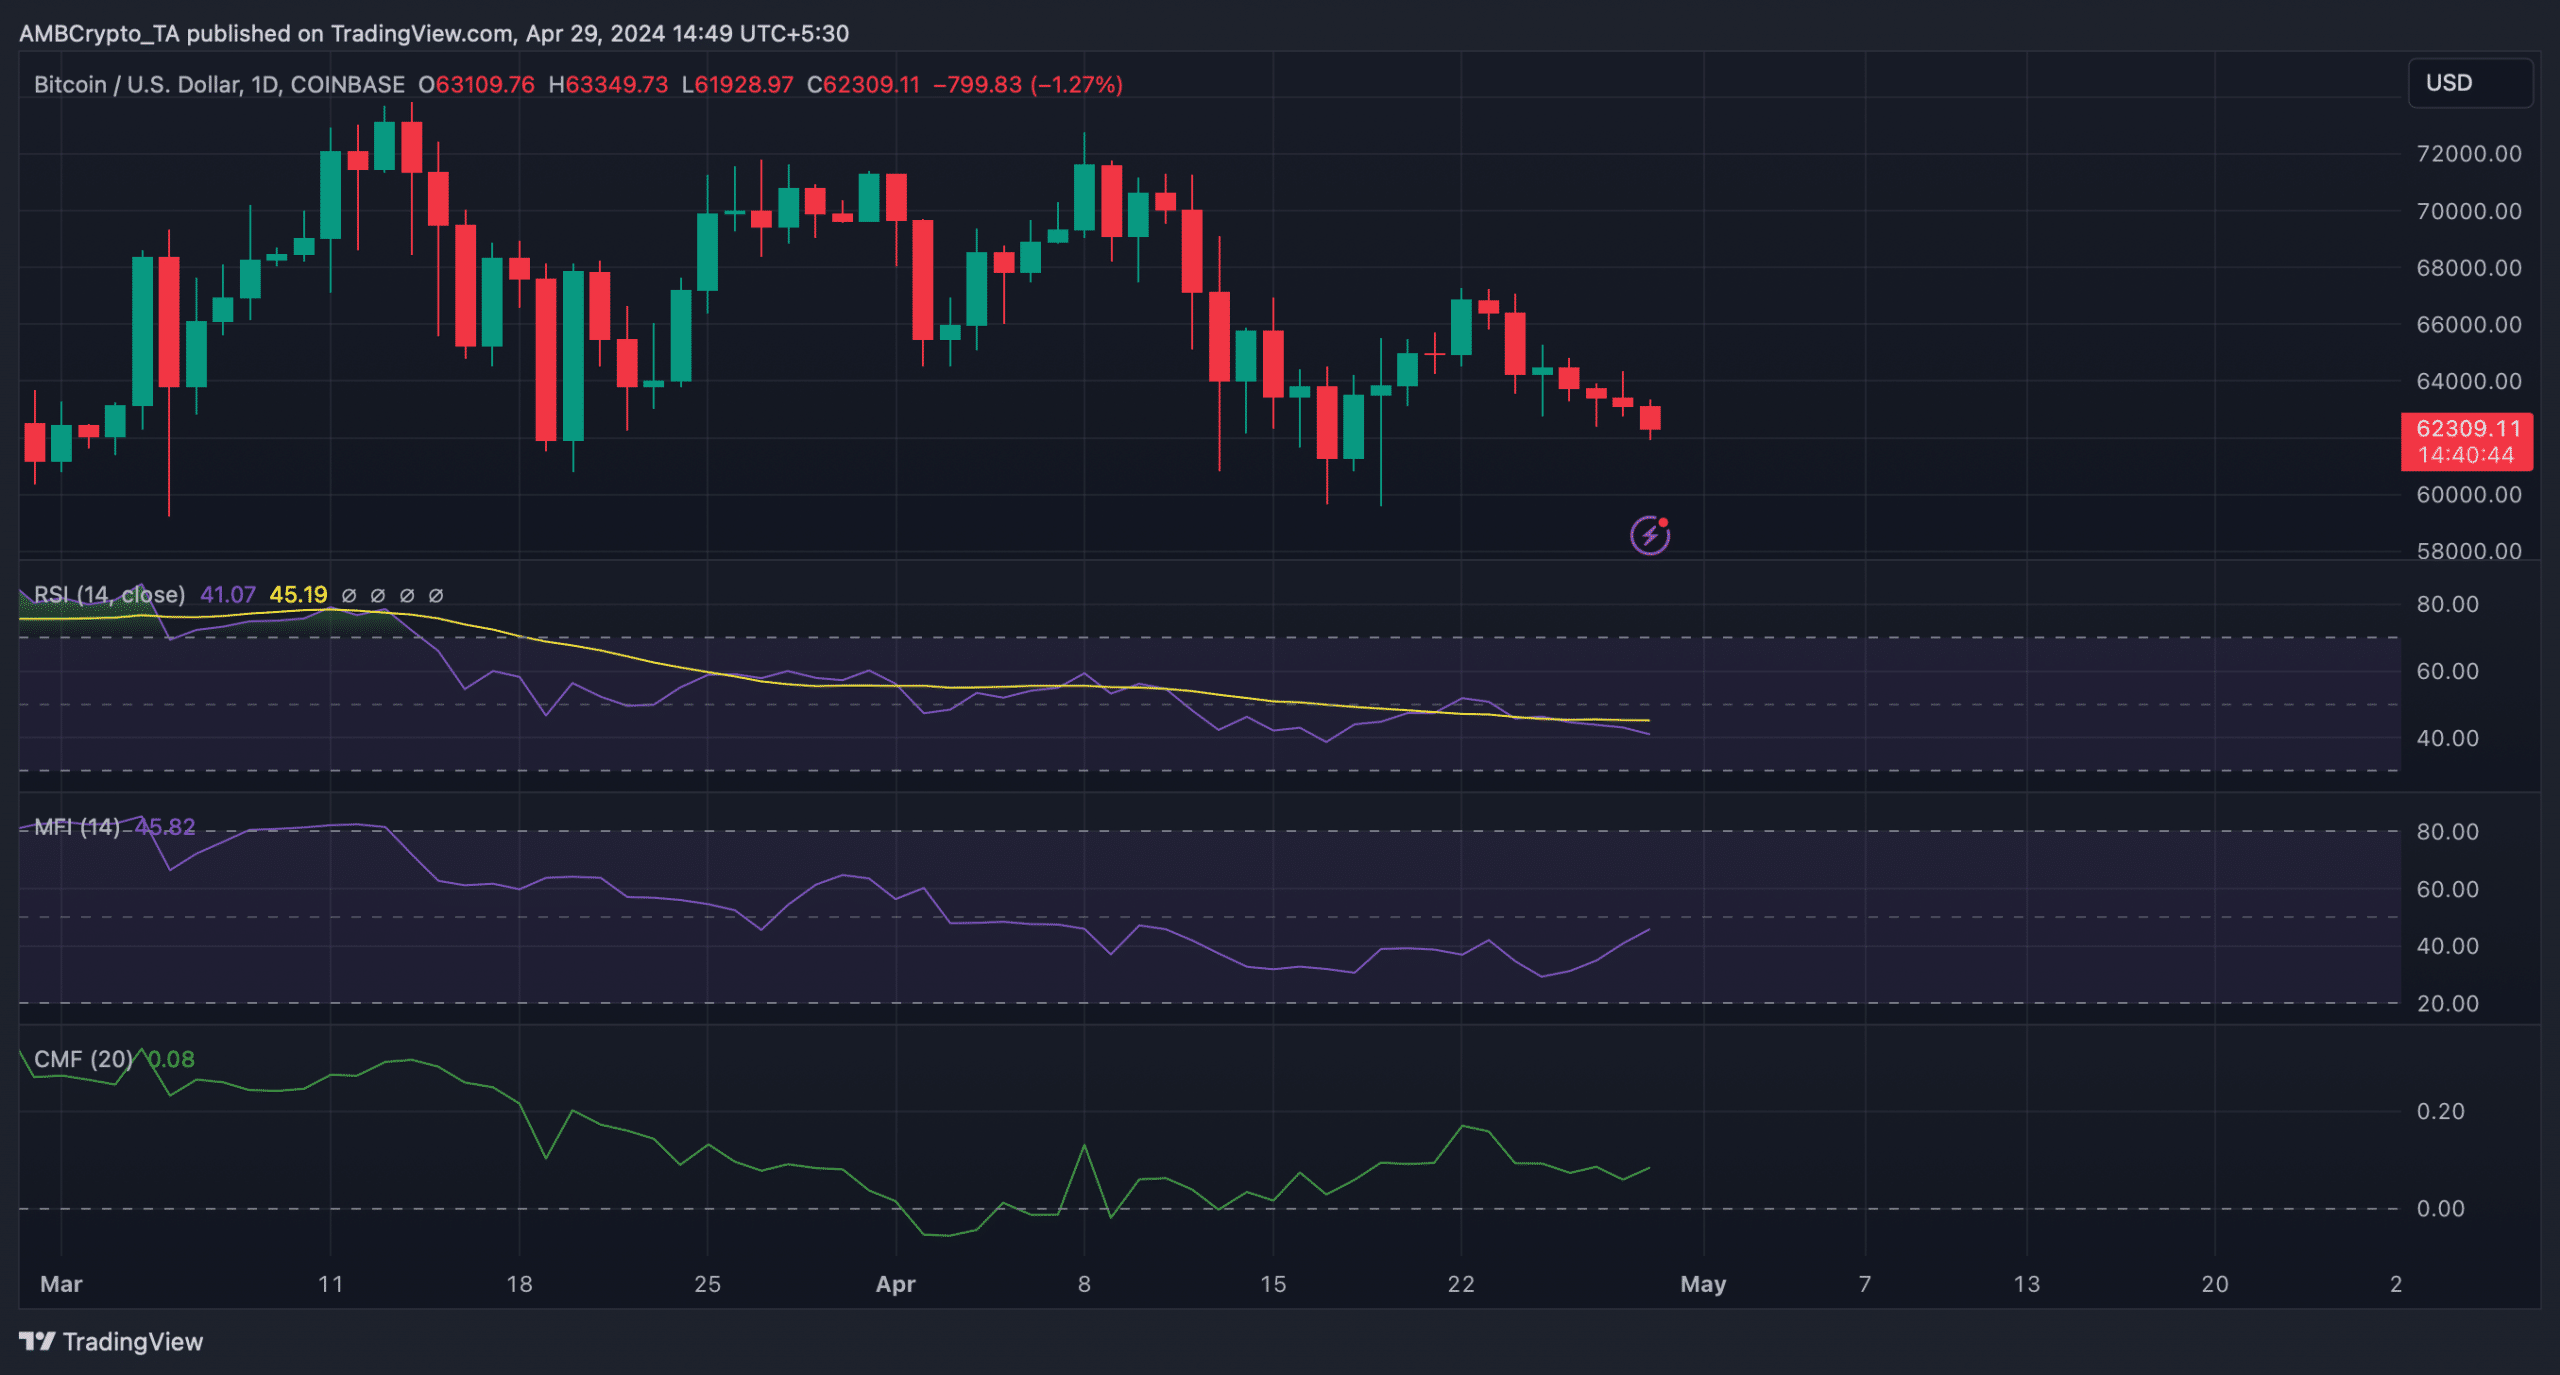
As per our analysis, BTC’s Chaikin Money Flow (CMF) registered an uptick and at press time had a value of 0.08.
A similar increasing trend was also noted on Bitcoin’s Money Flow Index (MFI) chart. Both of these technical indicators hinted at a price increase in the coming days.
However, the Relative Strength Index (RSI) remained bearish as it registered a downtick.
Source: TradingView
Read Bitcoin’s [BTC] Price Prediction 2024-2025
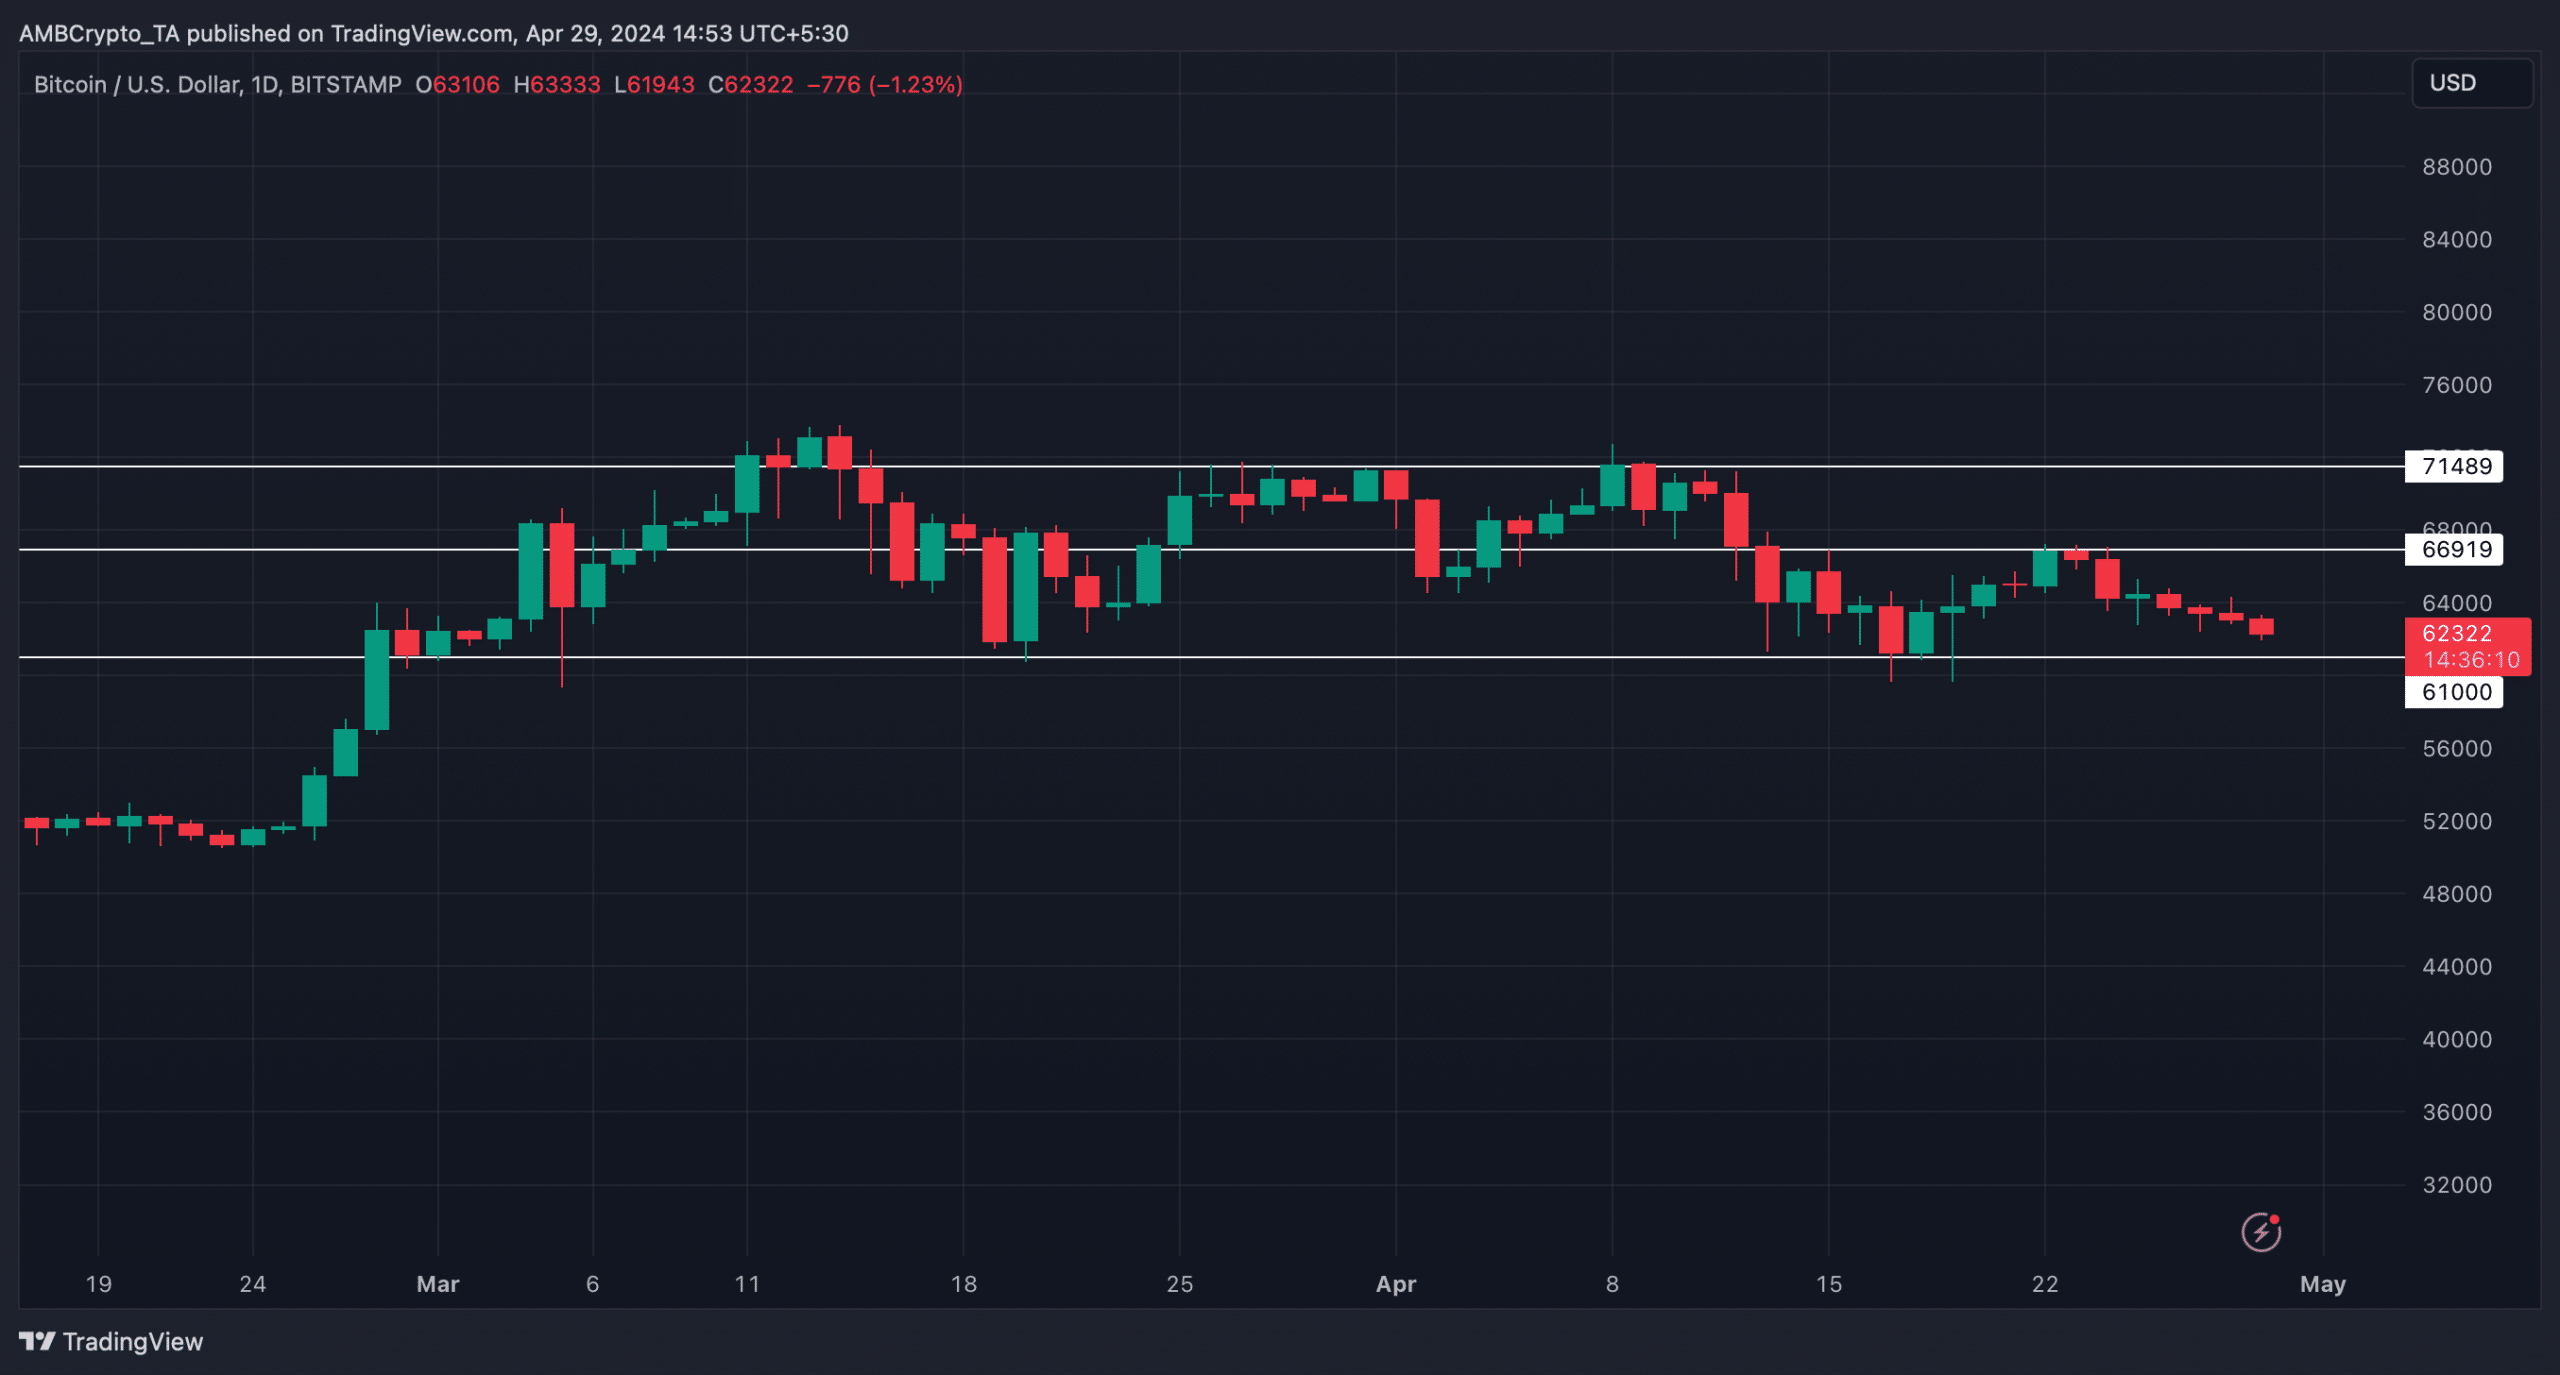
Going forward, we analyzed BTC’s chart to predict the next possible targets BTC might hit if a bull rally happens. BTC’s price in the near term might first plummet to $61k support.
A successful test of that support could initiate a bull rally, allowing it to first reclaim $66k. A further price increase could result in BTC touching $71k before it reaches a new all-time high in the months to follow.
Source: TradingView


