
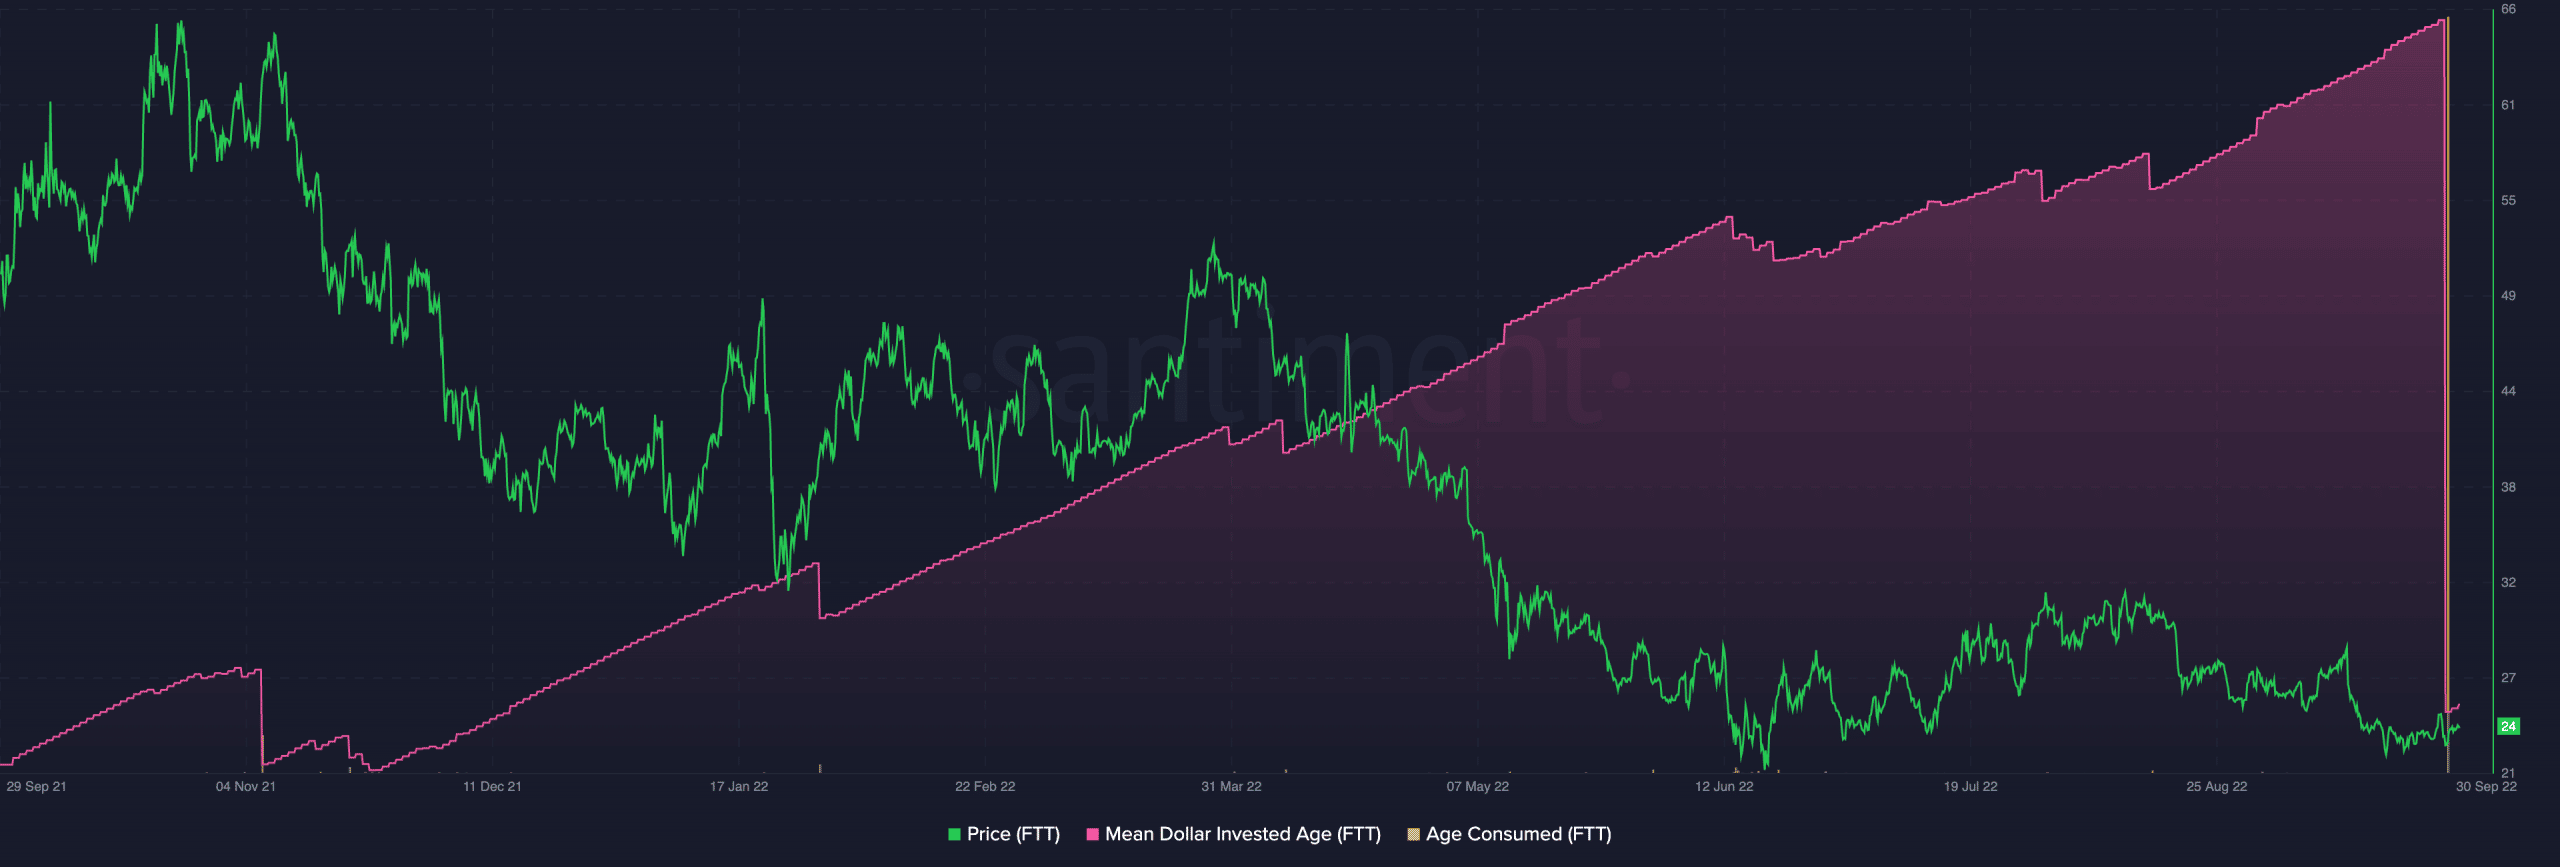
During the intraday trading session on 28 September, some previously dormant FTT tokens saw a sudden surge in activity. According to data from Santiment, between 11 am – 12 pm UTC on 28 September, FTT saw its largest amount of dormant token movement of all time. The asset’s age consumed hit a high of 200.08 billion on the same day.
In addition, its Mean Dollar Invested Age (MDIA) fell sharply by 64% between 27 and 28 September. However, it was common that a continued stretch in an asset’s MDIA could be an indication of stagnancy on the network.
Furthermore, the fall of MDIA indicates that long-held tokens lying in dormant addresses are beginning to change hands and such movement usually precipitates a rally in the price of an asset.
For context, data from Santiment revealed that FTT’s MDIA has been on an uptrend since November 2021.
Source: Santiment
FTT on the chain
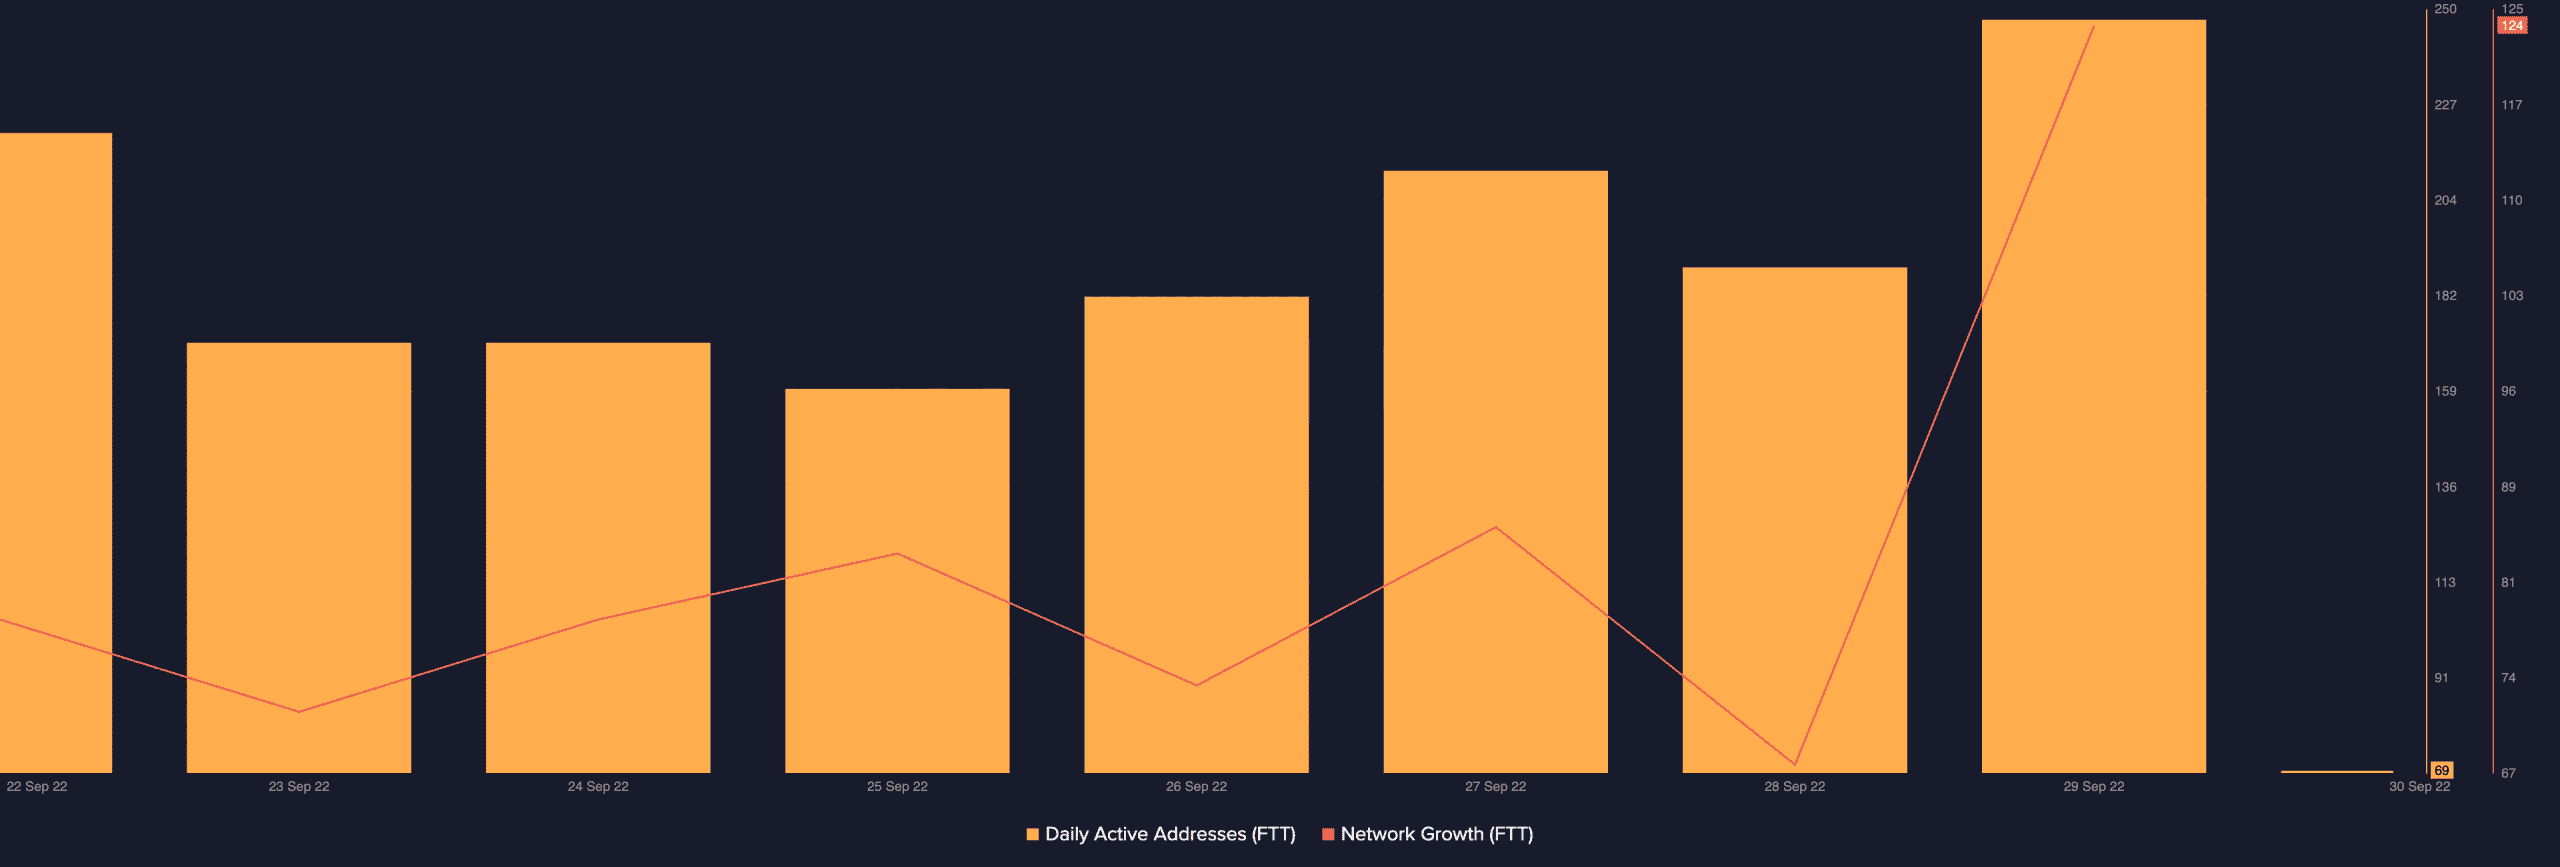
Following the sudden movement of the dormant FTT tokens on 28 September, data from Santiment showed positive activity of some on-chain metrics.
For one, the count for daily active addresses that traded FTT tokens rallied by 24% to a high of 248 addresses by 29 September. This, however, had slowed down, by press time as daily active addresses on the network stood at 69 as of this writing.
Furthermore, following the movement of previously dormant FTT tokens, new addresses flocked to the network. By 29 September, the index for new addresses on the FTT network had grown by 82%.
Source: Santiment
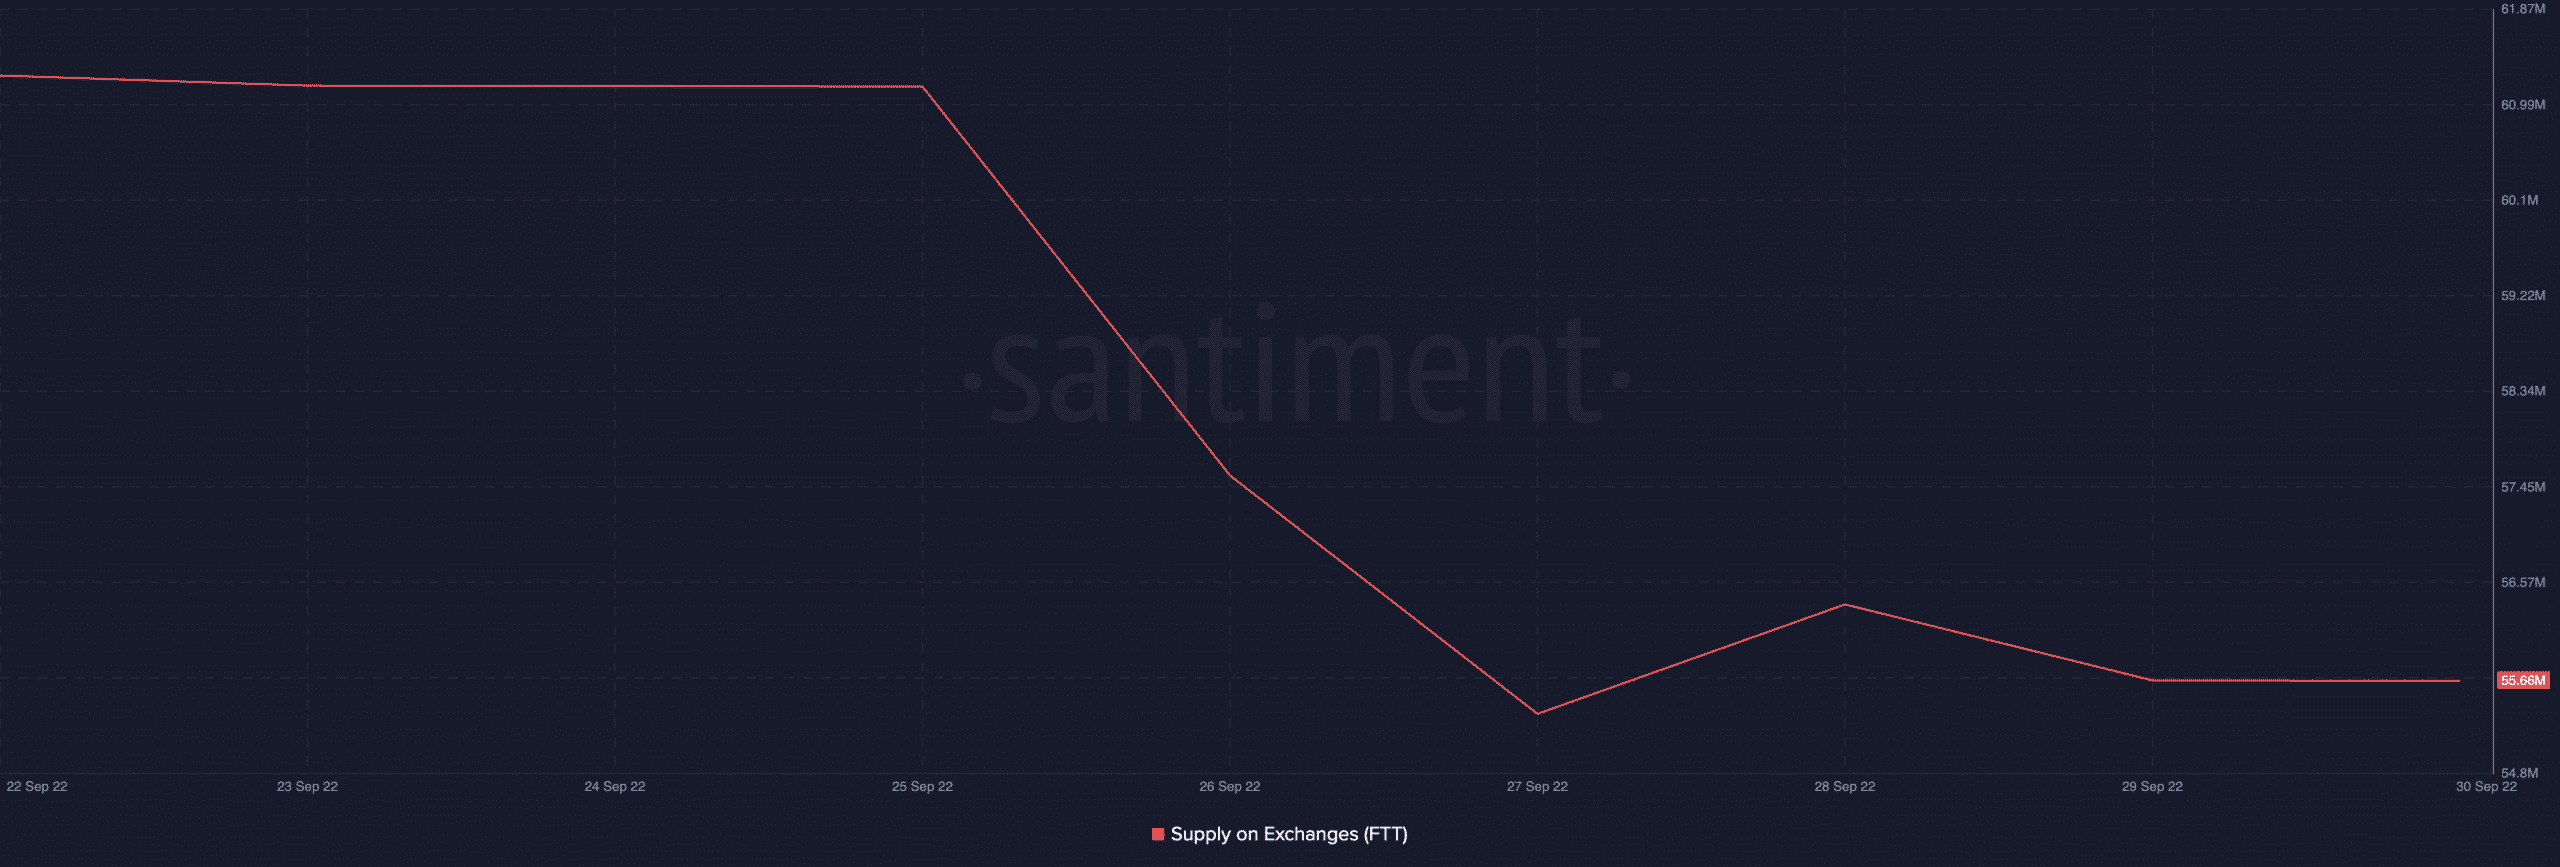
FTT’s supply on exchanges had been on a decline since 25 September. A drop in this metric suggested a drop in the selling pressure for an asset.
Following the dormant coin activity on 28 September, FTT’s supply on exchanges fell further by 2% within the 24 hours that followed, indicating a rally in FTT’s buying pressure.
Source: Santiment
FTT price – a different tale
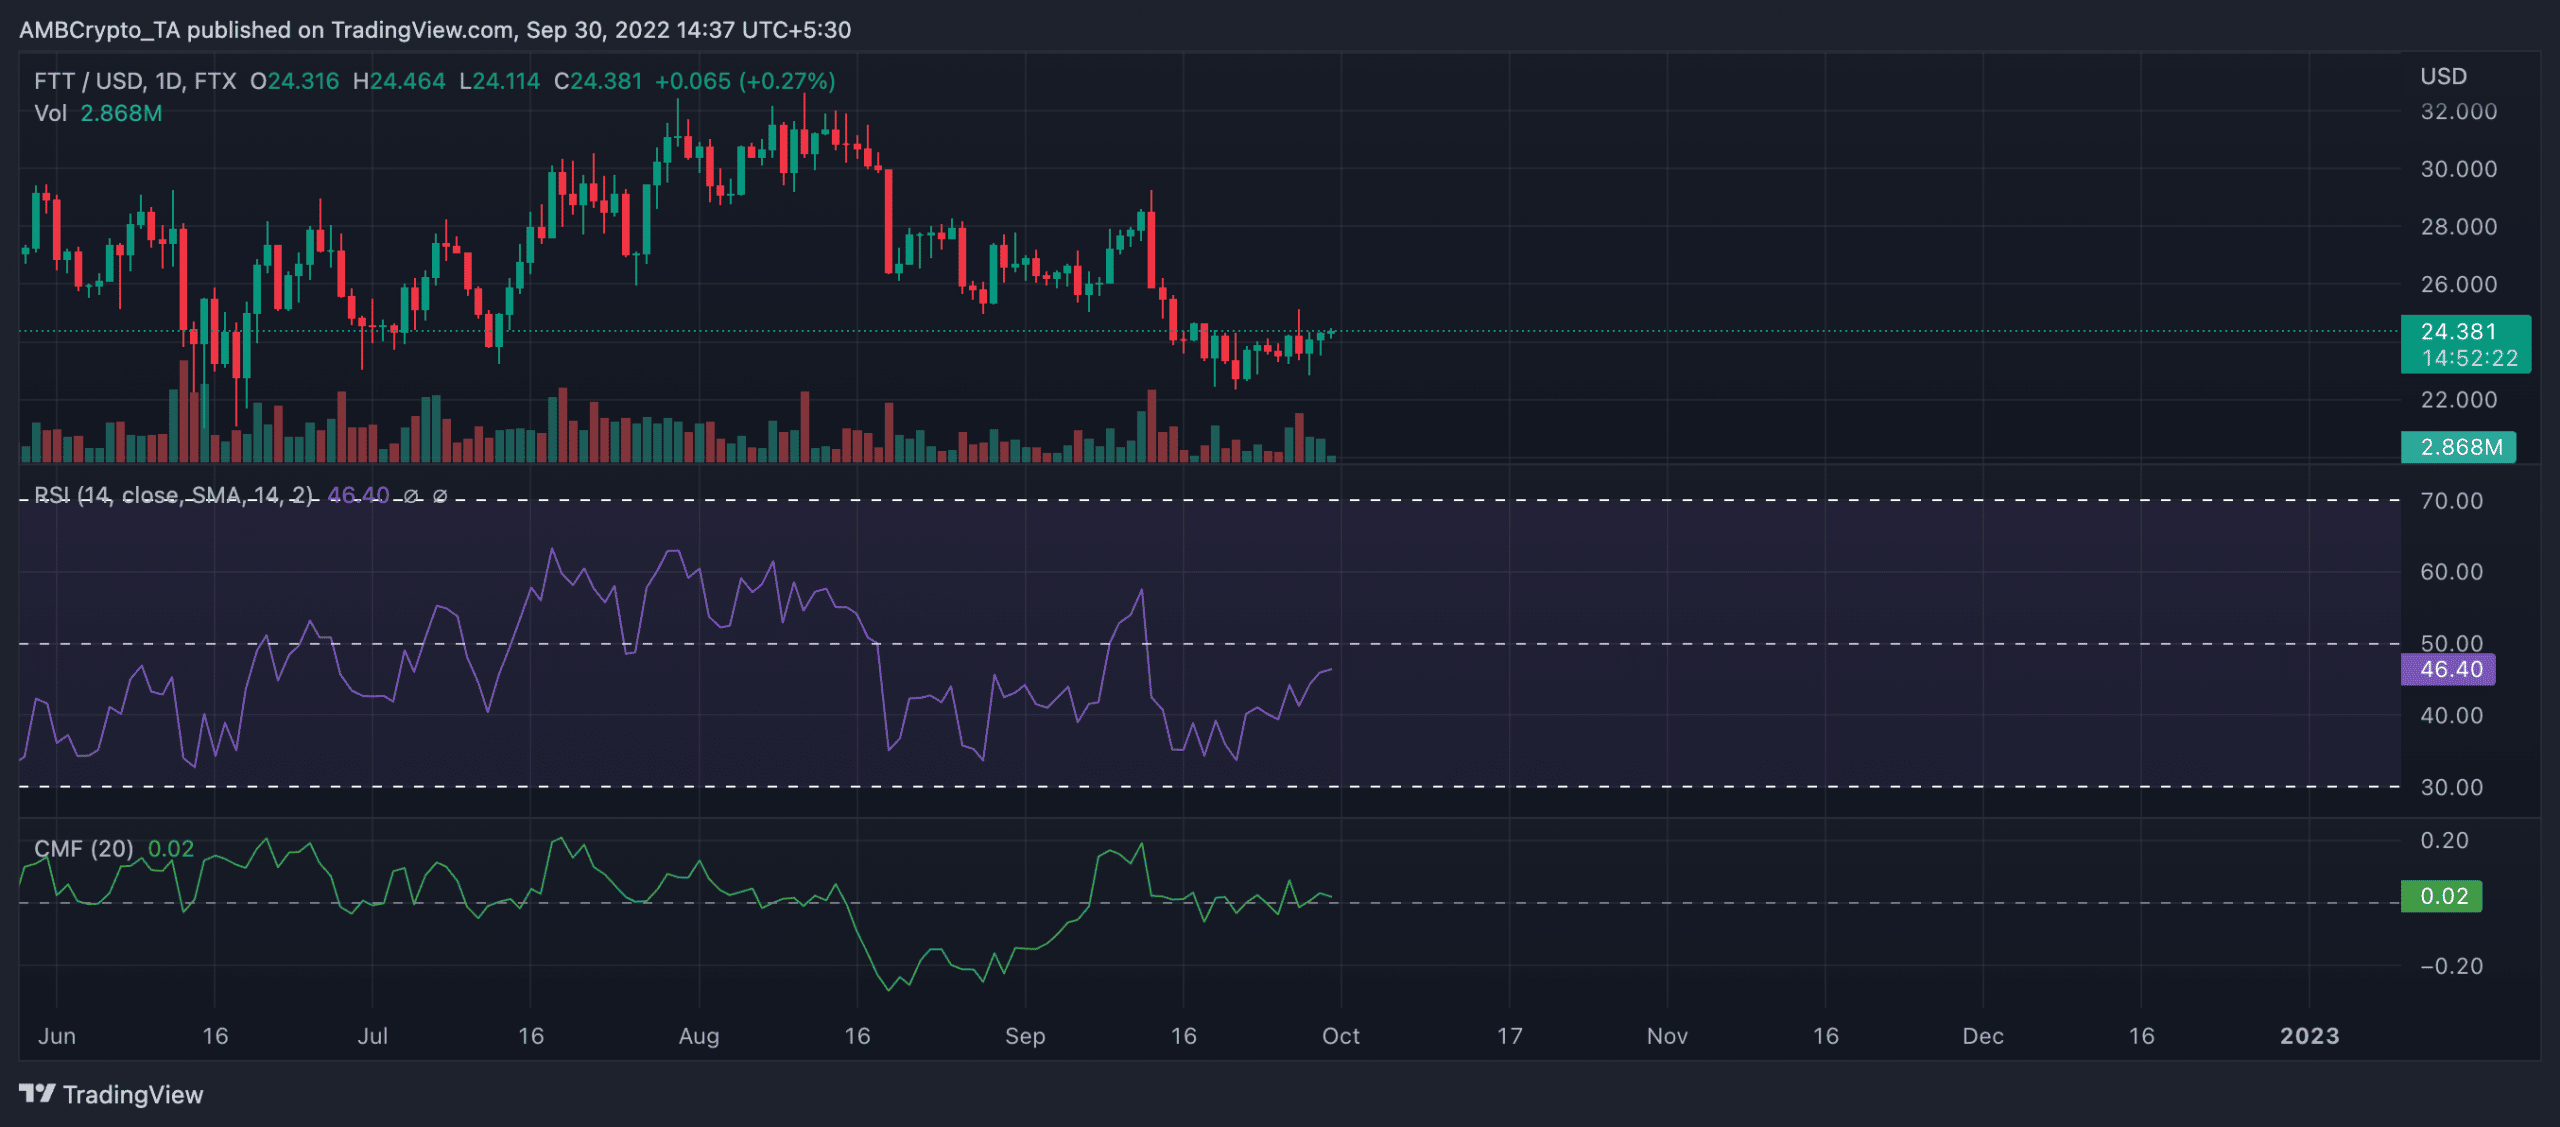
Exchanging hands at $24.33 at press time, the significant decline in FTT’s MDIA, the drop in its supply on exchanges, and the rally in network activity failed to translate into a significant price action for the cryptocurrency. Its price went up by just 3% since 28 September. In the past 24 hours, its price had gone up by just 2%, data from CoinMarketCap revealed.
While key on-chain metrics suggested growth in FTT’s buying pressure in the past few days, movement on a daily chart revealed that this growth was slowed. Additionally, this could be gleaned from the price performance since 28 September.
At press time, FTT’s Relative Strength Index (RSI) was 46.40. On 28 September, it commenced its movement towards the 50-neutral region. However, FTT’s buying momentum wasn’t enough to make the crossover a reality.
In a downtrend, the Chaikin Money Flow (CMF) was spotted at 0.02, suggestive of a slowed rally buying pressure.
Source: TradingView