FTX investors should watch out for FTT touching $23-$25 range over the weekend

Disclaimer: The information presented does not constitute financial, investment, trading, or other types of advice and is solely the writer’s opinion.
The FTX exchange token FTT has been in a downtrend since March. In May, the price formed a descending channel, and a breakout upward has not been seen yet. It is the fourth largest token by market capitalization, and the past week of trading took out a good chunk of said marketcap. The market structure was bearish, although a relatively low-risk buying opportunity could soon present itself.
FTT- 12-Hour Chart
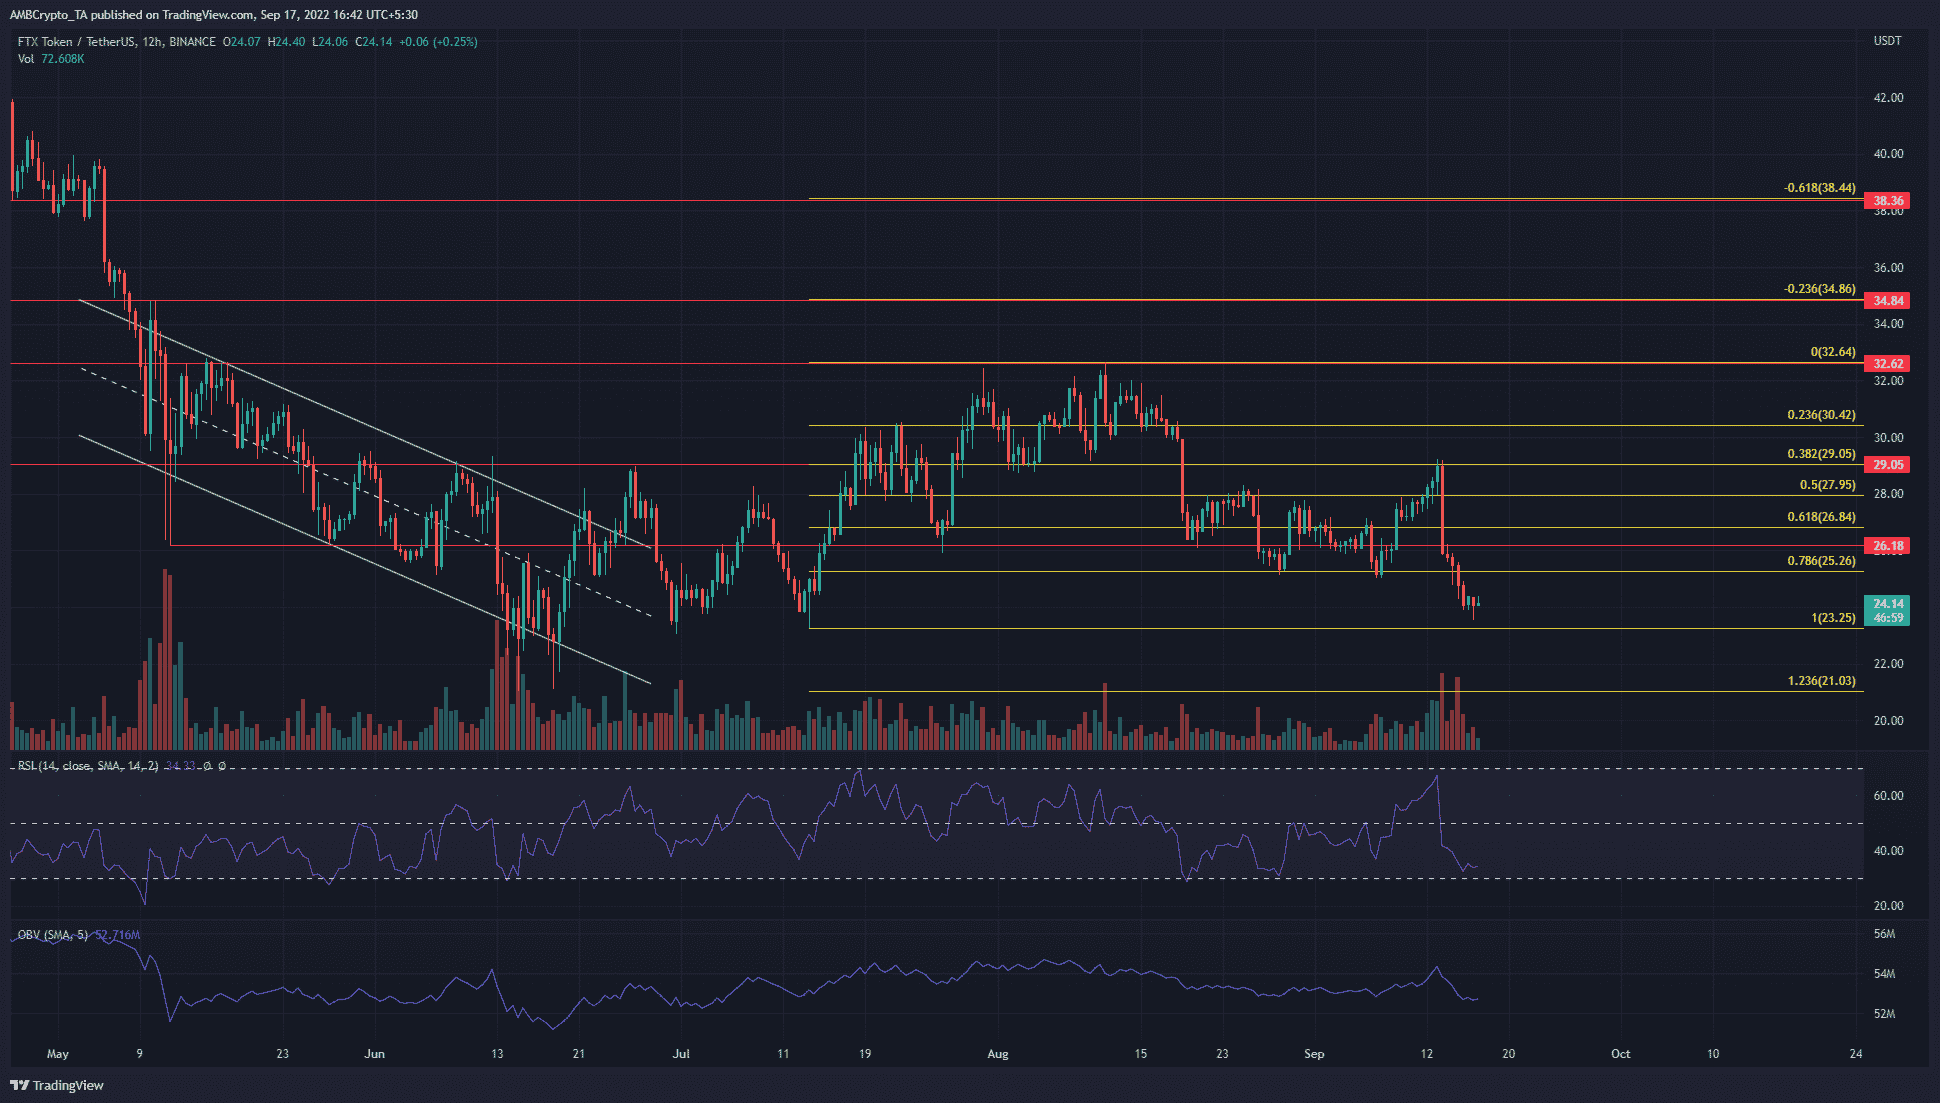
The descending channel (white) saw what appeared to be a bullish breakout in the third week of June. But the $29 resistance level stood firm. In the months since then, the $29 and $32 levels of resistance have posed stiff resistance to the price movement.
A set of Fibonacci retracement levels (yellow) were plotted based on FTT’s move from $23.25 to $32.64. In mid-August, the 23.6% retracement level was broken as support. The plunge that followed saw both the 38.2% and 50% retracement levels have both acted as resistance.
In July, the $23.6-$24.5 region had acted as a support zone. At the time of writing, the price was at the same belt of support once again. The Relative Strength Index (RSI) showed a value of 34, to highlight strong bearish momentum. The On-Balance Volume (OBV) was also in a slight downtrend from the beginning of August, which showed the sellers possessed a slight advantage.
FTT- 2-Hour Chart
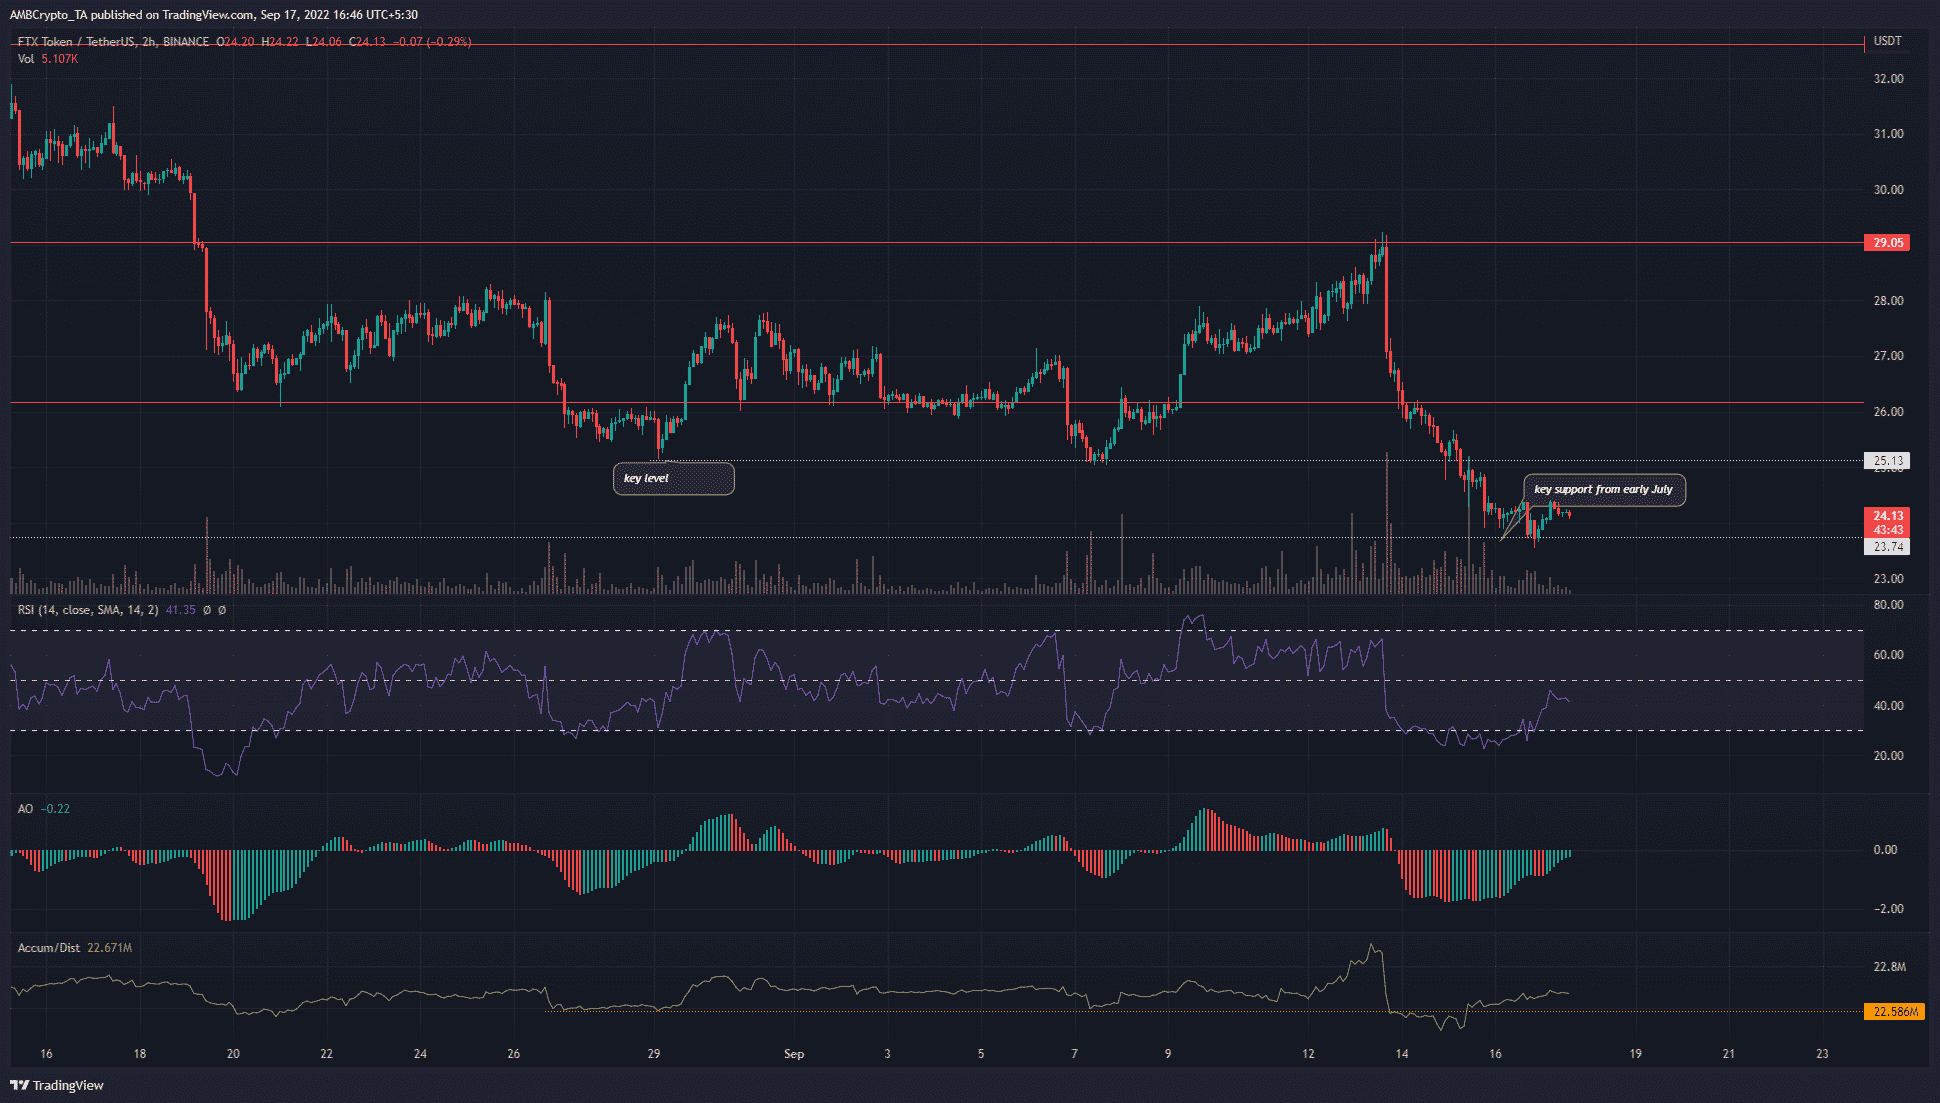
On the two-hour chart, two key levels of support were highlighted in white. The one at $25.13 has served as a solid support level since late August, but it gave way a few days ago to selling pressure. The Awesome Oscillator (AO) and RSI were both below their respective neutral levels. This showed bearish momentum on the lower timeframe as well.
The Accumulation/Distribution (A/D) indicator saw a slight uptick in the past few days but not a strong surge. Hence, some buying volume was present but it wasn’t overwhelming.
Conclusion
The retest of the key level at $23.7 could likely see a strong move upward. A lot of buy orders would likely be clumped up in this region of higher timeframe importance for FTX Token. Yet, the indicators did not show a reversal on the cards yet.
The $24.4 level also posed resistance on the lower timeframes for FTT. A move above this level and a bullish retest, or a dip to $23.5, could offer a relatively low-risk buying opportunity.