FTX token, MANA, SAND, Axie Infinity Price Analysis: 06 April

With Bitcoin diving below its 4-hour 20/50 EMA, the FTX token broke down of its up-channel. But its OBV readings still kept the bullish hopes alive.
Also, MANA, SAND and Axie Infinity revealed a selling edge on their near-term technicals. With their 4-hour RSIs hovering near the oversold mark, they positioned themselves for a possible revival.
FTX Token (FTT)
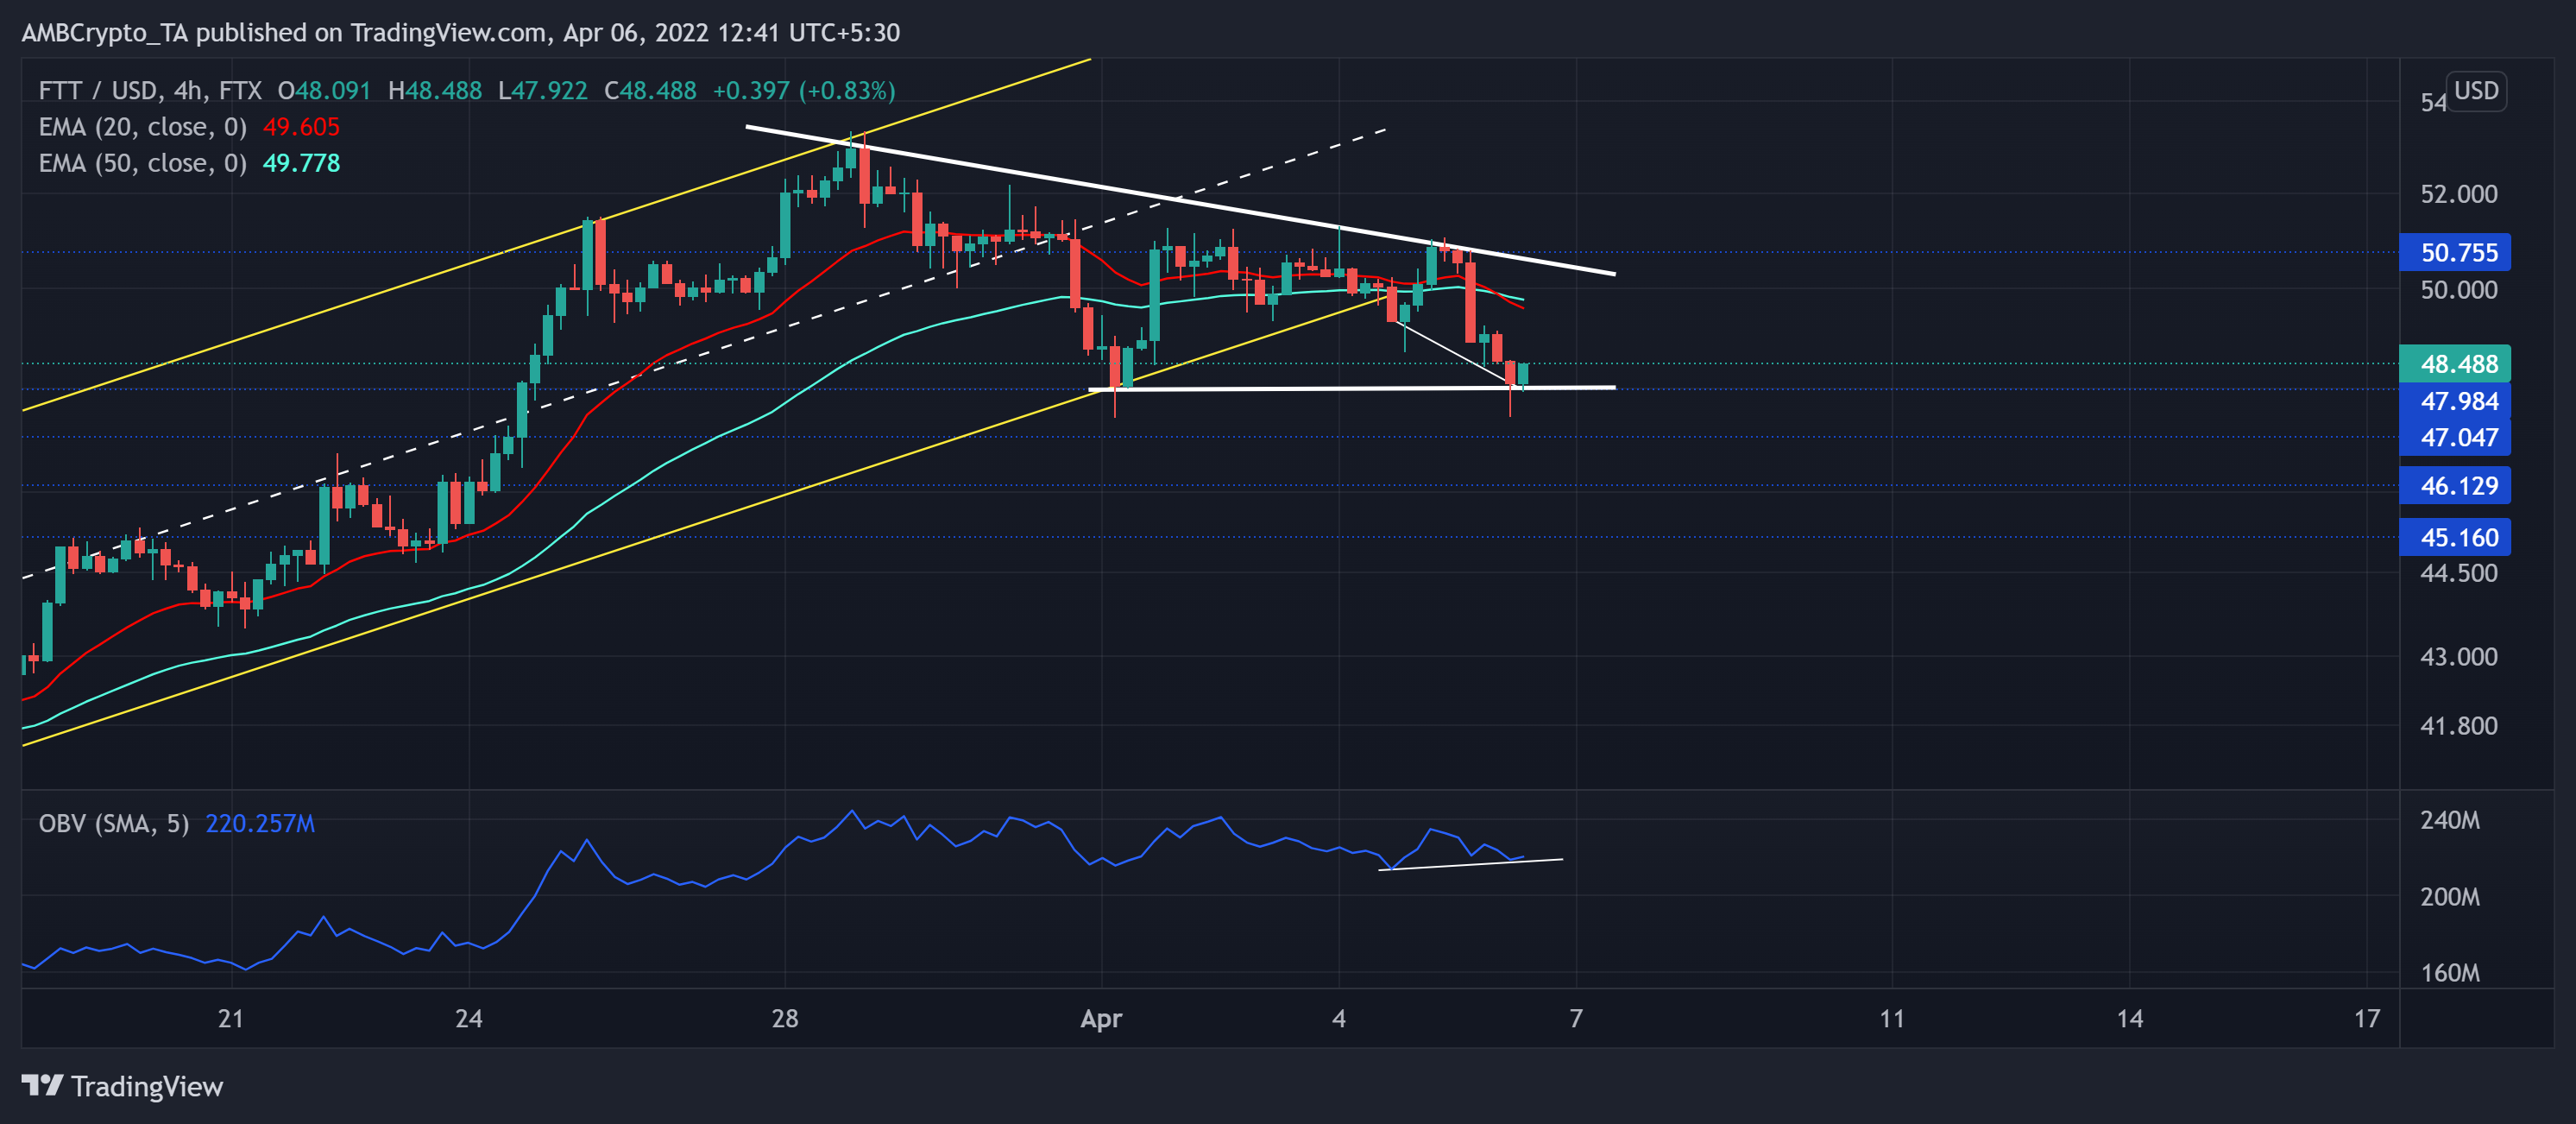
After an unrestrained month-long rally in an ascending channel (yellow), FTT showed slowing signs at the $50-mark. The latest bull rally sprang after the alt matched its six-month lows on 24 January.
While the $50-level long-term resistance stood sturdy, the 20 EMA (red) took a dip below the 50 EMA (cyan) as the near-term trend depicted a bearish inclination.
At press time, FTT traded at $47.77, down by 5.24% in the last 24 hours. Despite the recent plunge, the OBV marked higher troughs in the past two days and bullishly diverged with the price. Thus, the $47-mark support stood as a substantial hurdle for the bears to conquer.
Decentraland (MANA)
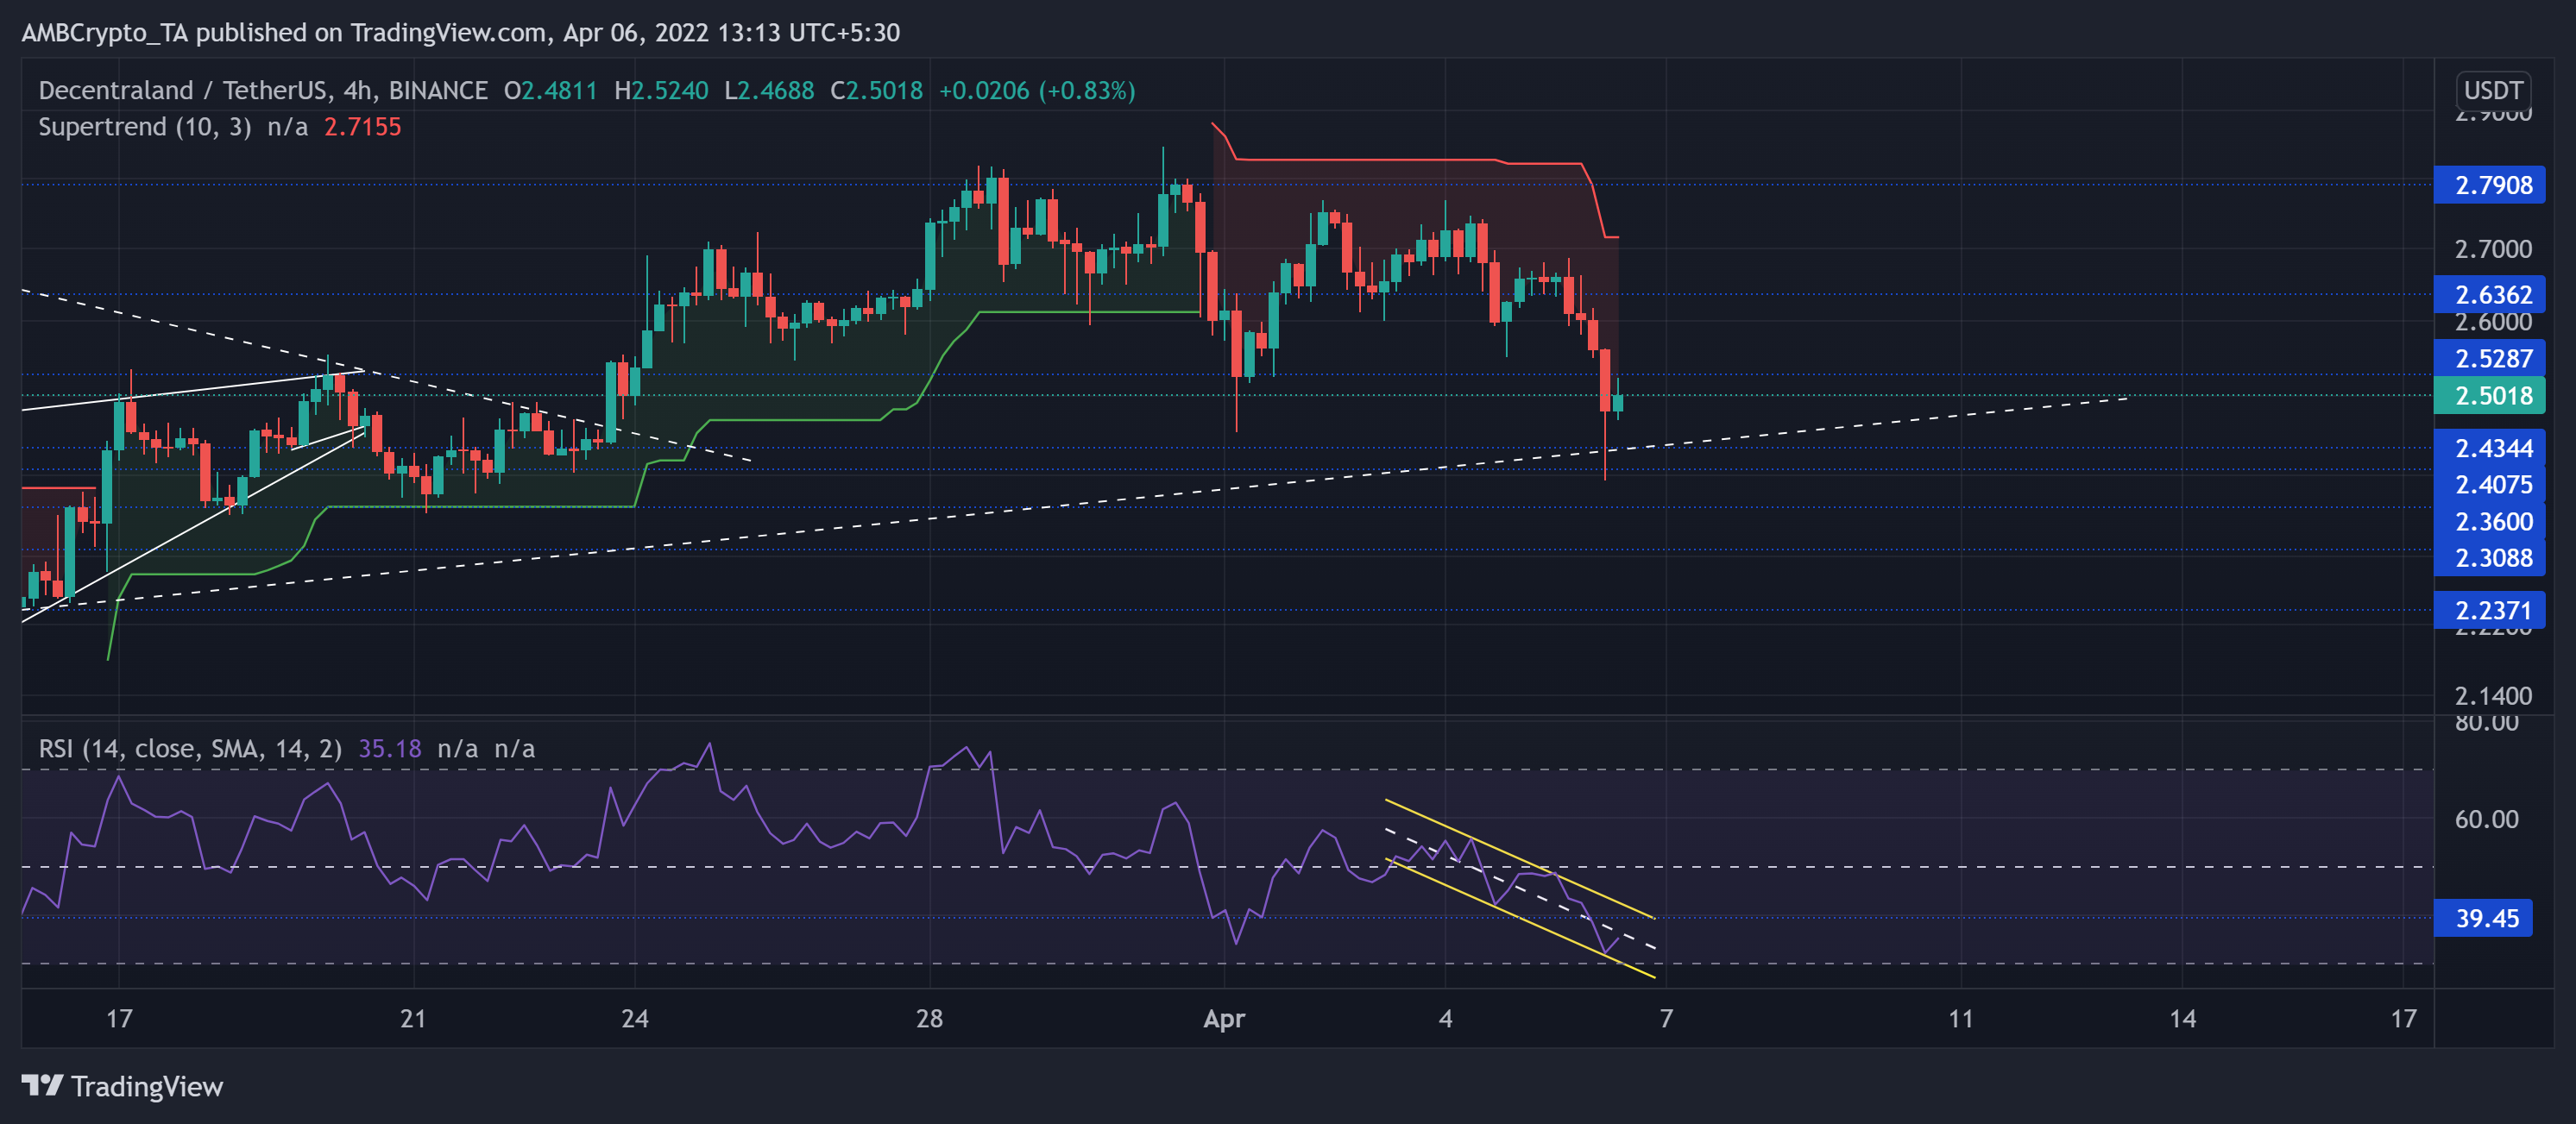
Since touching its 11-week low on 22 January, the alt saw a staggering 107.4% ROI until 9 February. Then, it dropped to test its long-term trendline support (white, dashed).
Over the past few days, MANA grew to retest the $2.7-mark before falling to find a cushion at its trendline support. Furthermore, the Supertrend continued to be in the red zone while favoring the sellers.
At press time, MANA traded at $2.5. The RSI continued its descent in the down-channel. An immediate recovery from here could find resistance at the 39-mark.
The Sandbox (SAND)
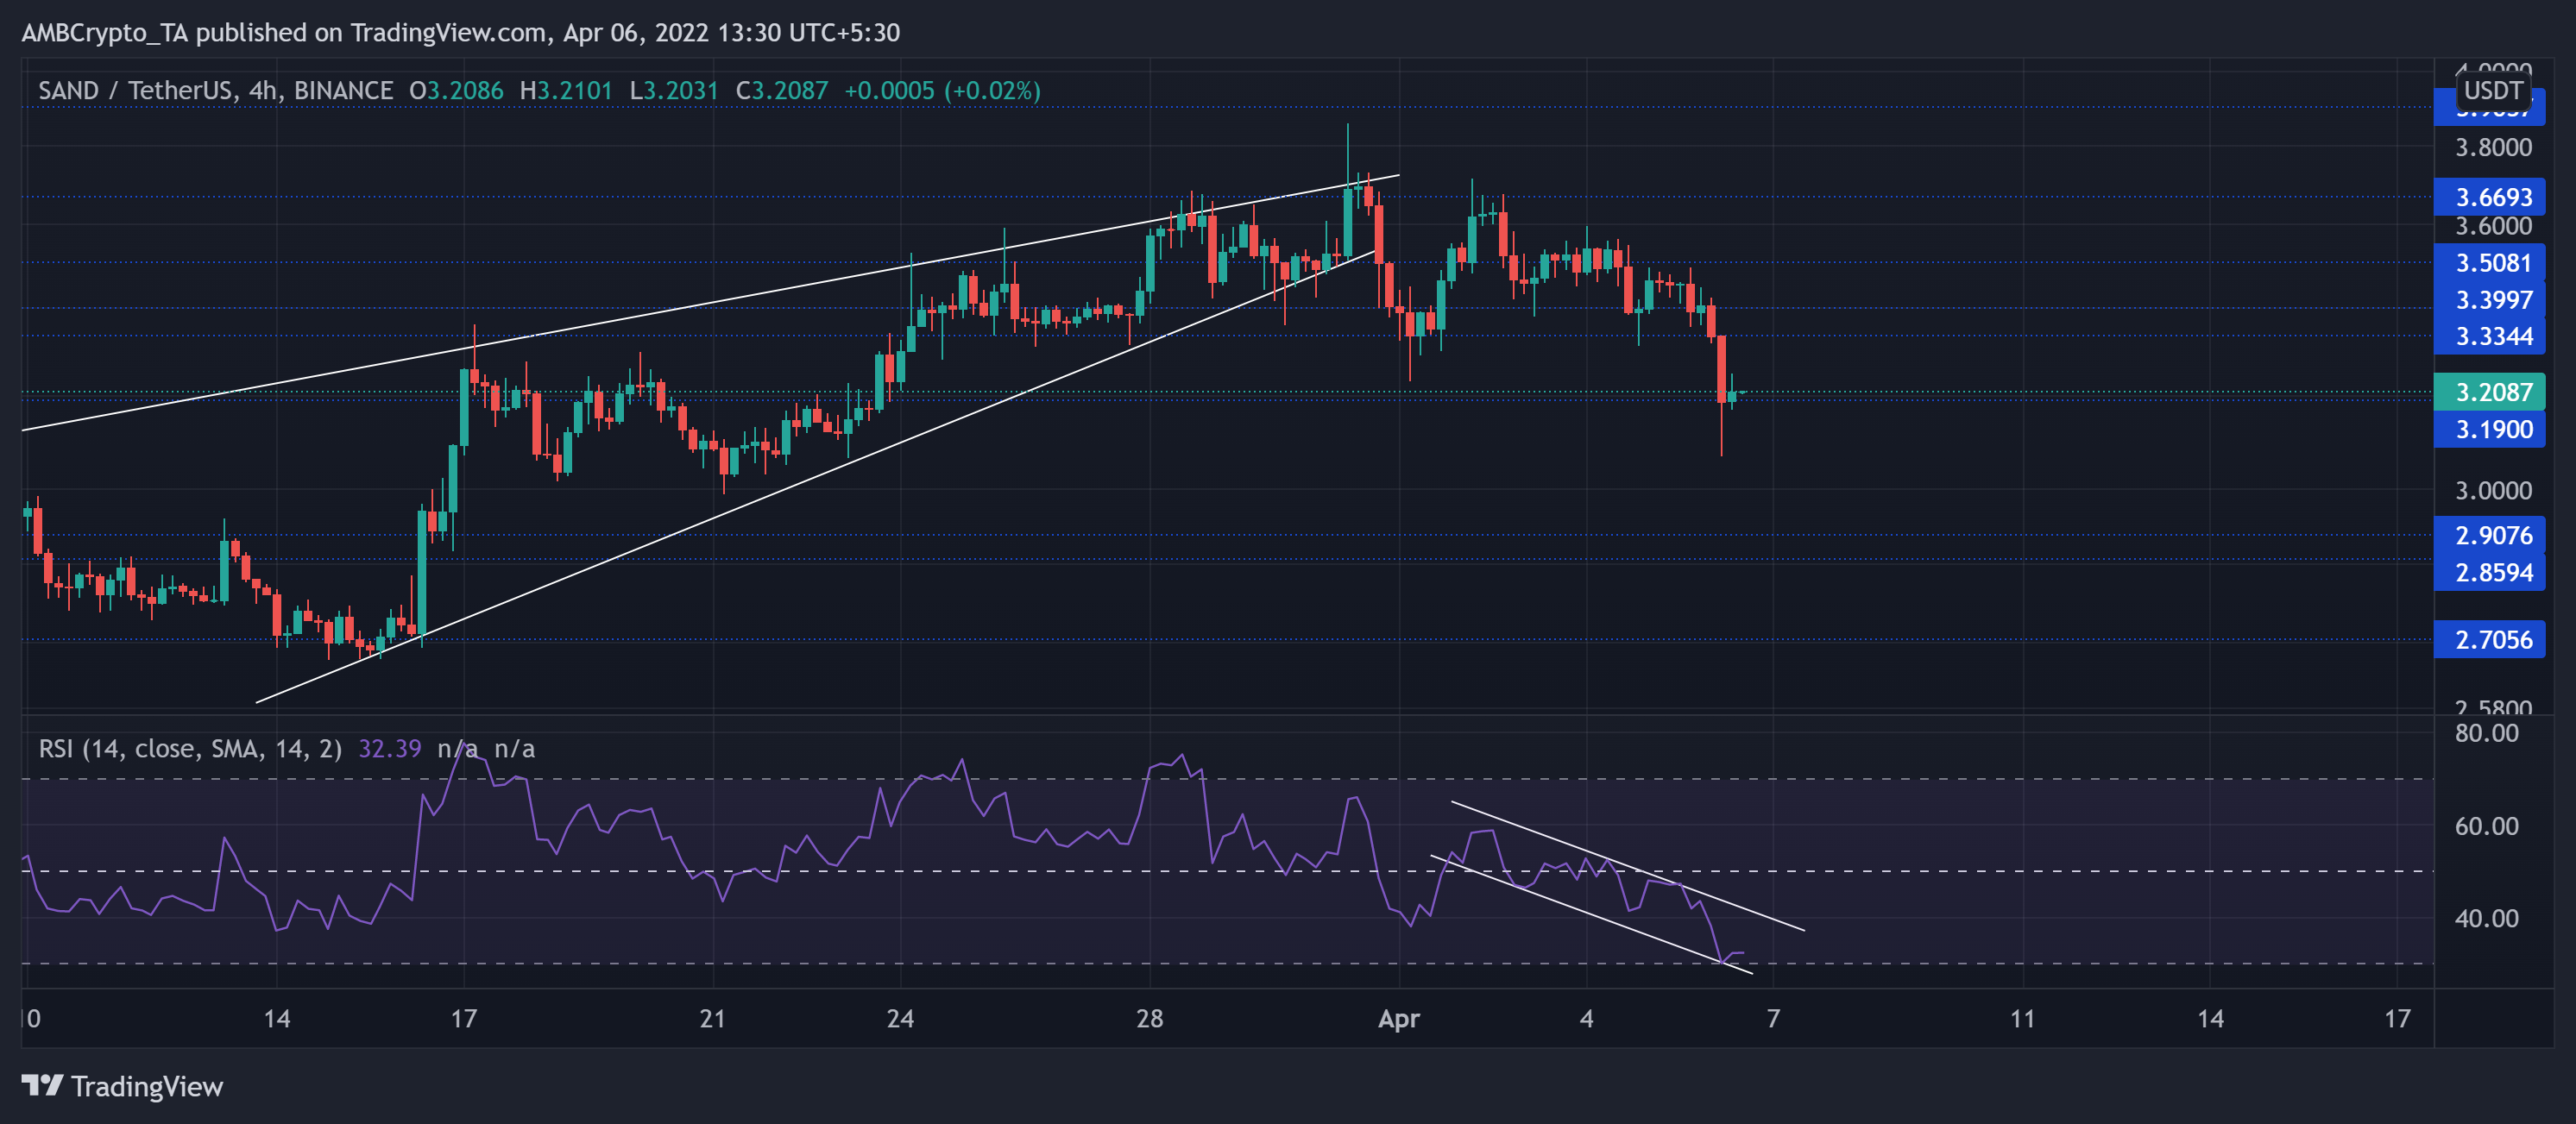
The previous uptrend saw exceptional gains as the altcoin poked the $3.6-resistance. As the bears gained a heightened momentum, they initiated a sell-off that led to an expected breakdown from its rising wedge (white).
At press time, SAND traded at $3.2. RSI‘s recent setback caused it to lose the midline support. But as it approached the oversold territory, the bulls would now be keen on triggering a near-term retrieval.
Axie Infinity (AXS)
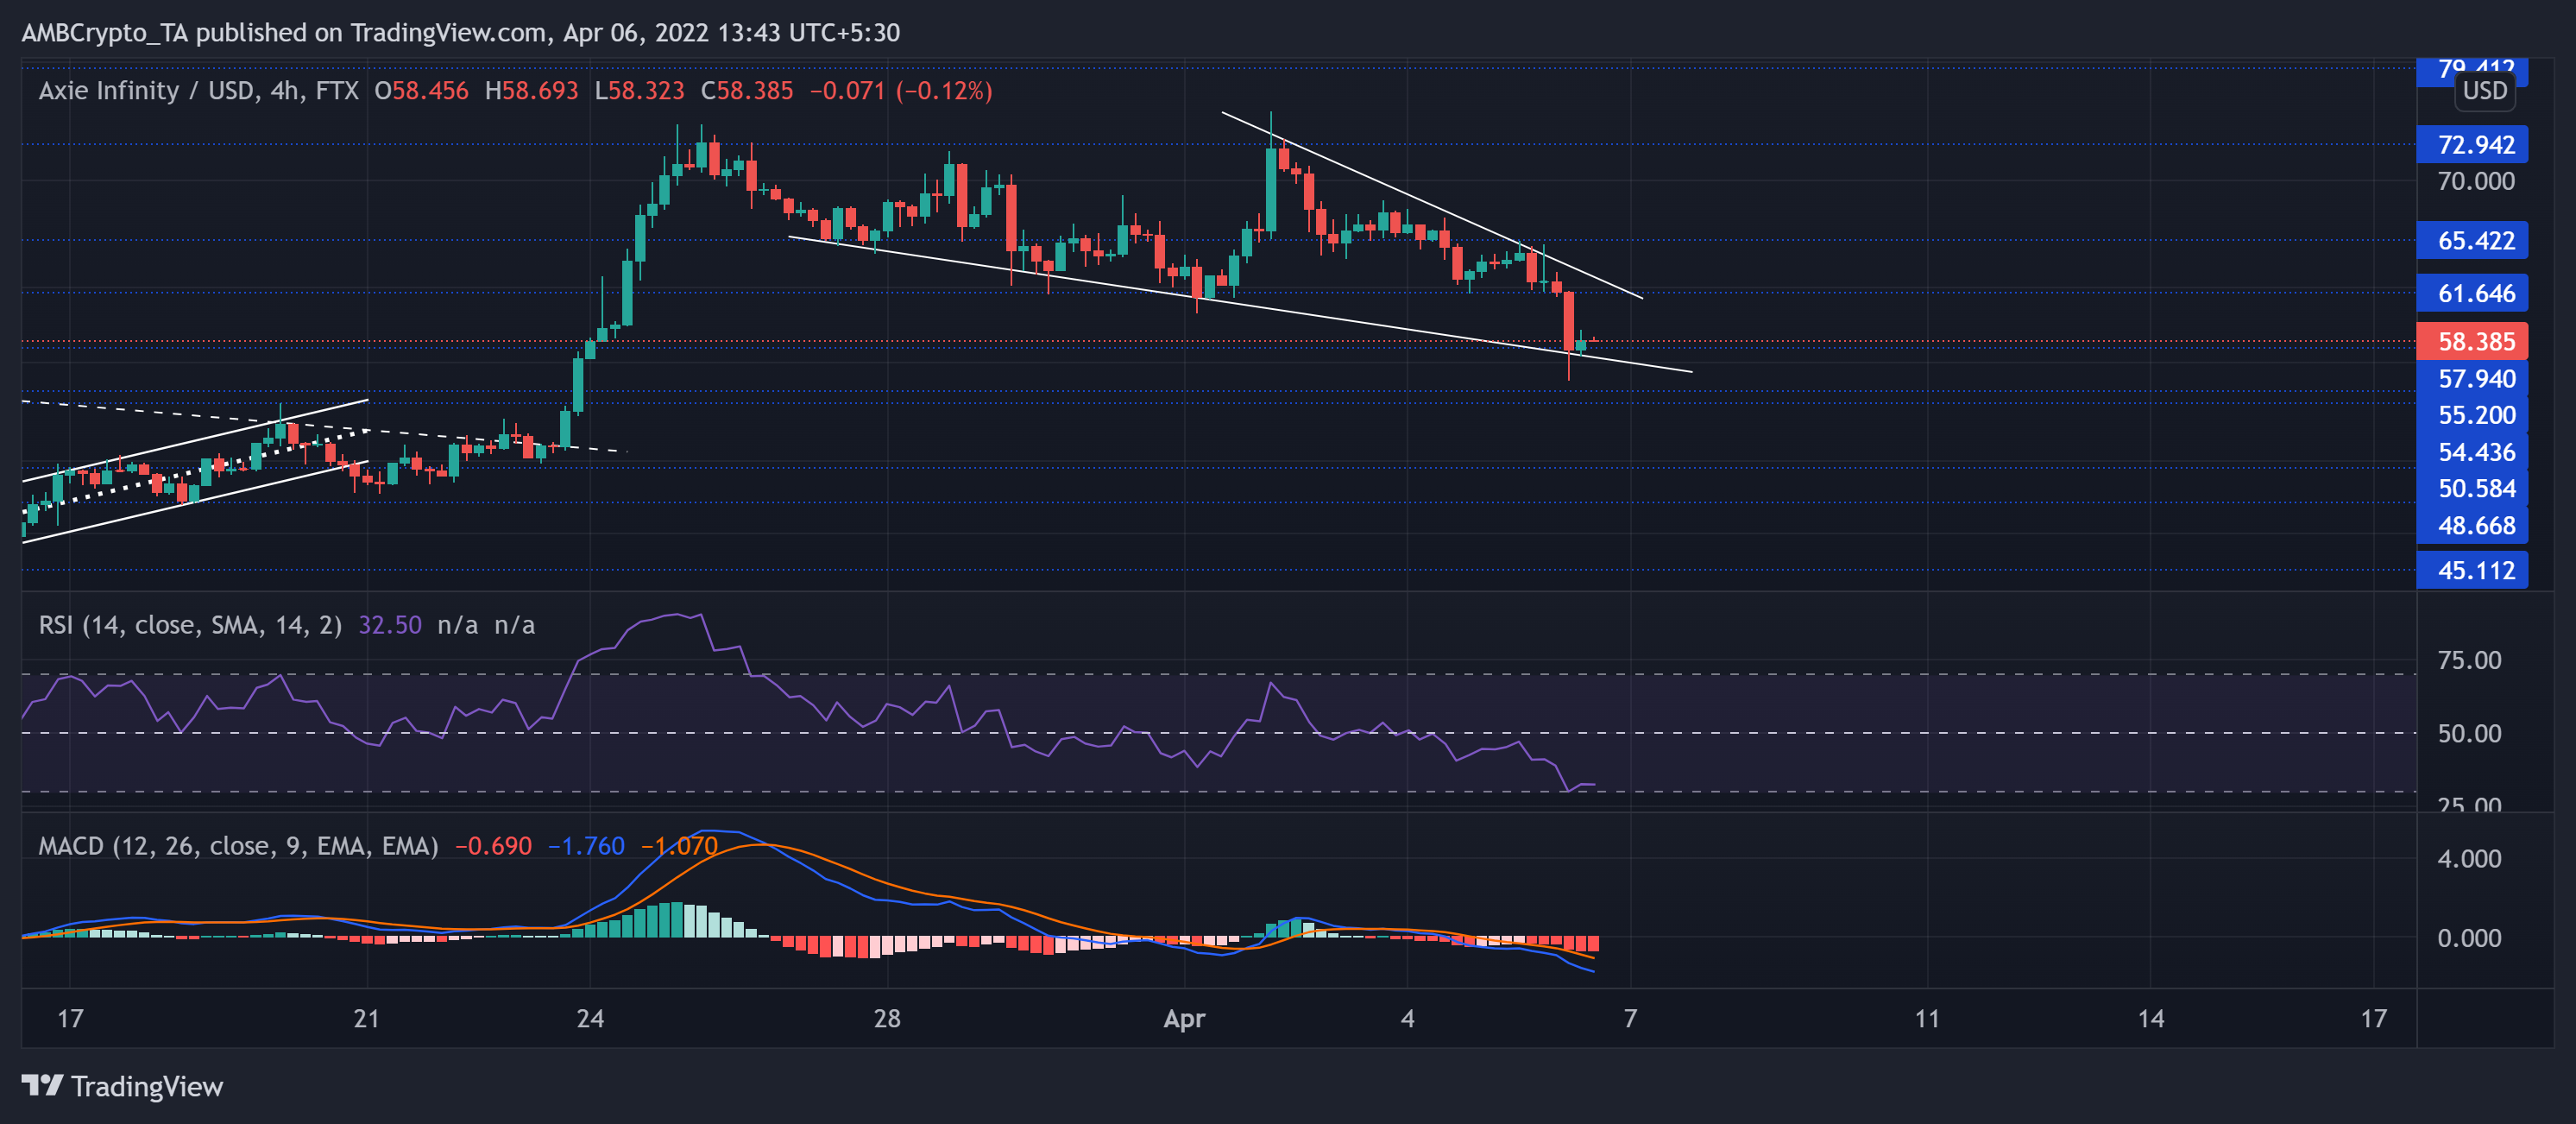
The previous retracement phase witnessed a 74.4% loss (from its ATH). As a result, AXS touched its six-month low on 24 February.
During this fallout, the altcoin lost the critical $80-mark while the bulls kept the $42-floor intact. As a result, AXS has been on a gradual recovery ever since. The latest rally saw staggering gains until the beginning of this month. Over the last few days, AXS depreciated in a falling wedge.
At press time, AXS traded at $58.385. The RSI hit the oversold territory and positioned itself for a near-term revival. The MACD depicted a bearish edge whilst its histogram and lines plunged below the zero-line.


