Gauging MANA’s upside potential after altcoin reclaimed key price levels
MANA reclaimed key support at $0.26, but that alone might not work out!

- MANA continued its long-term downtrend but recently reclaimed a few crucial support levels
- Derivates data for the altcoin hinted at a bullish edge while the broader market sentiment remained uncertain
MANA recently retested its multi-year lows around the $0.25 mark after charting a bearish flag breakout on its daily chart. However, the anticipated breakdown found rebounding grounds at the $0.25 level. This allowed MANA to bounce back and reclaim the $0.269 support above the 20 EMA. At press time, MANA was trading at $0.275, up nearly 5.8% over the last 24 hours.
Can MANA bulls reclaim a spot above the 50-day EMA?
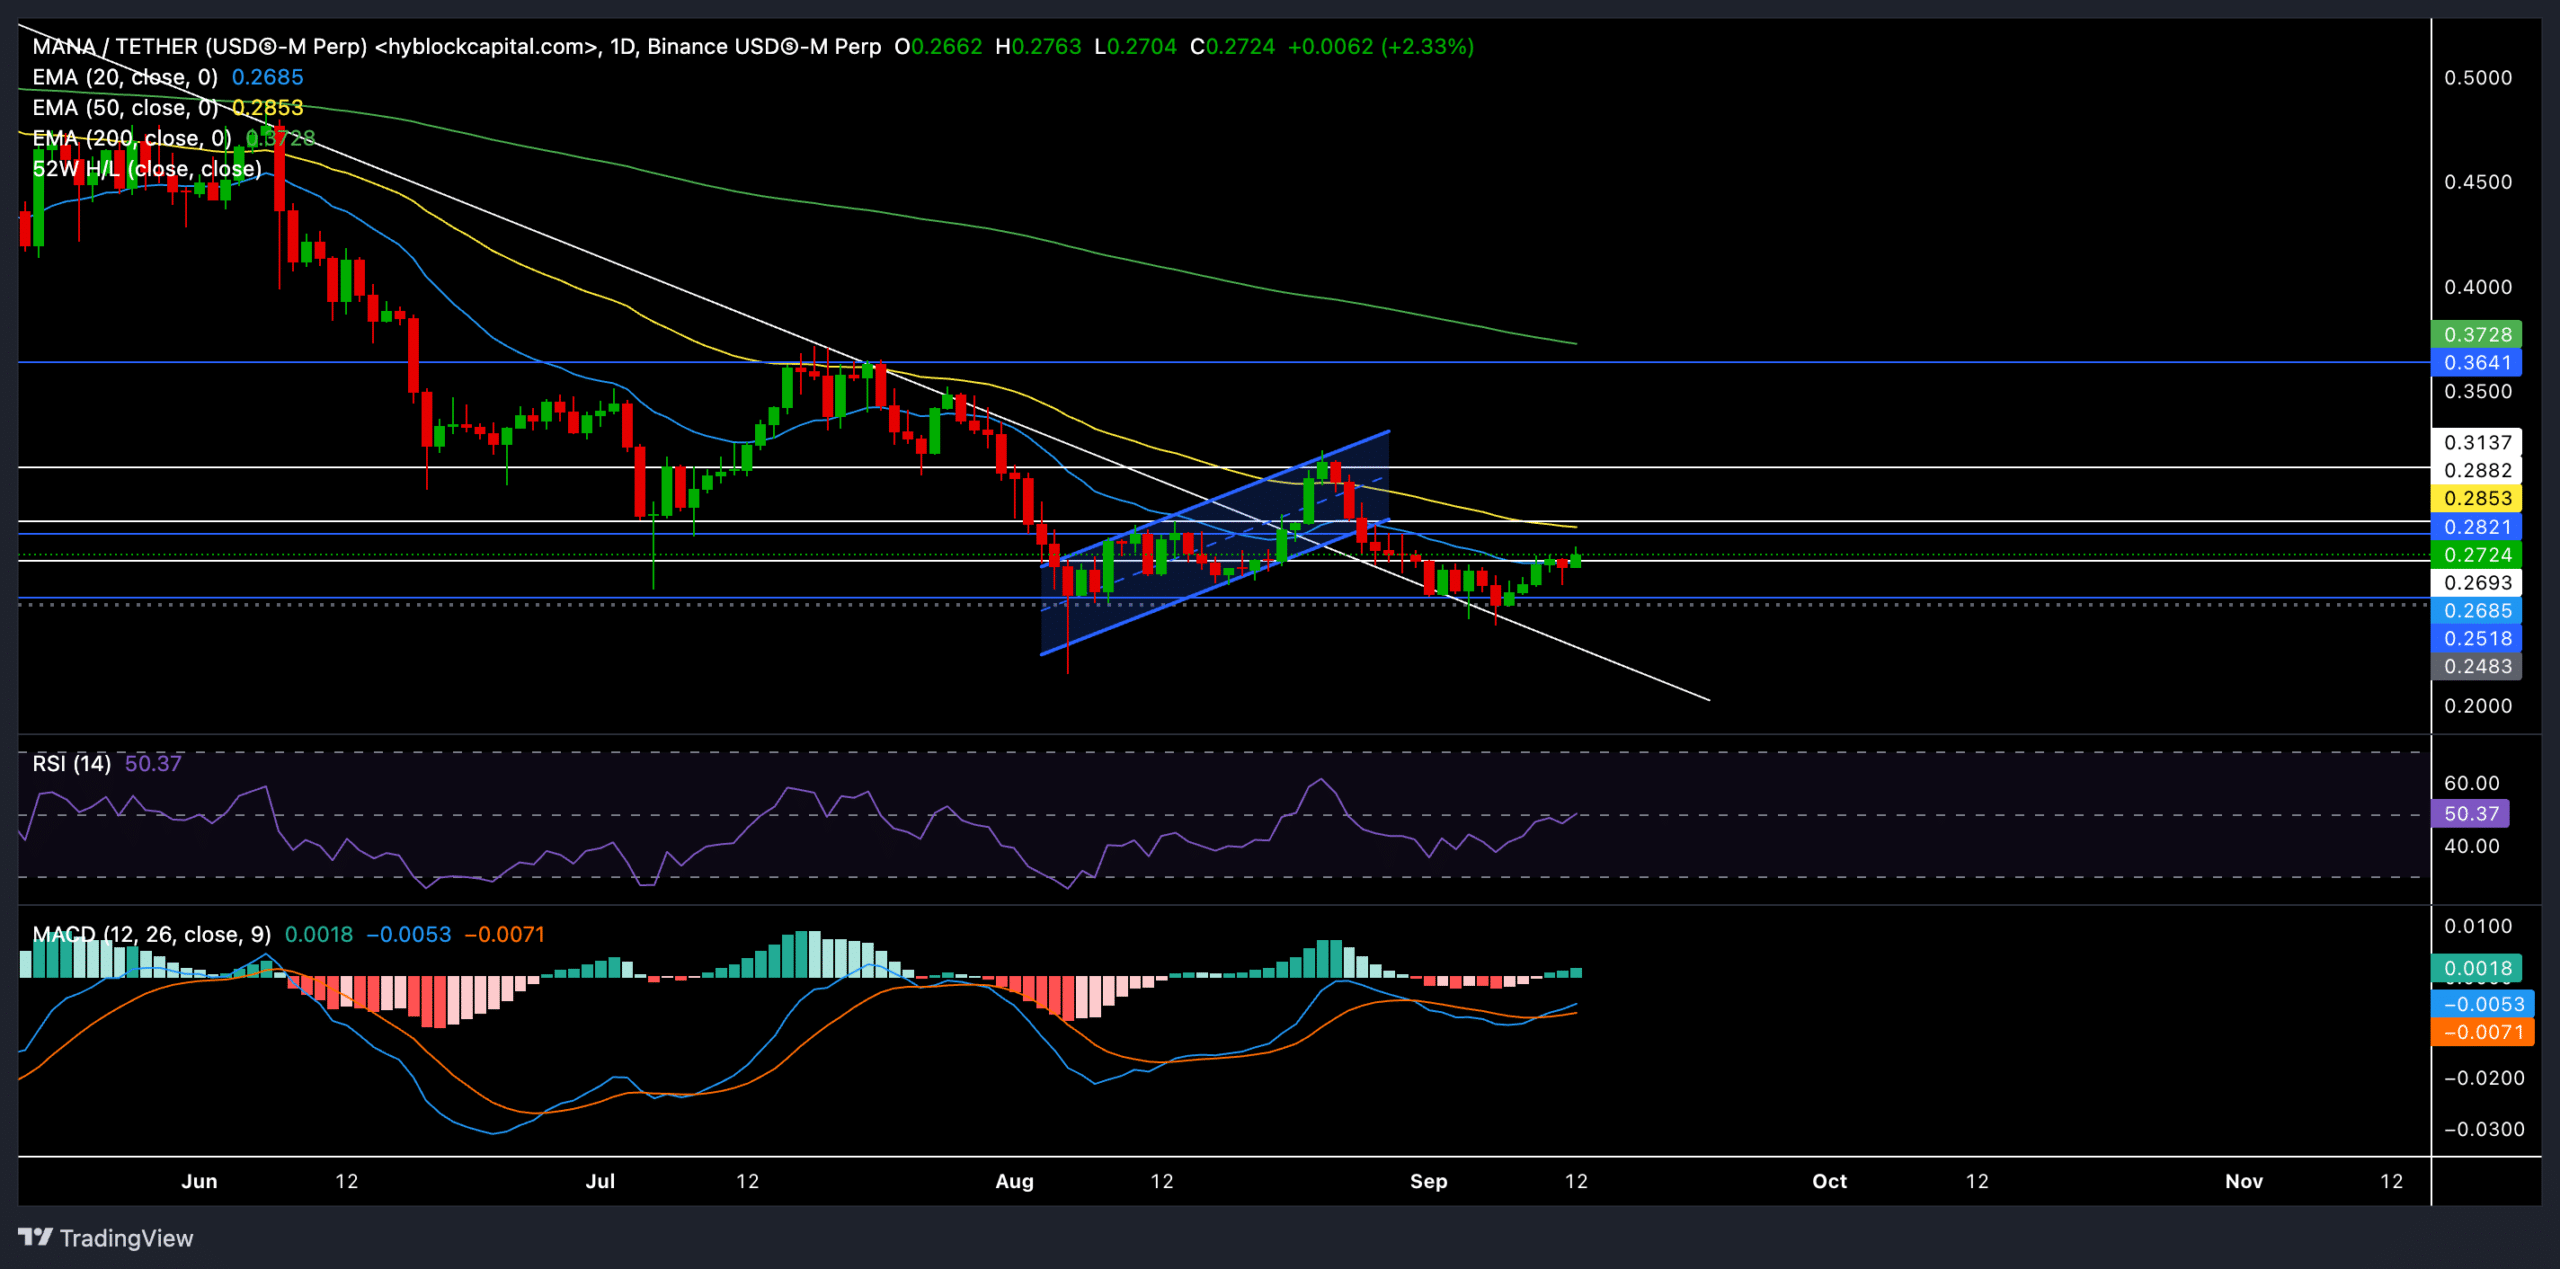
The latest bullish push came after sellers retested the $0.25 support level last week. As a result, the altcoin stayed above the 20-day EMA and showed early signs of a near-term recovery.
A sustained upward trajectory from here could face immediate resistance near the 50-day EMA at $0.285 and the $0.28 resistance zone. Should the bulls push beyond these levels, a retest of the $0.31 resistance could become possible in the coming weeks.
However, given that the broader sentiment was still in the ‘Fear’ zone, buyers should look for substantive signals before entering a long position.
Here, it’s worth noting that the recent recovery was further supported by a bullish divergence on the Relative Strength Index (RSI). The RSI bounced from oversold levels and at press time, was hovering around the neutral 50 mark. A jump above this level could confirm a more sustained bullish bias.
The MACD showed diminishing bearish momentum and saw a bullish crossover between the MACD and Signal line. If these lines close above zero, the altcoin could see an extended uptrend.
Derivatives data revealed THIS

The long/short ratio stood at 1.0483. The market revealed a slight bullish bias with more longs than shorts, particularly with Binance’s MANA/USDT long/short ratio showing a reading of 2.63.
On the other hand, the liquidation data pointed to shorts being squeezed, with $3.71K in short liquidations over the past 1–12 hours and $5.67K liquidated in the last 12-24 hours. This data further supported the recent bullish price action.
MANA’s near-term outlook depends heavily on whether the bulls can maintain control above the 20-day EMA and break the $0.2854 resistance. A close above this level would open the door for a retest of the $0.31 resistance zone and solidify the recovery. Traders should also watch the RSI and MACD closely for confirmation of a sustained bullish bias.
As always, keeping an eye on Bitcoin’s price action could provide important insights. Especially as MANA has a strong correlation with BTC.