Going long on AVAX? Consider this ‘catch’ before you jump in

Disclaimer: The information presented does not constitute financial, investment, trading, or other types of advice and is solely the writer’s opinion
- AVAX rallied on the daily chart with a possible MACD crossover
- The upside breakout from the bullish wedge has a target between $15.5 and $16.0
- However, the price-volume divergence could cause a price reversal
Since the crypto-crash in early November, Avalanche (AVAX) has posted unsuccessful price recoveries. The rallies only pushed AVAX lower and lower, breaking through several supports along the way.
Read Avalanche’s [AVAX] Price Prediction 2023-24
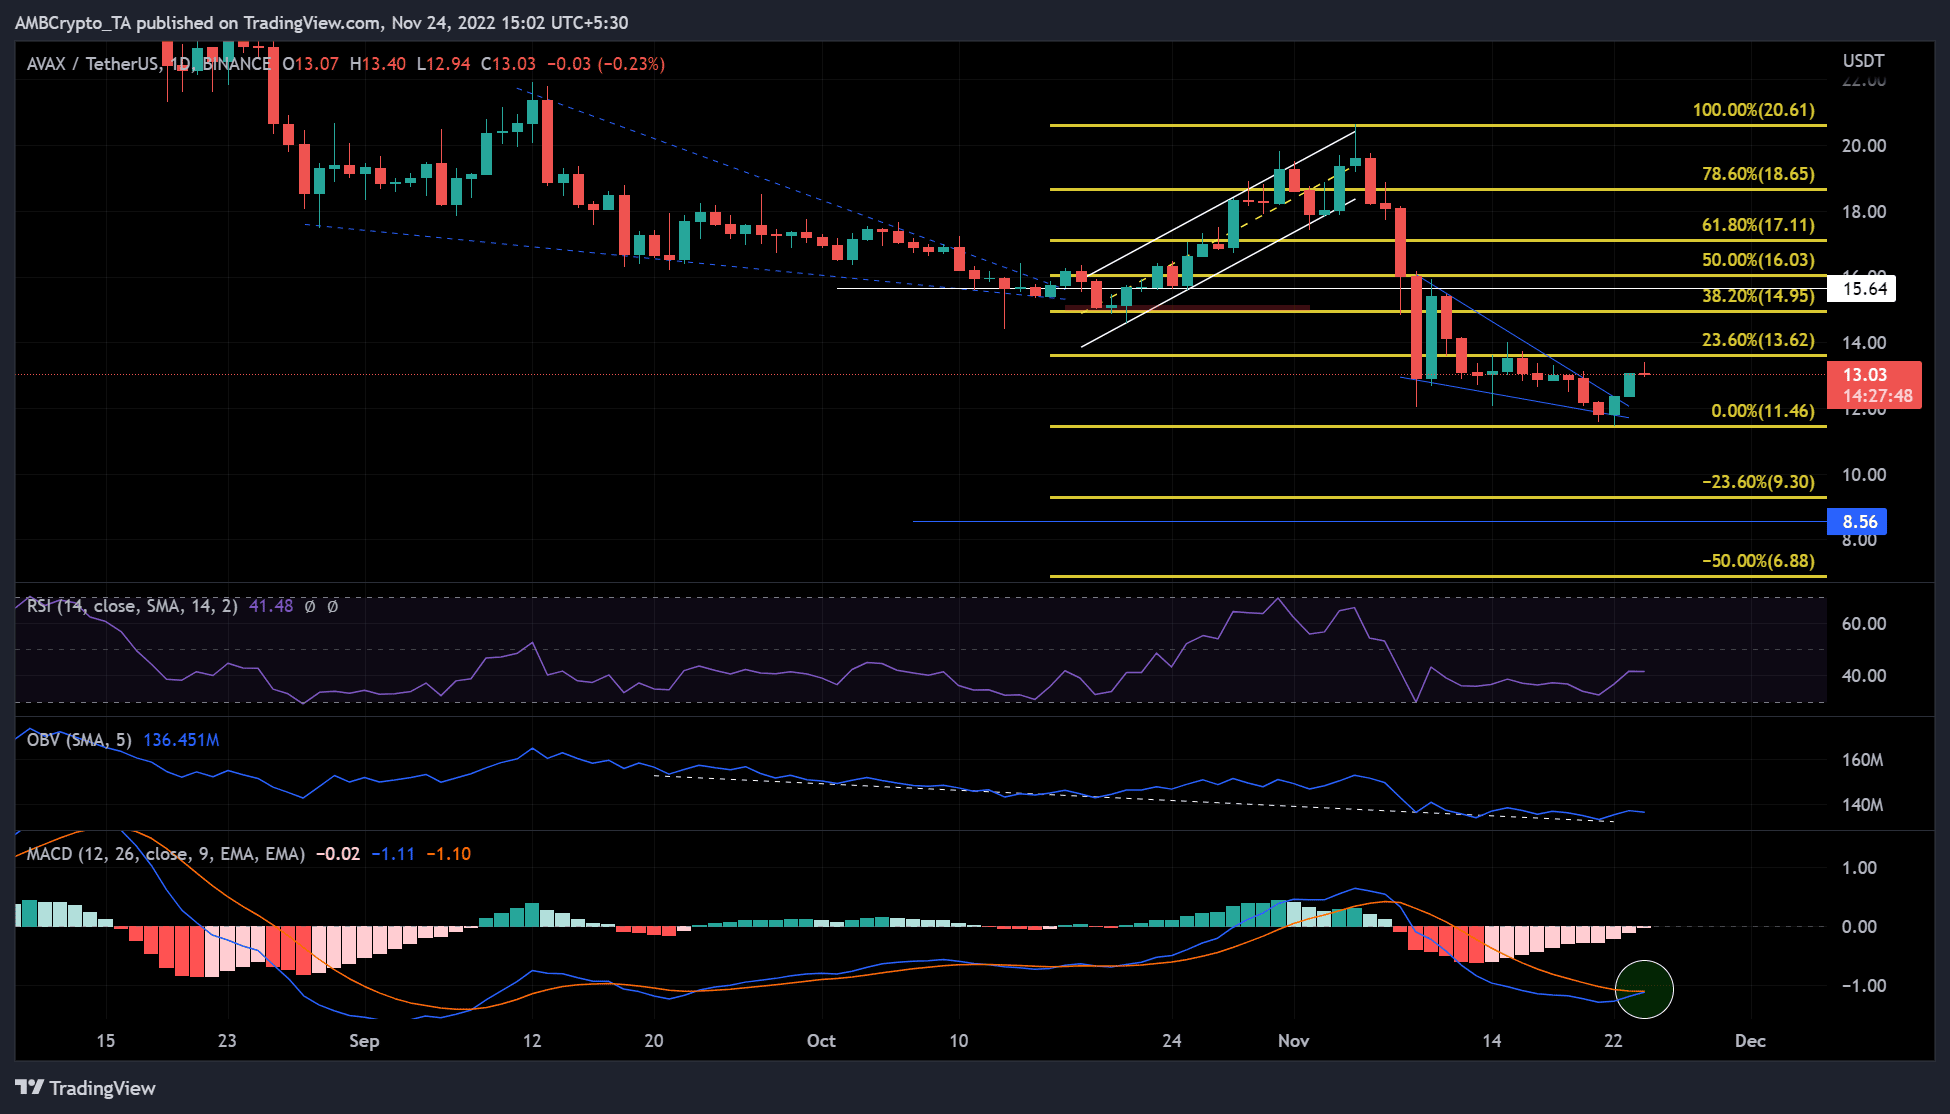
However, at press time, AVAX seemed determined to regain lost ground. It was trading at $13.05 after an upside breakout from a bullish wedge chart pattern (blue line). An earlier and similar bullish wedge pattern (blue, dotted ) led to a bullish breakout, one that drove AVAX to a new ATH of $20.61 in November.
If history repeats itself, AVAX could reach this new high in the next few weeks or months.
Can bulls sustain their momentum?
AVAX’s price action curved out a falling wedge (blue, dotted) between September and mid-October. After that, a bullish breakout, typical of a falling wedge pattern, put AVAX on an uptrend from mid-October onwards.
The uptrend after mid-October drew a rising channel (white). In most cases, a rising channel is followed by a downtrend. In AVAX’s case, the downtrend coincided with the crypto-crash of early November. The altcoin’s price crashed from $20 to $11.5, losing about 50% of its gains in the process.
The price movement of AVAX after the crash formed another bullish wedge chart pattern (blue line). If it follows its previous trend, the bullish breakout could set AVAX up for another price rally in the coming days or weeks.
The height of the previous bullish wedge matched the height of the rising channel (white), leading to an ATH in November at $20.6 (100% Fib level). The prevailing bullish wedge could also trigger an uptrend. Due to its height, the new target could be at $15.64.
The Relative Strength Index (RSI) seemed to be retreating from the oversold territory – A sign of selling pressure. A possible Moving Averages Convergence Divergence (MACD) crossover also revealed that buyers have been inching closer to control.
However, the On Balance Volume (OBV) projected a slight uptick after making a series of lows since late September. It underlined low trading volume that could undermine buying pressure.
An intraday candlestick close below the press time support at $11.46 would invalidate the above bullish bias. In this case, AVAX could extend its decline to new supports at $9.3 or $8.5.
Price-volume divergence and decline in development activity
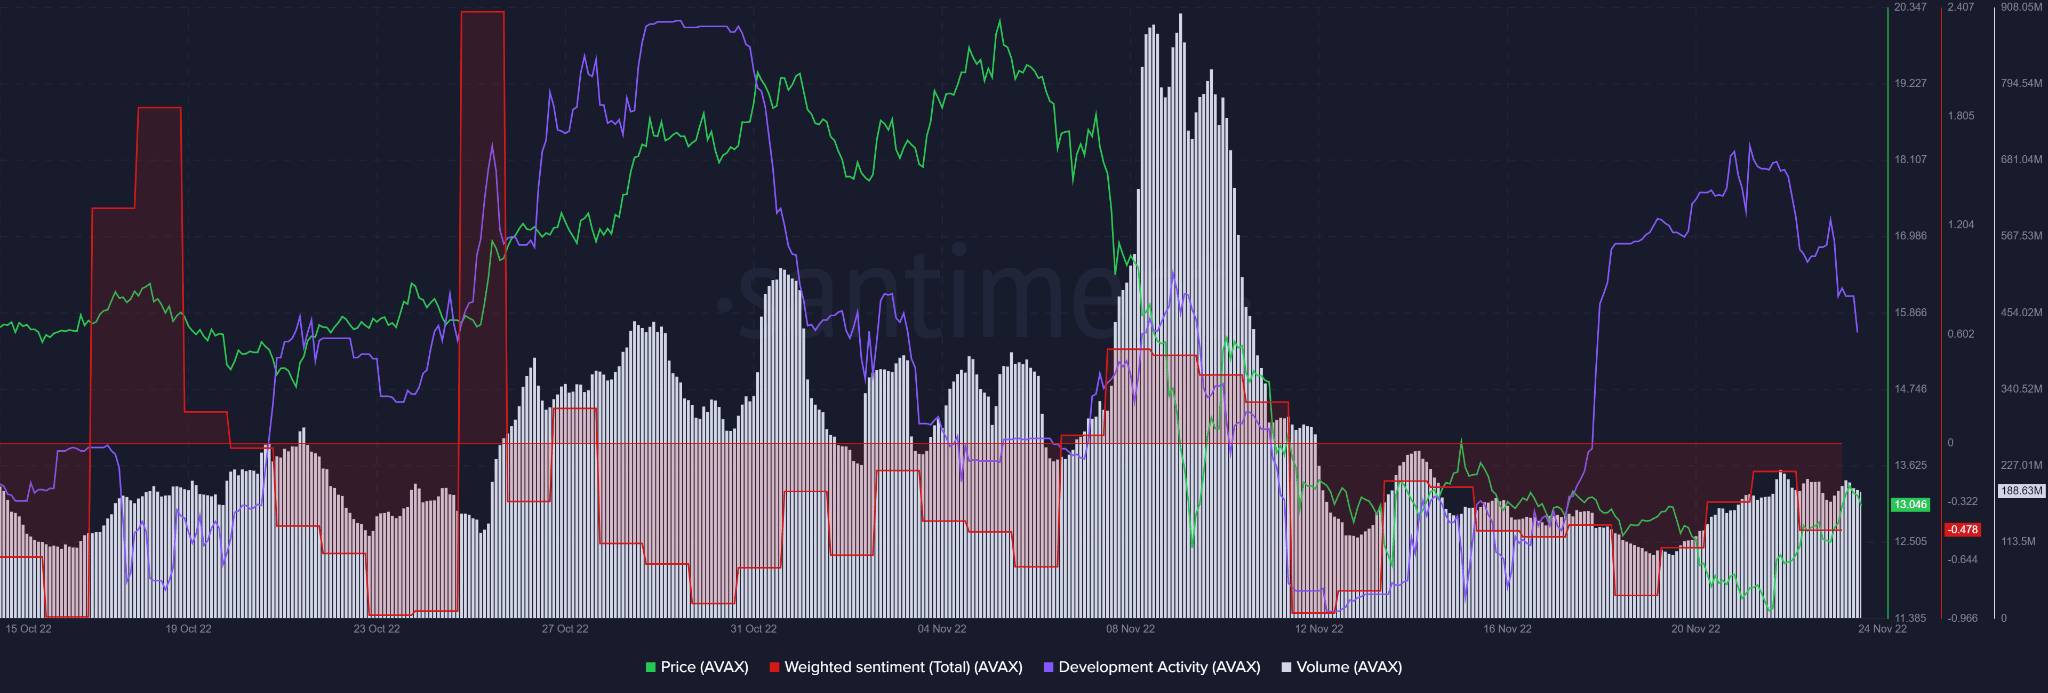
According to Santiment, AVAX’s development activity steadily increased from mid-October. The price also appreciated significantly, as shown in the chart above and the rising channel (white) on the price chart.
However, development activity declined from the end of October, only to rise in mid-November and fall afterwards. The price followed the trend with all consistency. Moreover, price inclines corresponded to positively weighted sentiment and vice versa.
At press time, a price-volume divergence revealed falling trading volumes with rising prices. This probably is a sign of an imminent price correction.
Therefore, it may be worthwhile for long-term investors to track AVAX’s development activity and sentiment.


