
- ETC formed a symmetrical triangle chart pattern and was in a bearish market structure.
- A convincing breakout to the downside could find new support at $14.27.
- A bullish breakout and intraday close above $20.28 would disprove this prediction.
Ethereum Classic [ETC] was in a rally before the market crash in early November knocked it off track. Aside from 23 November, which encountered significant resistance at $20.28, ETC has never seen another major rally.
At press time, ETC was trading at $18.80 in a mild bullish momentum that could fizzle out, given the bearish outlook of technical indicators. Most importantly, ETC chalked out a symmetrical triangle pattern that could lead to a downside breakout.
ETC forms a bearish triangle pattern: Will bears take charge?
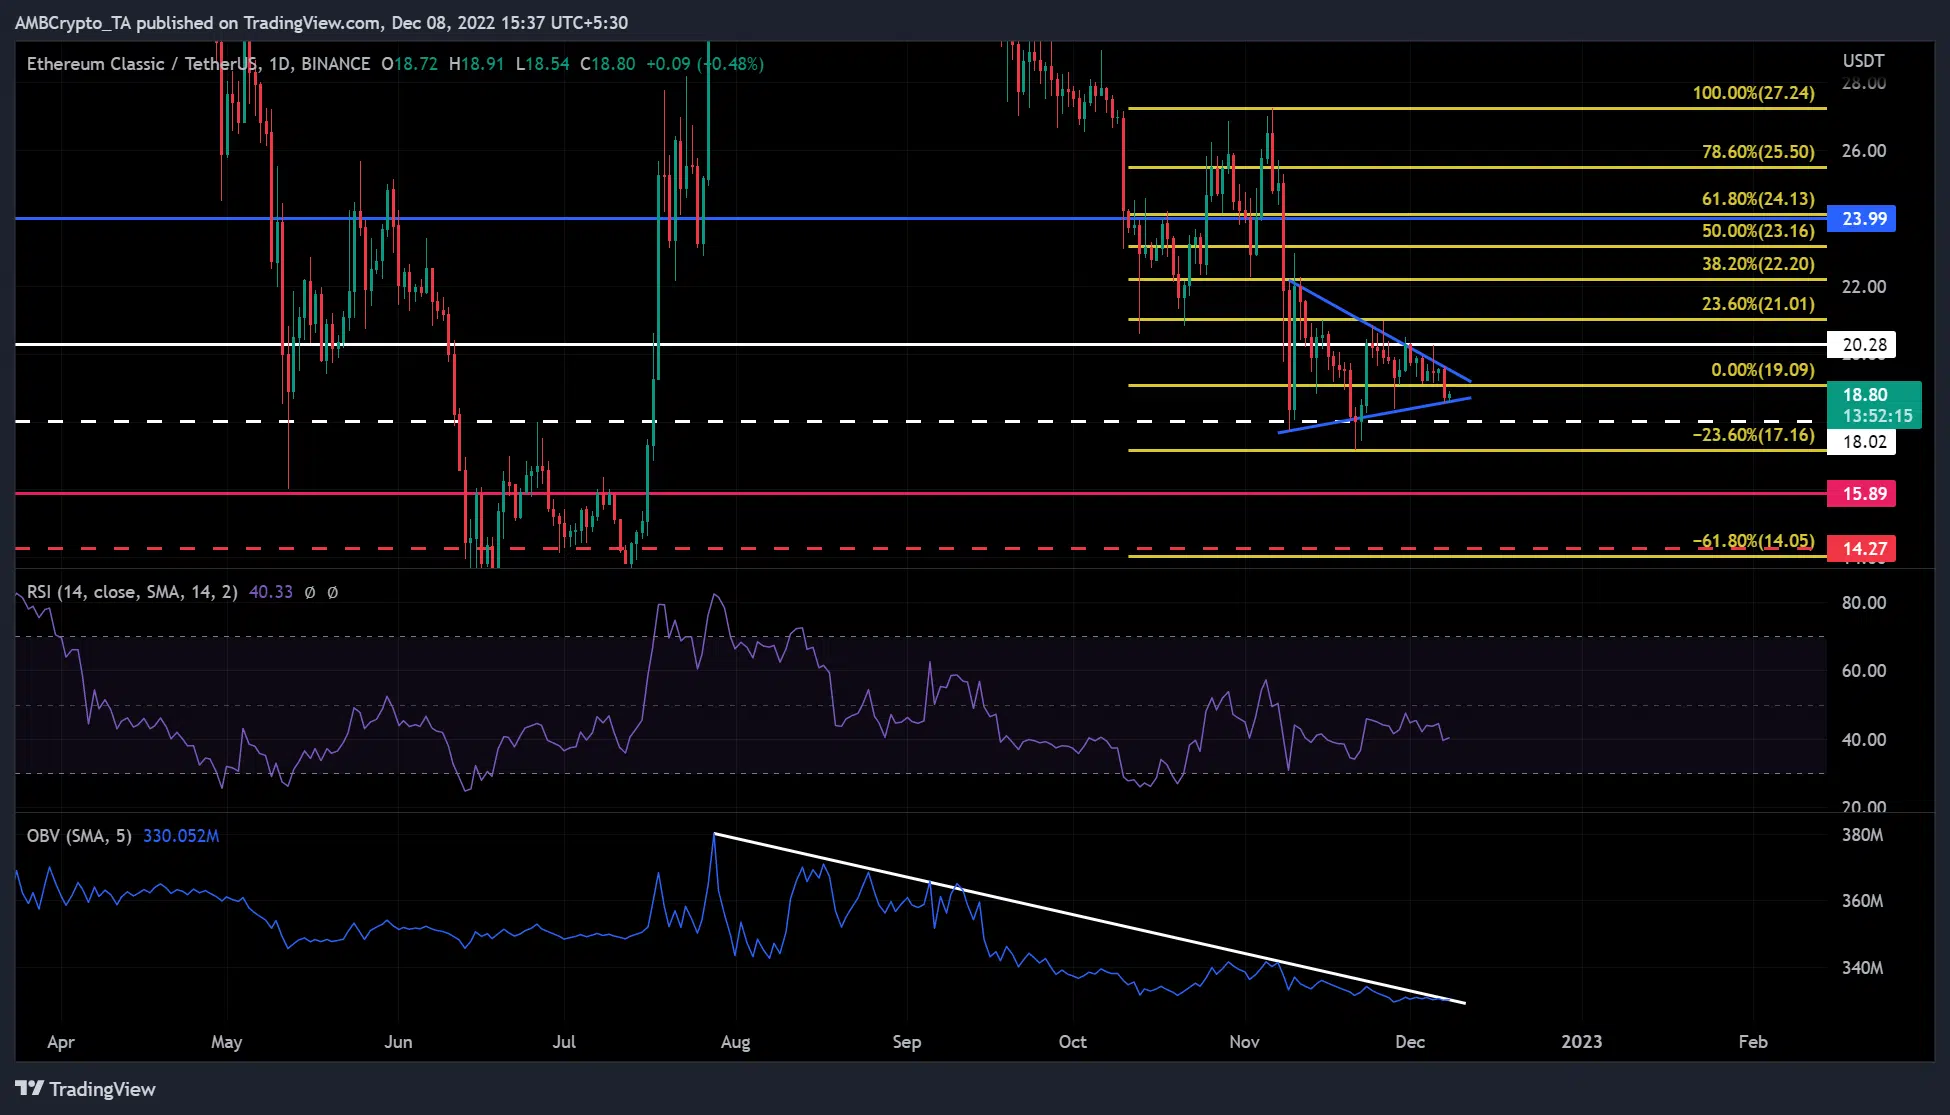
Source: ETC/USDT on TradingView
ETC’s price action since 10 November has formed an asymmetrical triangle. ETC is more likely to see a bearish breakout as the triangle pattern is in a bearish market structure.
The major technical indicators suggest that a downside breakout is also more likely. The daily ETC chart’s Relative Strength Index (RSI) is below the neutral level and is on the way down. In addition, the RSI moved in the lower range, which indicates that the sellers had a significant impact on the market.
In addition, the On Balance Volume (OBV) has been hitting lower and lower highs since August. This shows a steady decline in trading volume, which undermines the strong buying pressure. Thus, sellers have a great opportunity in the market.
So a bearish breakout from the triangle pattern is quite possible. If the breakout succeeds, ETC could find new support targets at $18.02, $15.89, $14.27, and $14.05.
However, an intraday close above $20.28 resistance would negate this prediction. Such a convincing bullish breakout could lead ETC to a new resistance target at $24 in the coming days or weeks.
ETC saw a decline in Open Interest rates across major exchanges
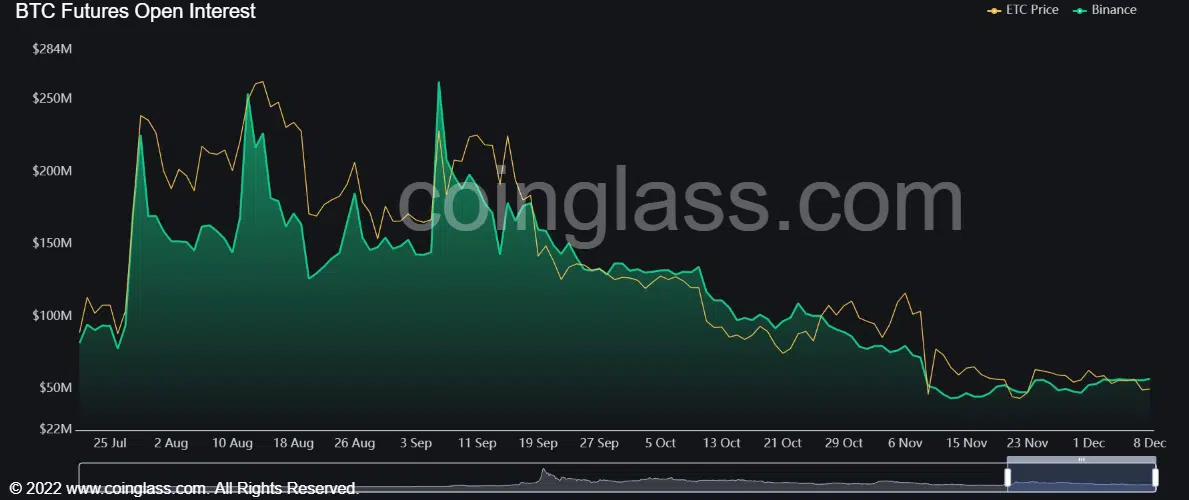
Source: Coinglass
According to Coinglass, ETC saw a decline in open interest rates from August. On Binance alone, money flowing into the ETC futures market fell from $250 million in August to around $50 million, at the time of publication.
That’s a whopping 80% drop in money flowing into ETC futures. A similar trend can be seen in other major exchanges as well.
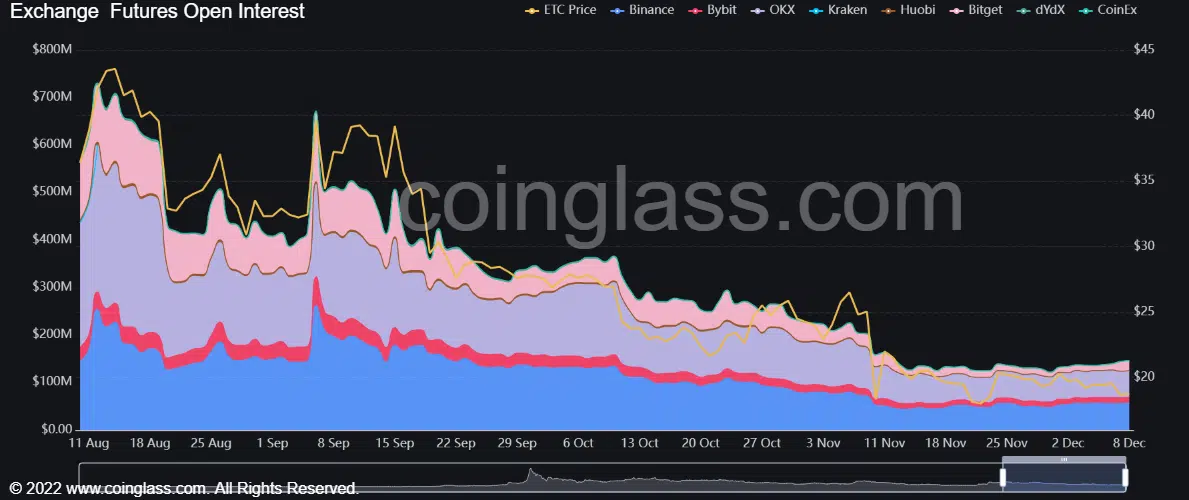
Source: Coinglass
This shows investors’ outlook for ETC futures has been declining since Q3 2022. Therefore, it might take some time for the sentiment to turn positive.
Interestingly, the sentiment in the derivatives market also affects the spot market. Therefore, the current bearish sentiment for ETC could continue for some time. This will put downward pressure on the price of ETC.
However, should BTC regain the $17K mark and move higher, ETC could see an upside breakout and invalidate the above forecast.