GOON crypto up 1,900% in a day – What next for the low-cap coin?
GOON has strong bullish potential in the coming hours, but there needs to be greater demand or the momentum might fall flat.
- GOON is up 1,940% in 24 hours.
- The token’s price recovery is on track after the large pullback.
Goon [GOON] crypto saw gains of nearly 6000% in under five hours but was forced to retrace a good chunk of those gains. The meme coin’s market capitalization is only $1.2 million, meaning large price pumps do not require as much volume as larger-cap altcoins.
The market will likely see these swift pumps continue for the hundreds of new tokens out there. For each token that makes these remarkably quick rallies, a score of others has likely faded into irrelevance. This is one of the reasons why hunting for low-cap “gems” is a risky venture.
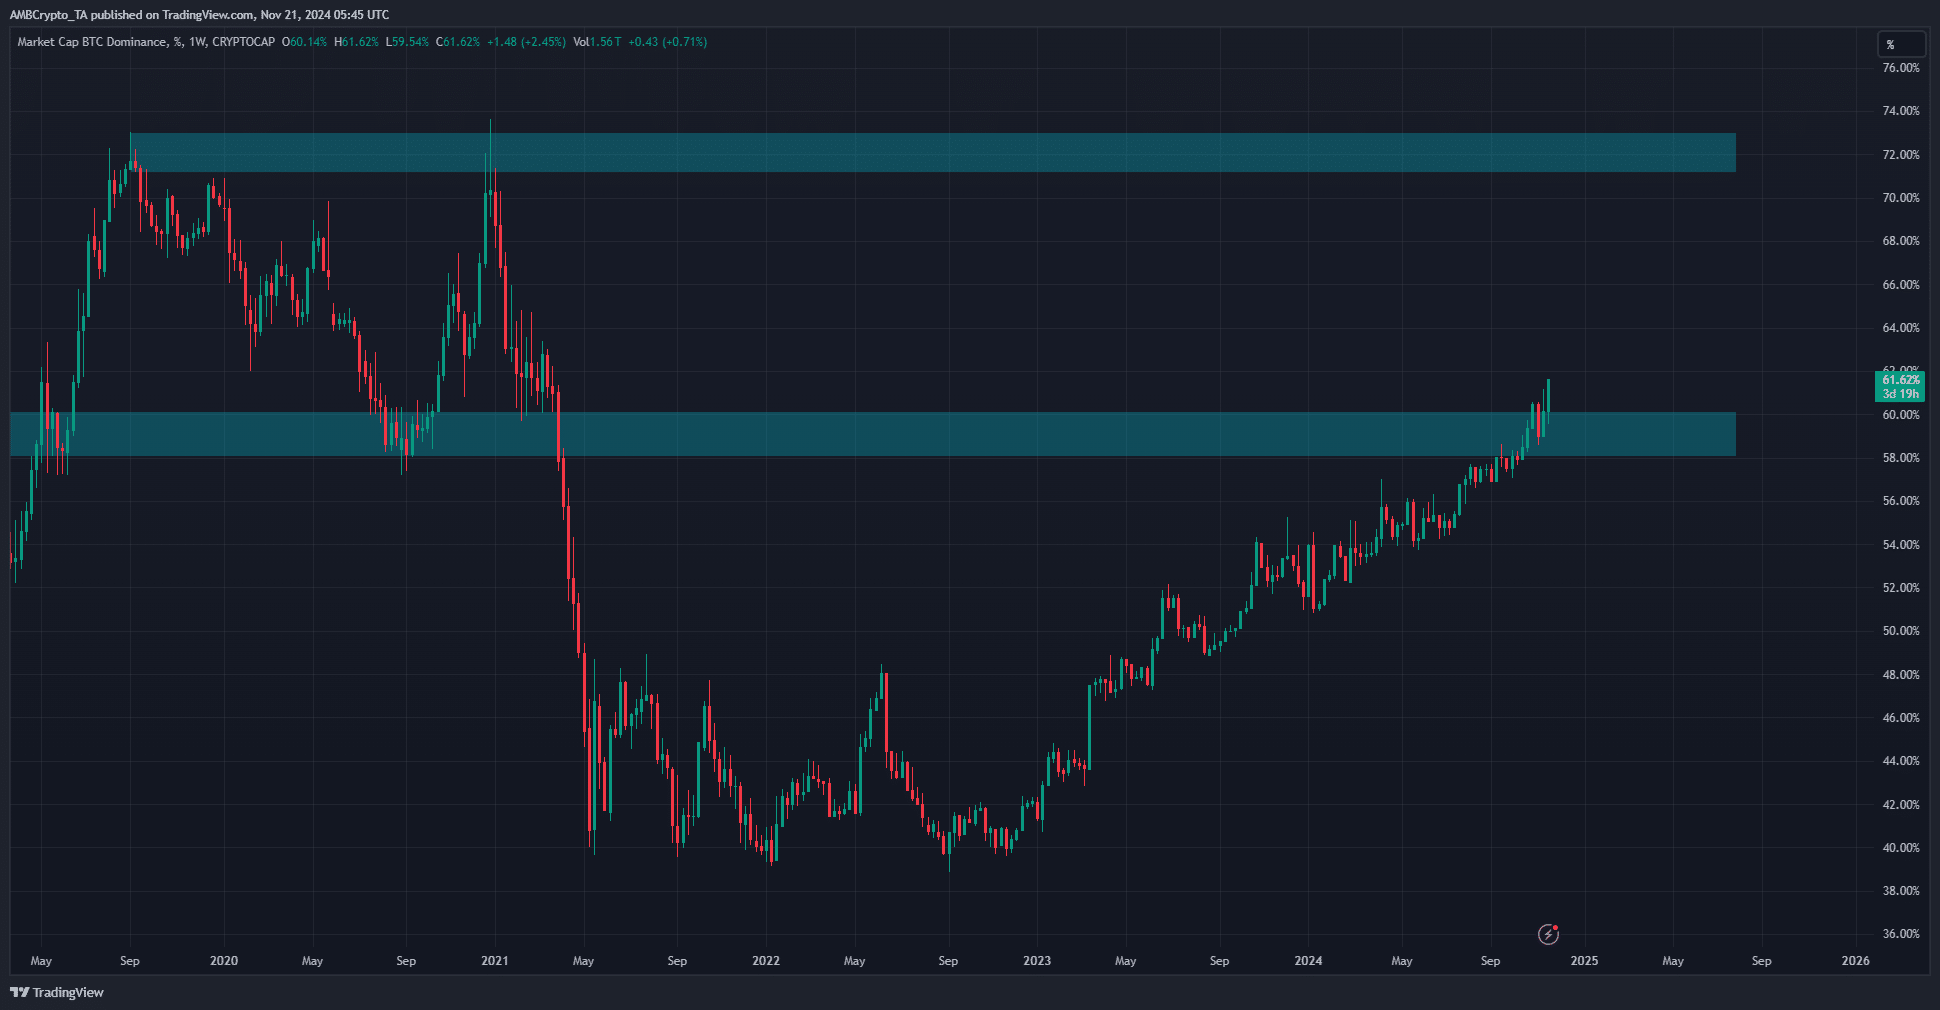
The Bitcoin [BTC] Dominance Chart has surpassed the 60% resistance zone for the first time since May 2021. It has continued higher on the weekly chart as the price of Bitcoin approaches $100k.
More gains for BTC and a rising BTC.D is a good outcome- the higher the BTC.D goes, the stronger a potential altseason would be.
GOON recovering from deep retracement
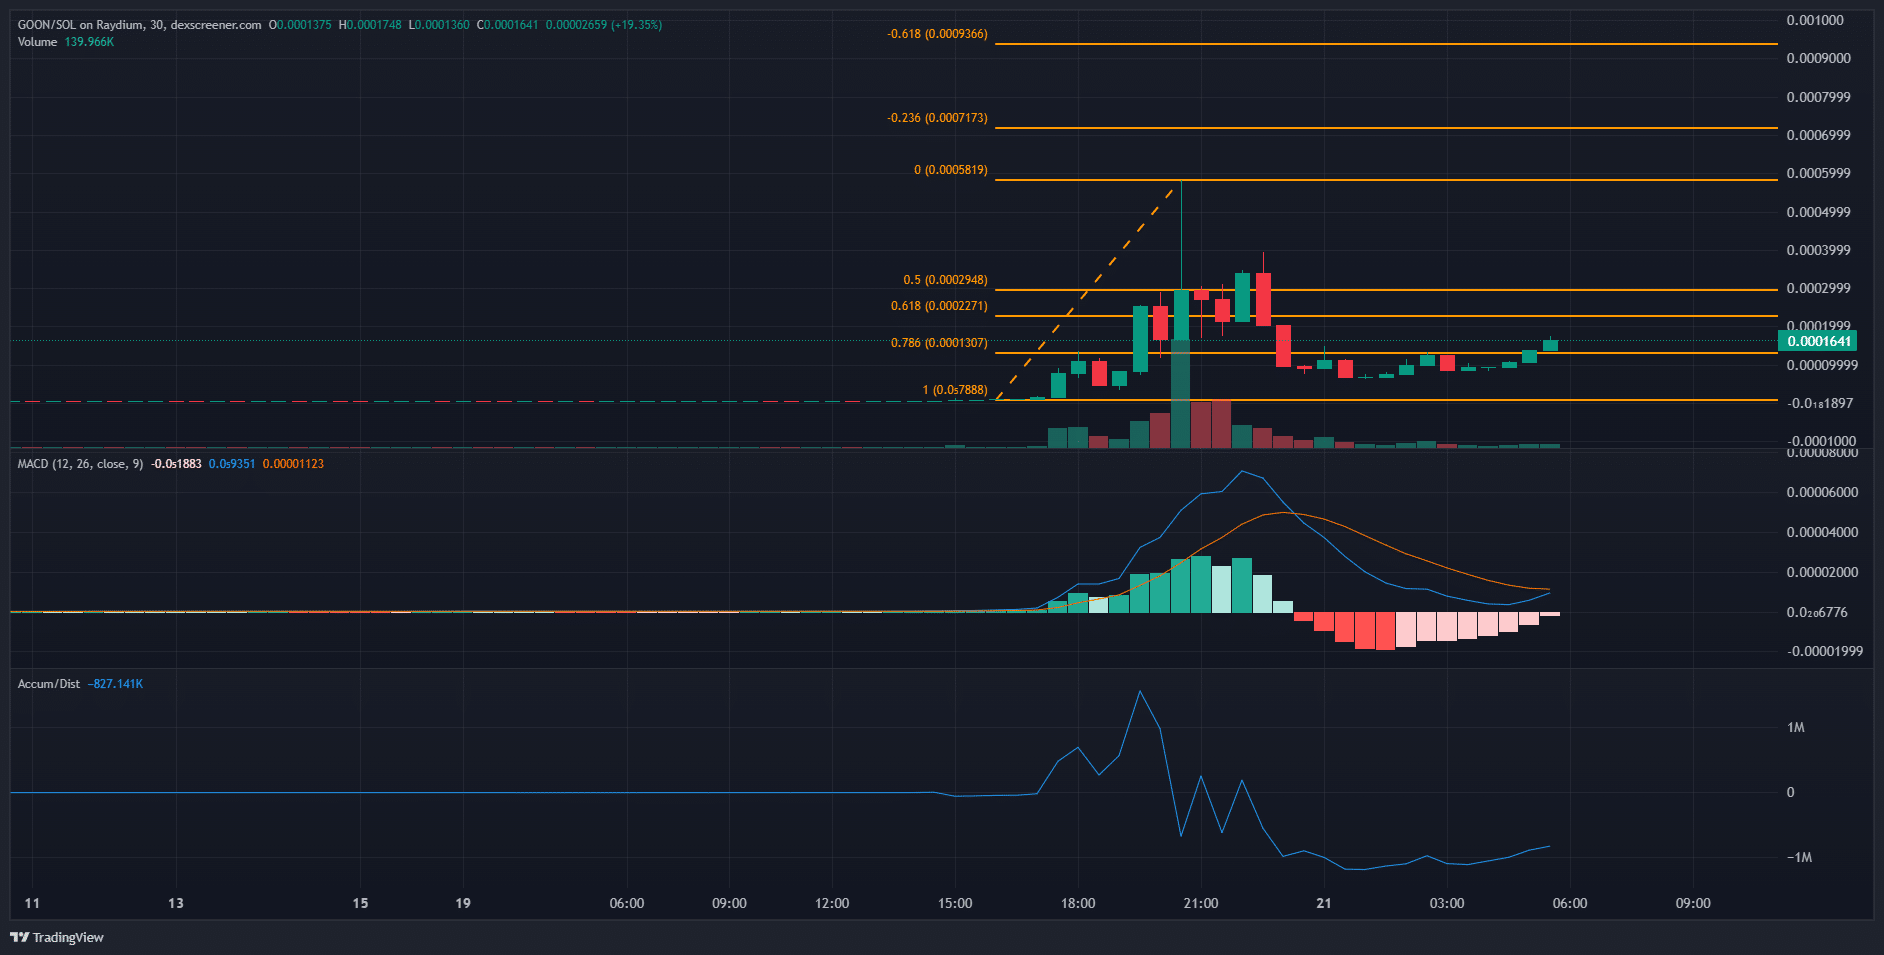
On the 20th of November, the price of GOON soared from $0.00788 to $0.581 (values multiplied by 1000 for legibility). This represented a 5,974% gain within five hours. A set of Fibonacci retracement levels were plotted based on the move.
They highlighted the $0.1307 level as a key support, being the 78.6% retracement level. However, GOON crypto went lower, reaching the $0.0615 level on the 21st of November before recovering.
Realistic or not, here’s GOON’s market cap in BTC’s terms
The MACD on the 30-minute chart was on the verge of forming another bullish crossover above the zero line. This would signal a strong bullish impetus.
The A/D indicator has fallen lower despite the recent gains, suggesting that there was a lack of sustained demand.
Disclaimer: The information presented does not constitute financial, investment, trading, or other types of advice and is solely the writer’s opinion.