GRAM crypto tests KEY support – Why a drop below $0.98 matters
The Gram rally earlier this month after the token was said to be "undervalued" was immediately sold off, reinforcing bearish strength.



Gram [GRAM] fell by 5.28% on Wednesday, the 18th of October. On the same day, Bitcoin [BTC] faced a 2.89% slide, while the cumulative altcoin market cap dipped by 1.62%.
Could the token be a buying opportunity after the recent volatility, or should traders maintain their bearish bias?
The bullish GRAM trap explored
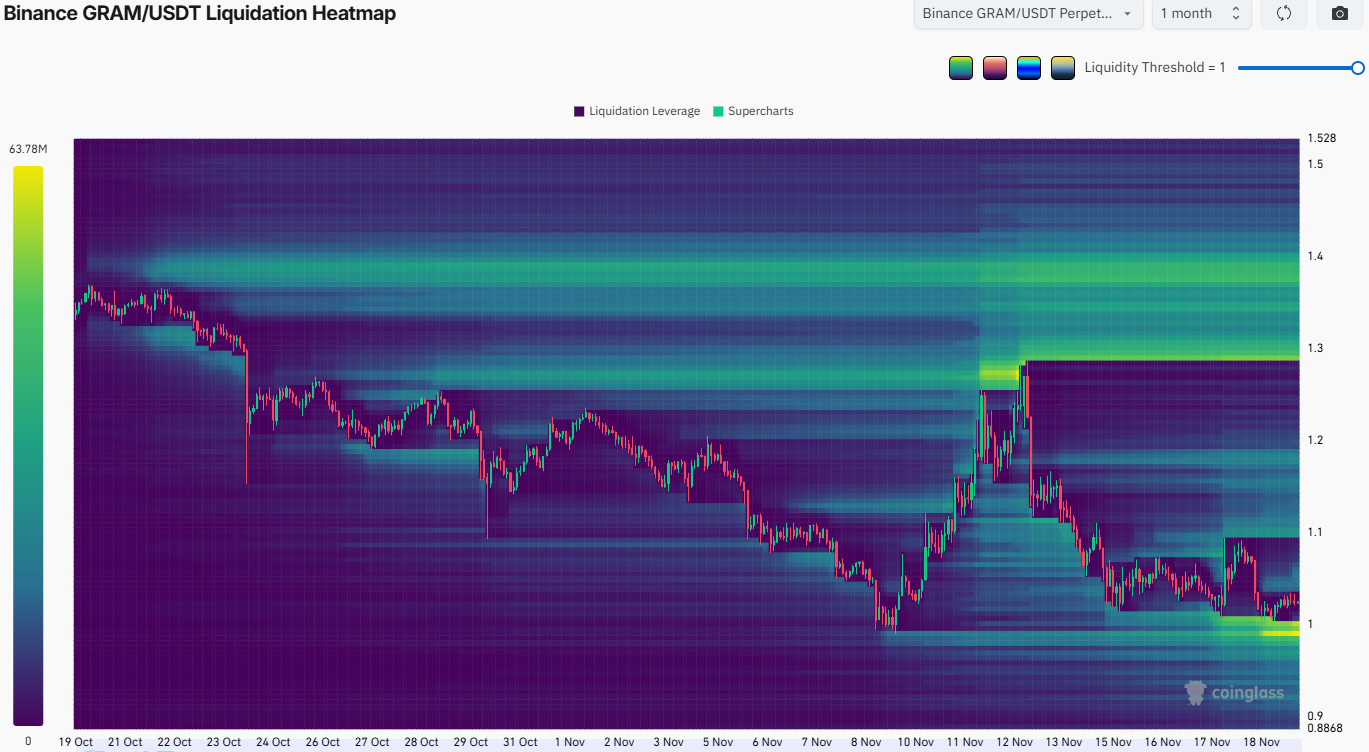
The 1-month liquidation heatmap for the altcoin presented an interesting situation for traders. Earlier this month, GRAM had rallied to $1.27 as Telegram founder Pavel Durov called the token “ridiculously undervalued.
This rally left behind magnetic zones to either side of the move. The $1 is a psychologically important level that has technical confluence with the rally’s floor.
The liquidity just under this psychological level was likely to pull prices lower. After a sweep of this magnetic zone, a return to the $1.27-$1.30 range appeared possible.
Yet, the price trend in place for GRAM meant such a swing buy trade might not be feasible.
Ranges and liquidity sweeps for GRAM traders to watch
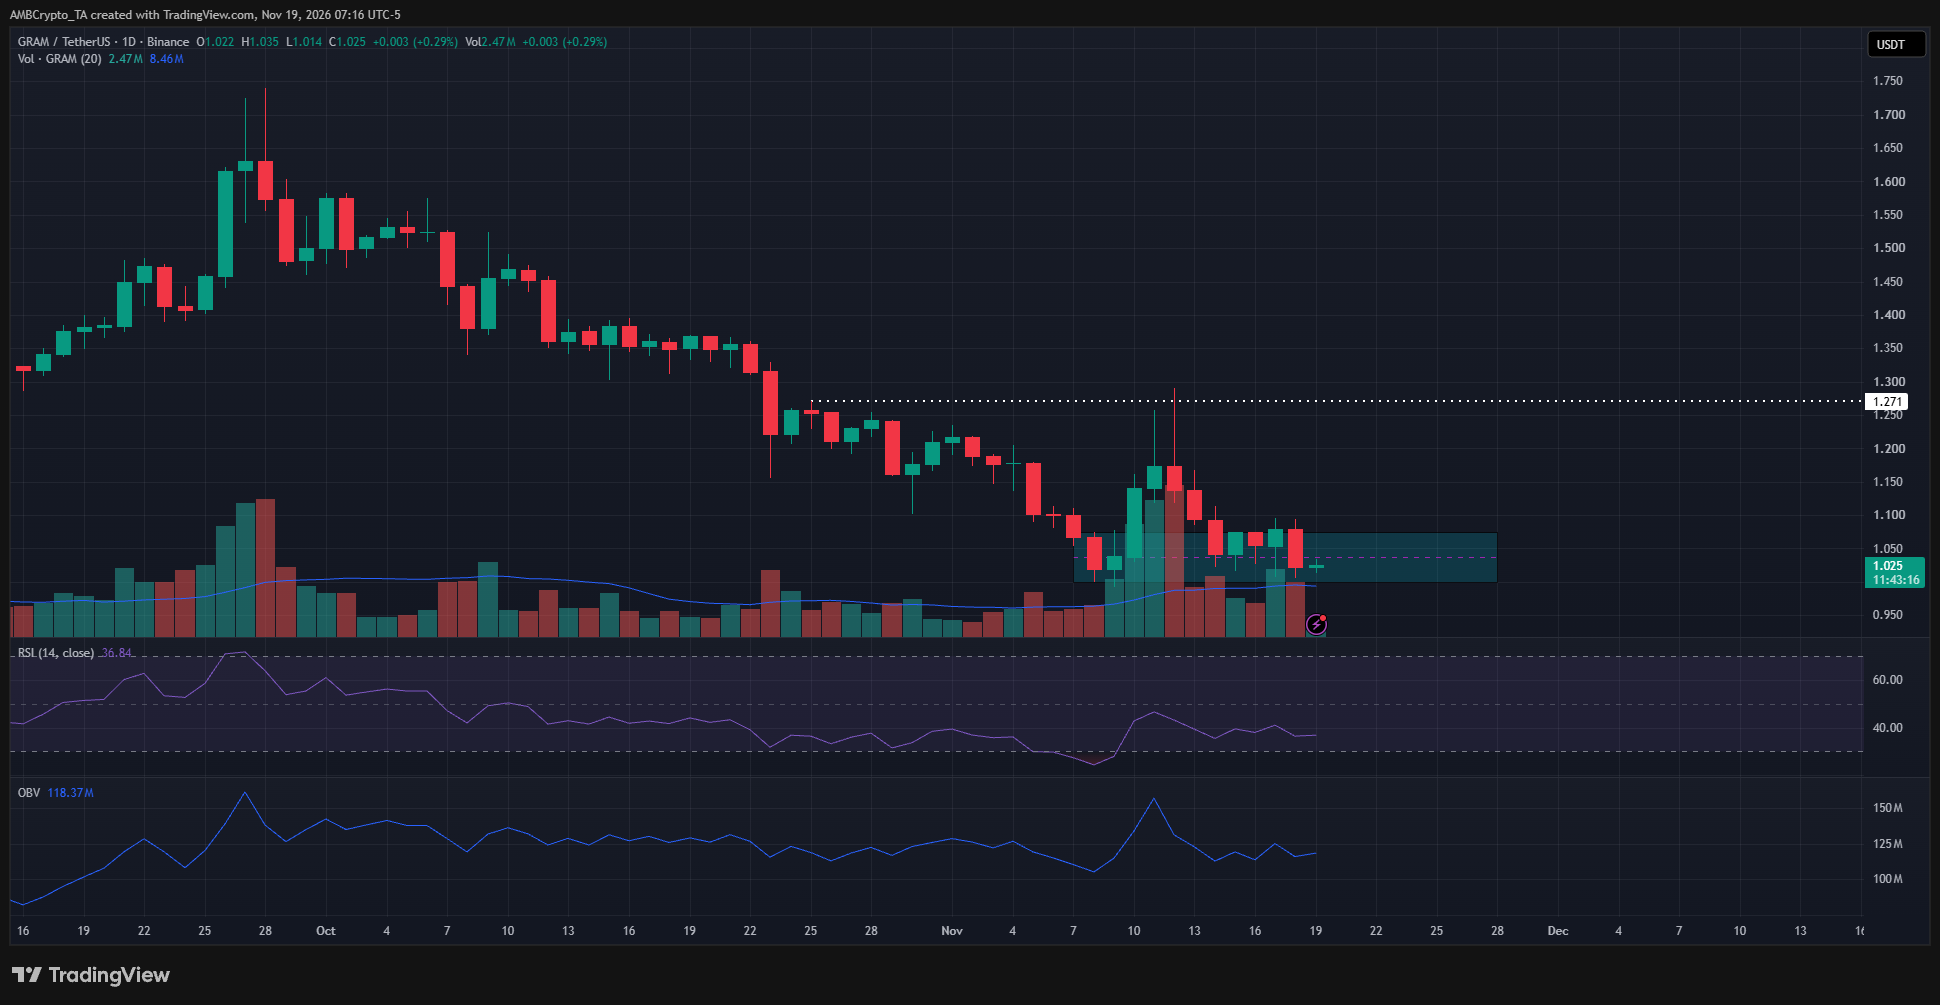
On the daily timeframe, the rally earlier this month swept the $1.27 high from October. The immediate rejection showed the sellers had the upper hand.
The daily RSI has also remained below neutral 50 for over a month, reinforcing that bearish momentum was prevalent. The $1.00-$1.07 area was a local demand zone to watch, and the OBV’s upcoming trends could give clues on the next price move’s direction.
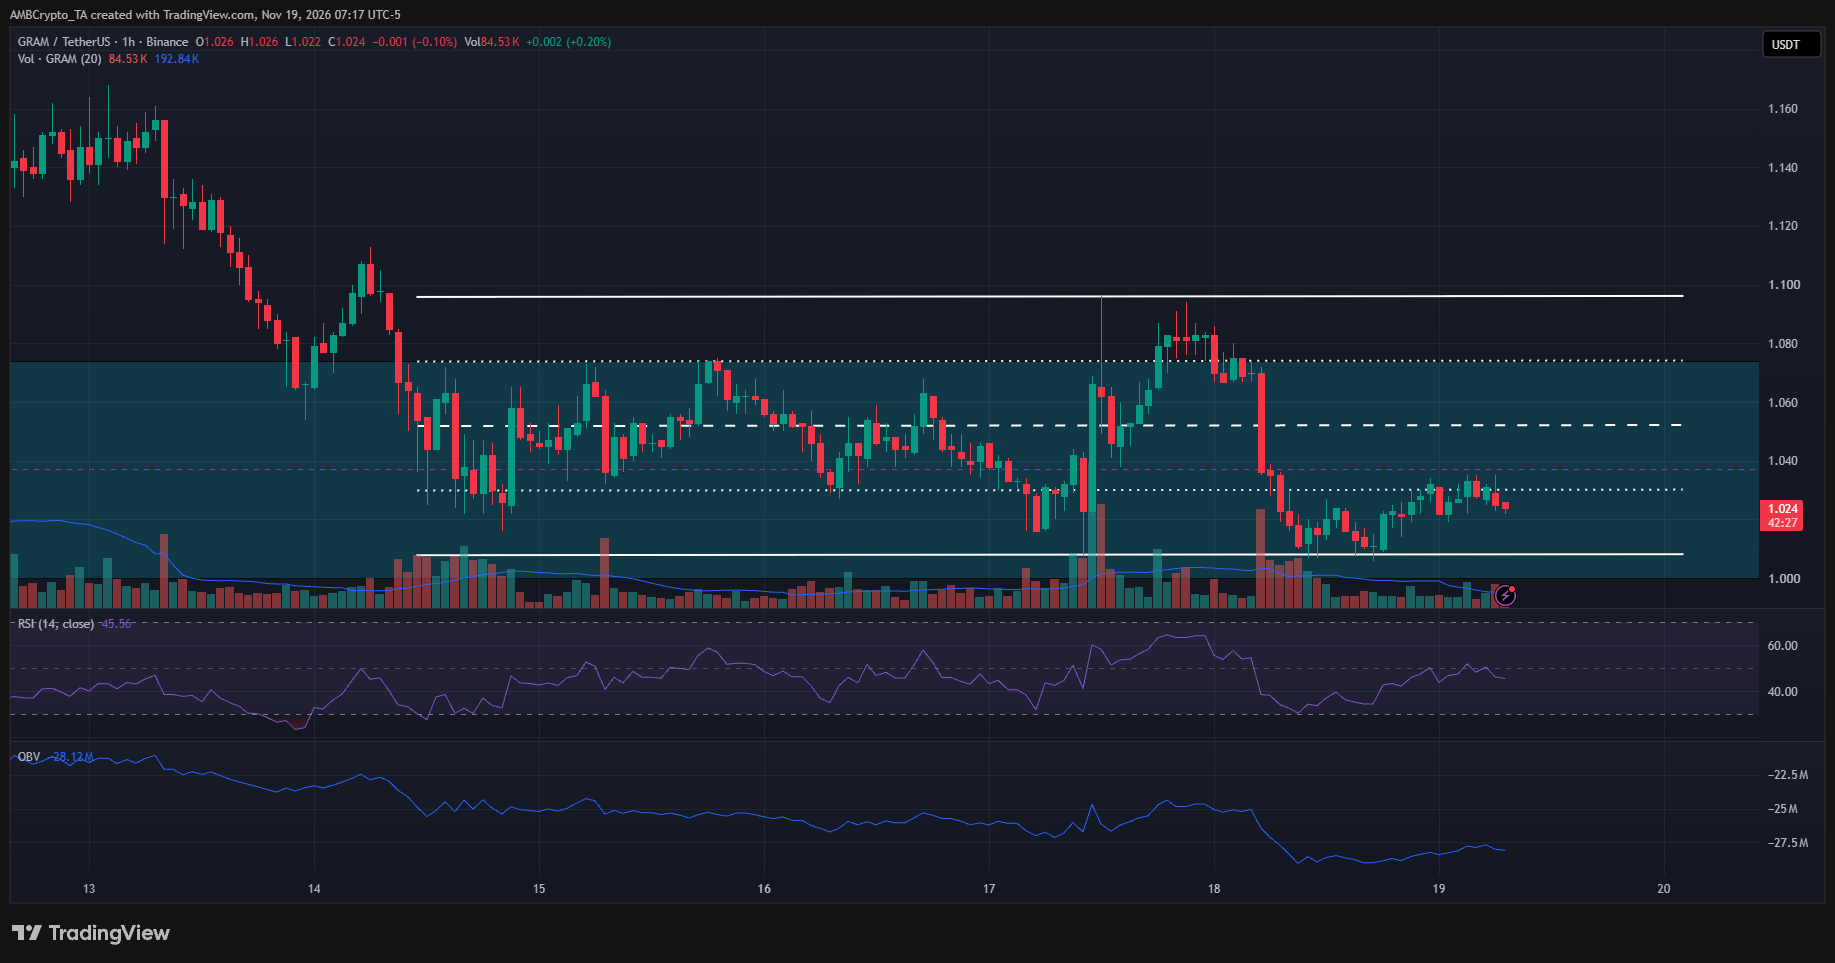
The 1-hour chart showed a short-term range formation between $1.00 and $1.09, with the mid-range level at $1.045. At the time of writing, the price was within the lower bounds of the range.
As things stand, traders can look to buy at $1. A price drop below $0.978 would be a warning sign that bears were forcing a breakdown, and could invalidate the short-term range-low buying opportunity, which is risky given the higher timeframe trend.
A bounce toward $1.045-$1.09, or a breakdown below $0.98, might offer a more likely trading opportunity for sellers looking to enter.
Final Summary
- The Gram rally earlier this month after the token was said to be “undervalued” was immediately sold off.
- The price action showed a short-term range, but the sellers have the advantage, and buying here could be risky.