


Disclaimer: The information presented does not constitute financial, investment, trading, or other types of advice and is solely the opinion of the writer.
Binance Coin [BNB], like every other token in the crypto market, has seen a downtrend since April. At the time, what appeared to be a bullish market structure turned out to be a bull trap that sent the coin rolling downhill. At the time of writing, Binance Coin was on the verge of a breakout. Can the bulls flip the range highs to support, or will the price descend in the days to come?
BNB- 12-Hour Chart
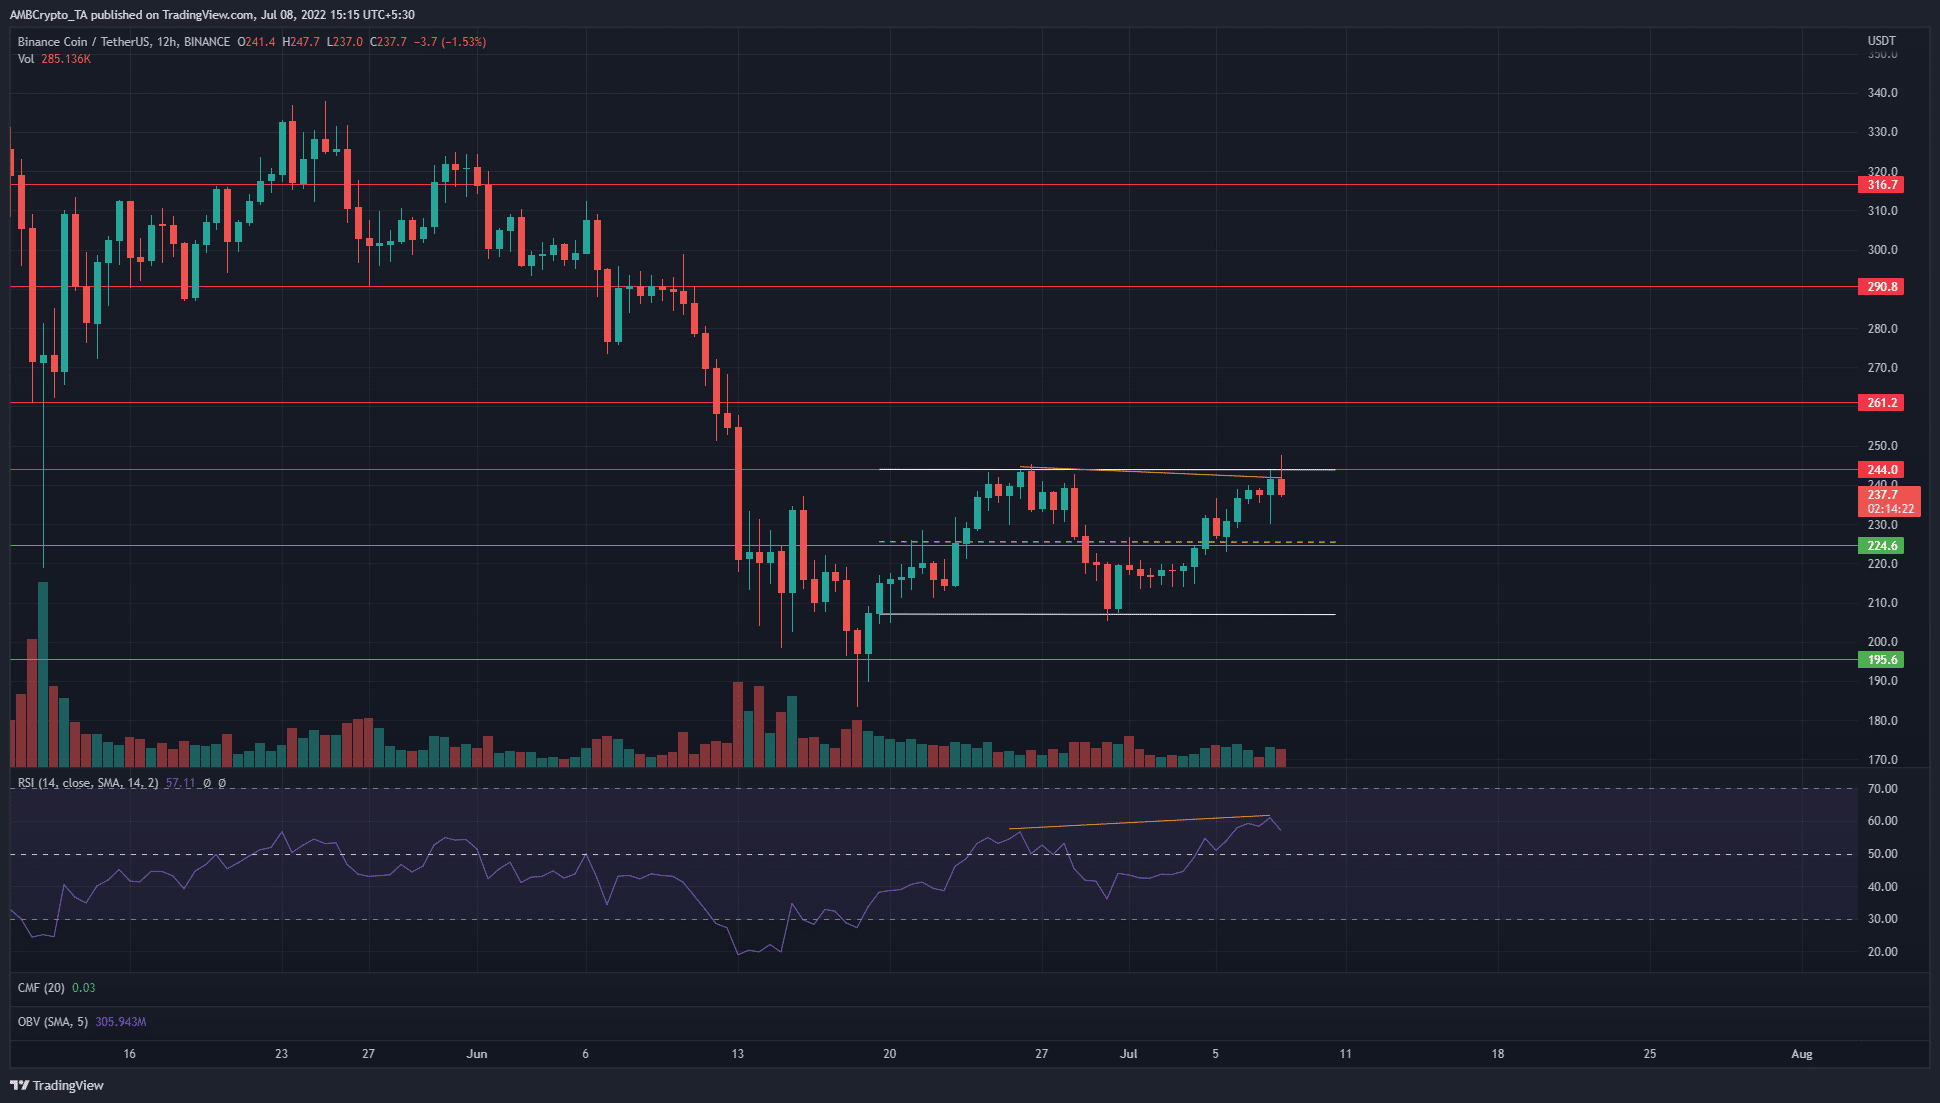
In white was highlighted a range that Binance Coin has been trading within since mid-June. The range lows and highs lie at $205 and $245, with the mid-point at $225. The mid-point had confluence with a long-term support level at $224 as well.
The Relative Strength Index (RSI) climbed past 60 in the past couple of trading sessions, to hint at strong bullish momentum. Yet, even as the RSI made a higher high, the price made a lower high. Marked in orange on the chart, this signified a hidden bearish divergence. Since the long-term trend was bearish, this could signal a move back toward the range lows for Binance Coin in the coming weeks.
BNB- 4-Hour Chart
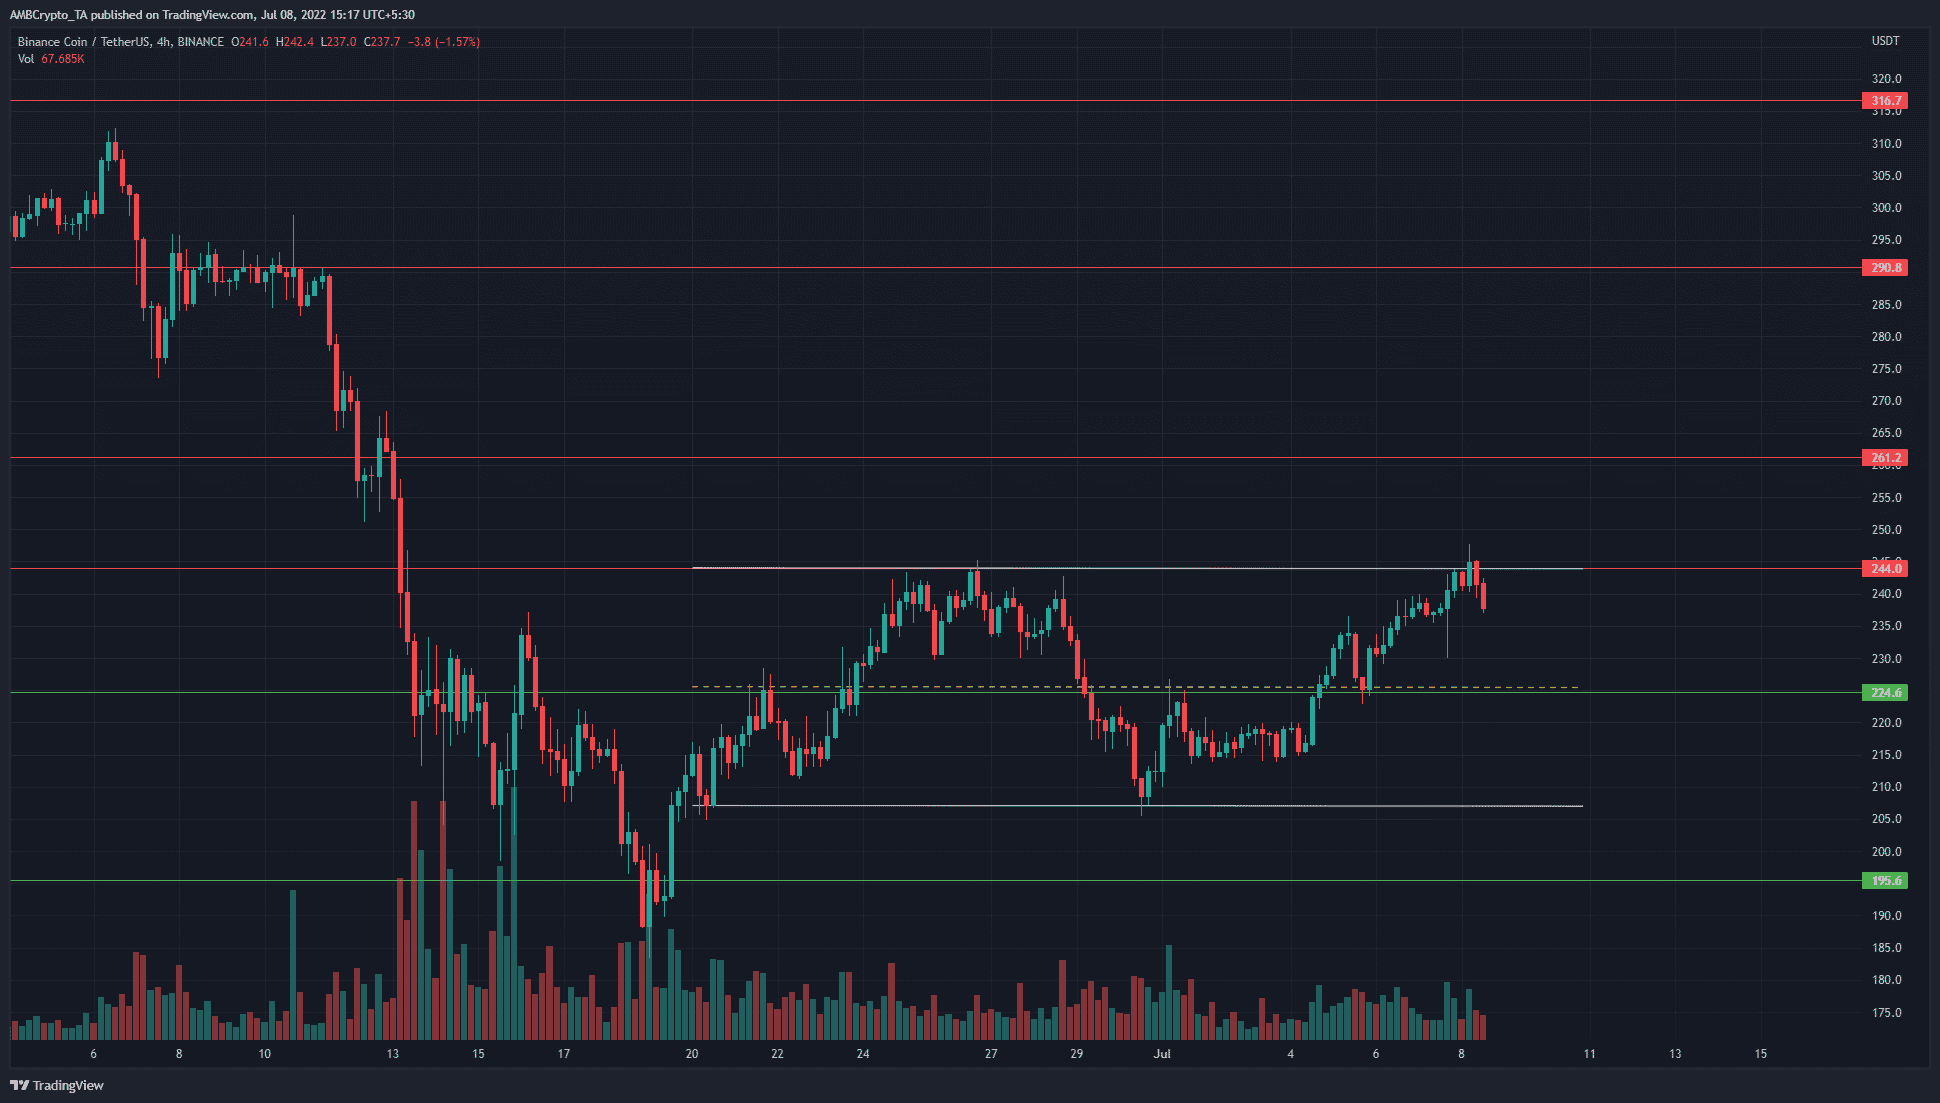
The four-hour chart showed the importance of the mid-range point in the past three weeks. At the time of writing, the price had seen a rejection at the range highs. It remained to be seen whether the bears can follow through and force Binance Coin bulls to cede the territory they fought hard to regain since late June.
Another factor to note was the lack of trading volume in recent weeks- the trading volume was rather flat. Once again this demonstrated the lack of a strong trend and reinforced the idea of a range formation.
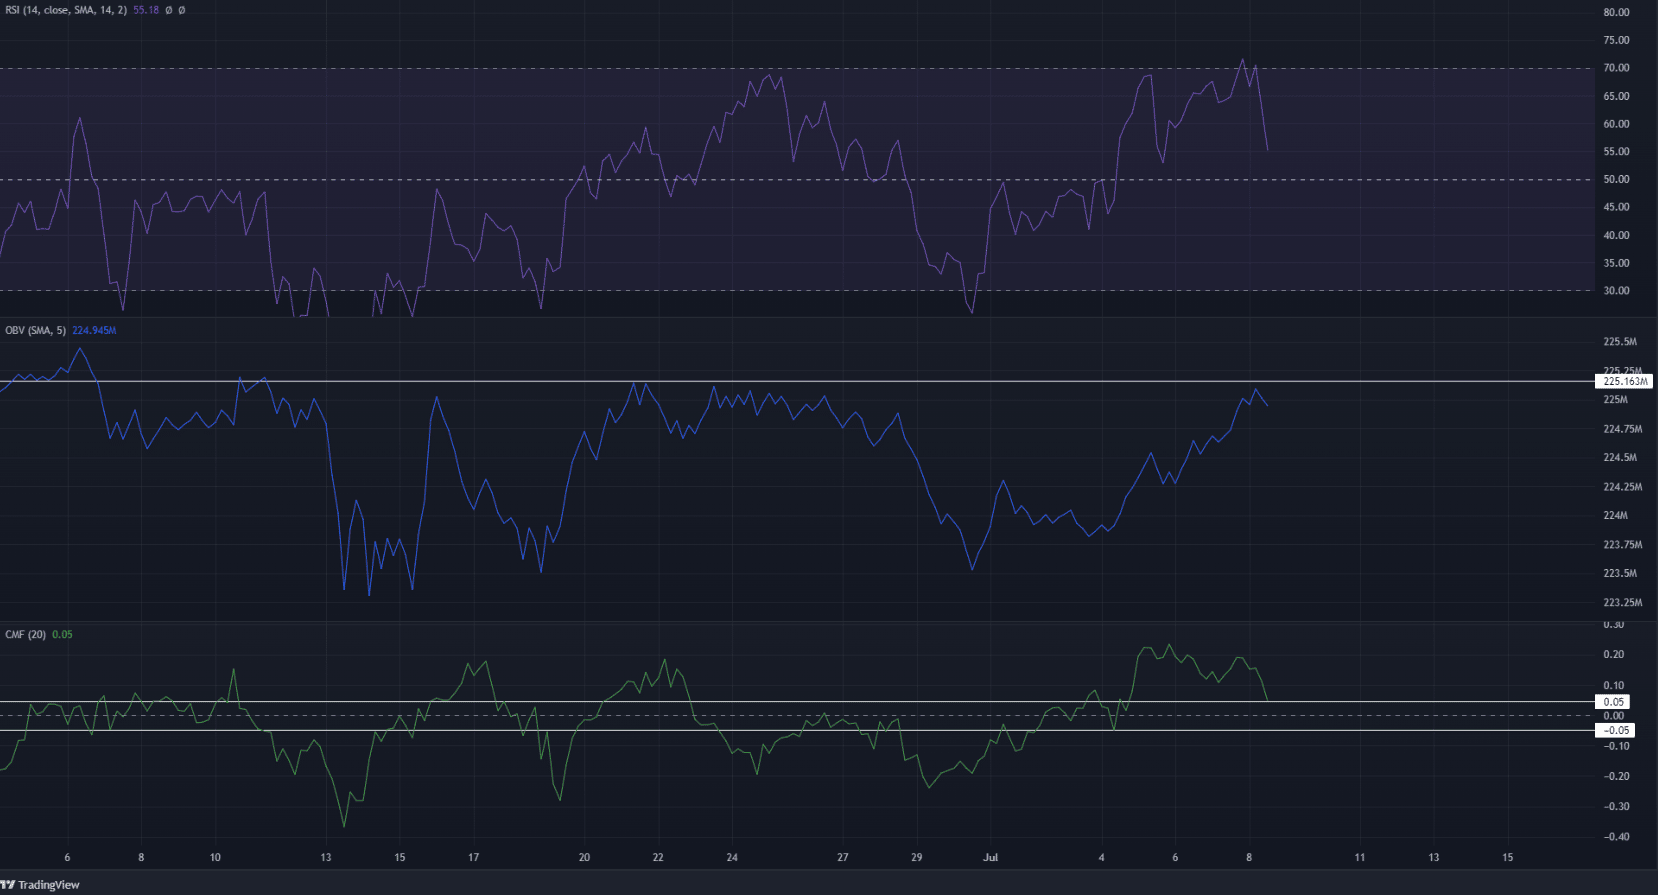
The RSI was at 55 and looked to be headed lower. Hence, although momentum was bullish, a steady trend was not yet established. The On-Balance Volume (OBV) was also yet to rise above a resistance level from June. There was a notable lack of buying volume in the market, hence a push past $245 might not materialize.
The Chaikin Money Flow (CMI) also dropped over the past few days, to point out the weakening buying pressure in the market behind Binance Coin.
Conclusion
The OBV was at resistance on the four-hour chart, while the 12-hour RSI showed a hidden bearish divergence developing. While a breakout from the range can not be ruled out, the price action and the indicators overwhelmingly pointed toward a rejection at the range highs. If the Binance Coin bulls can defend the $225 area and consolidate, the next attempt at breaching the range could have more hopes of success.