


Bitcoin [BTC] could trend even lower as market dynamics keep the asset locked in a range between $59,000 and $63,000.
Momentum behind any rebound remains weak, and fresh data tied to global market liquidity warns that Bitcoin may slip further before it carves out a bottom and stages a strong bullish recovery.
Bitcoin-to-global M2 ratio points to more downside
Data from Alphractal shows that the Global Money Supply (M2) can serve as a useful indicator for tracking BTC‘s tops and bottoms through their ratio.
M2 tracks the money supply and near‑cash assets that can be quickly converted into cash. The M2 ratio serves as a proxy for whether Bitcoin is overvalued at market tops or undervalued at market bottoms, with chart color gradients highlighting those zones.
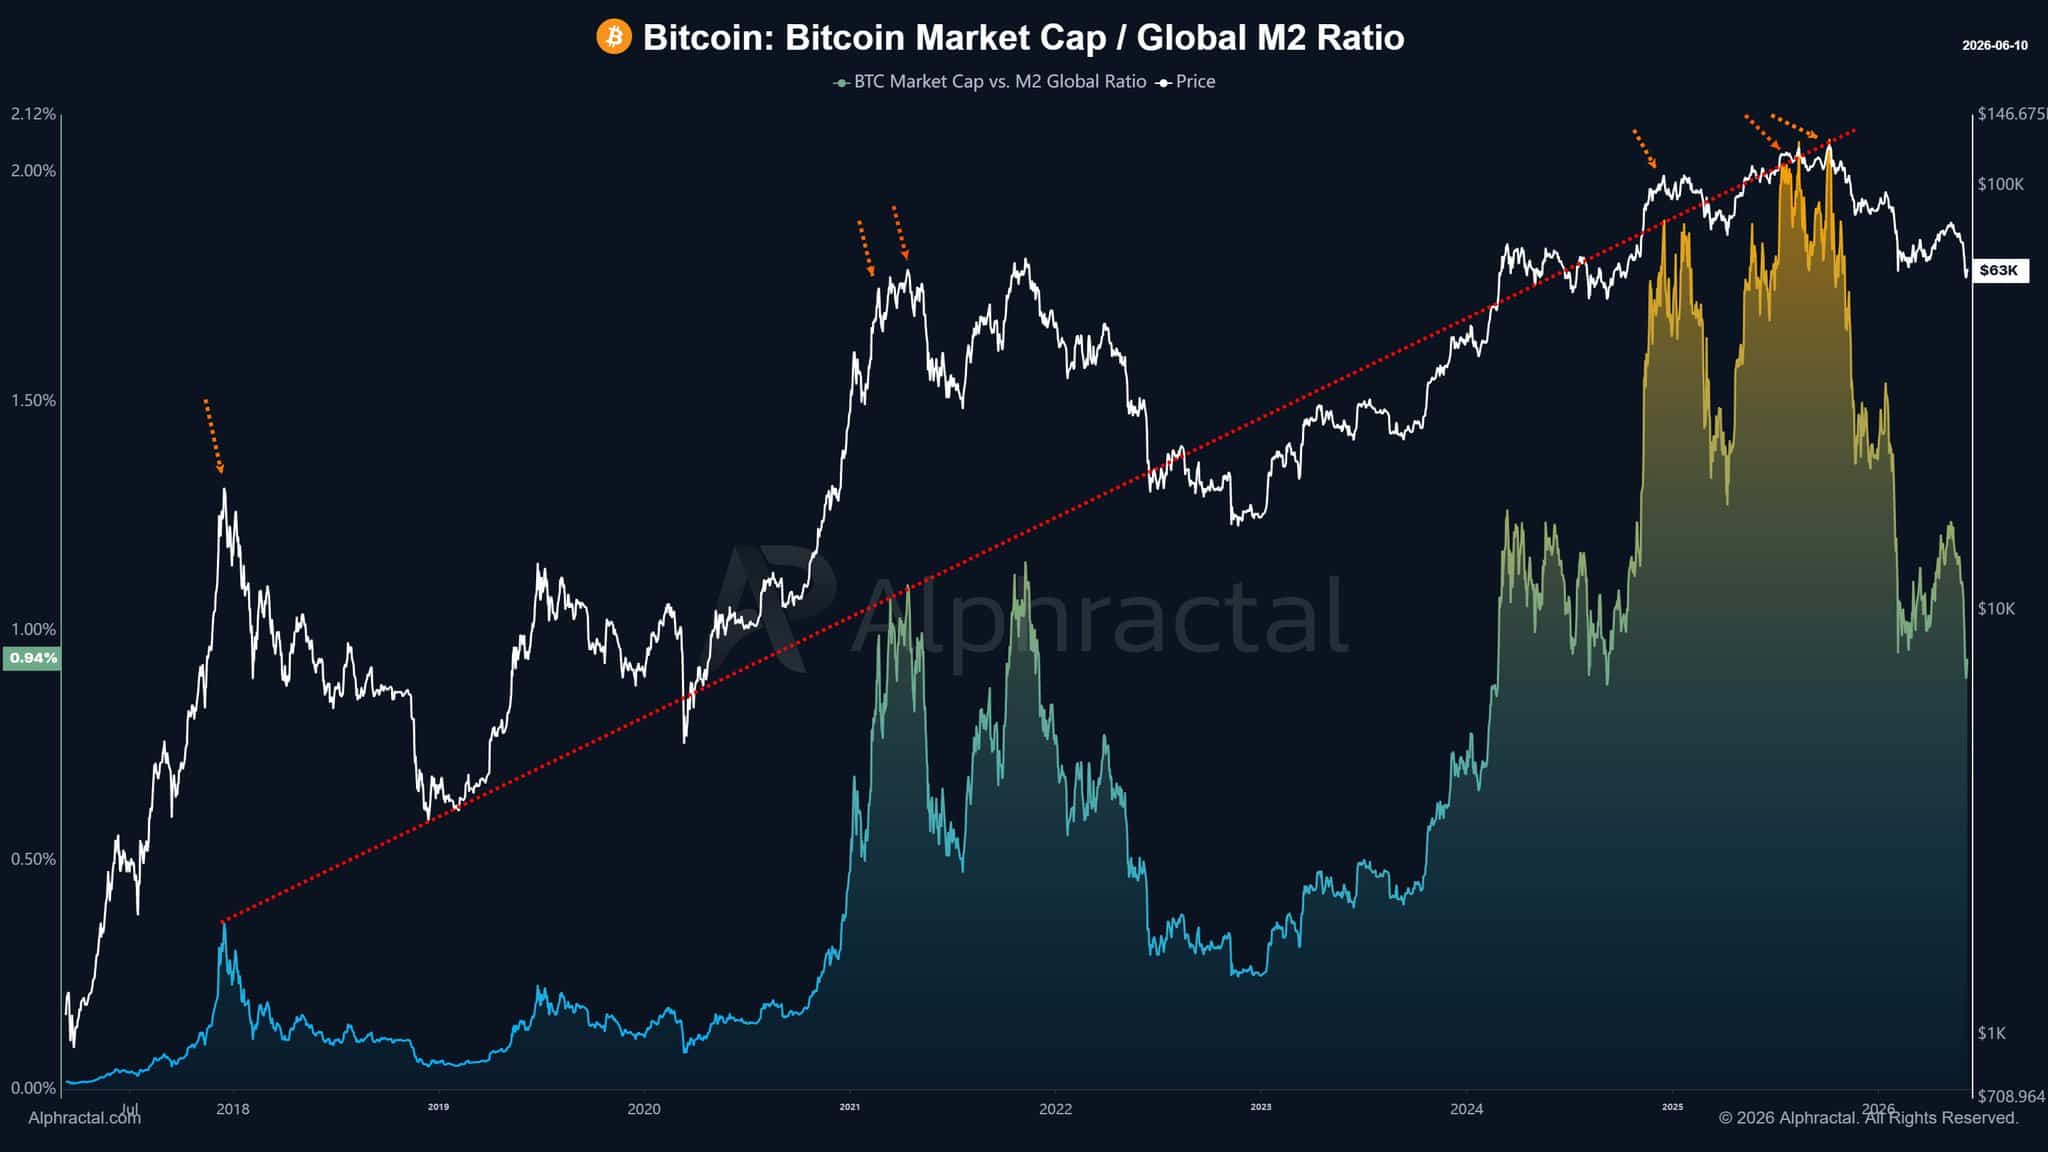
At the time of reporting, the ratio sat at 0.94%, representing Bitcoin’s market cap as a share of the global M2 supply. Although that reading is relatively low, the analysis suggests it may need to fall further into the blue region, the zone that has often marked the bottom, before global liquidity eventually rotates into risk assets.
For context, when Bitcoin’s market‑cap‑to‑global‑M2 ratio reached 2%, it marked the overheated zone on the chart, triggering the broader decline.
Five weeks of U.S. selling pressure weigh on Bitcoin
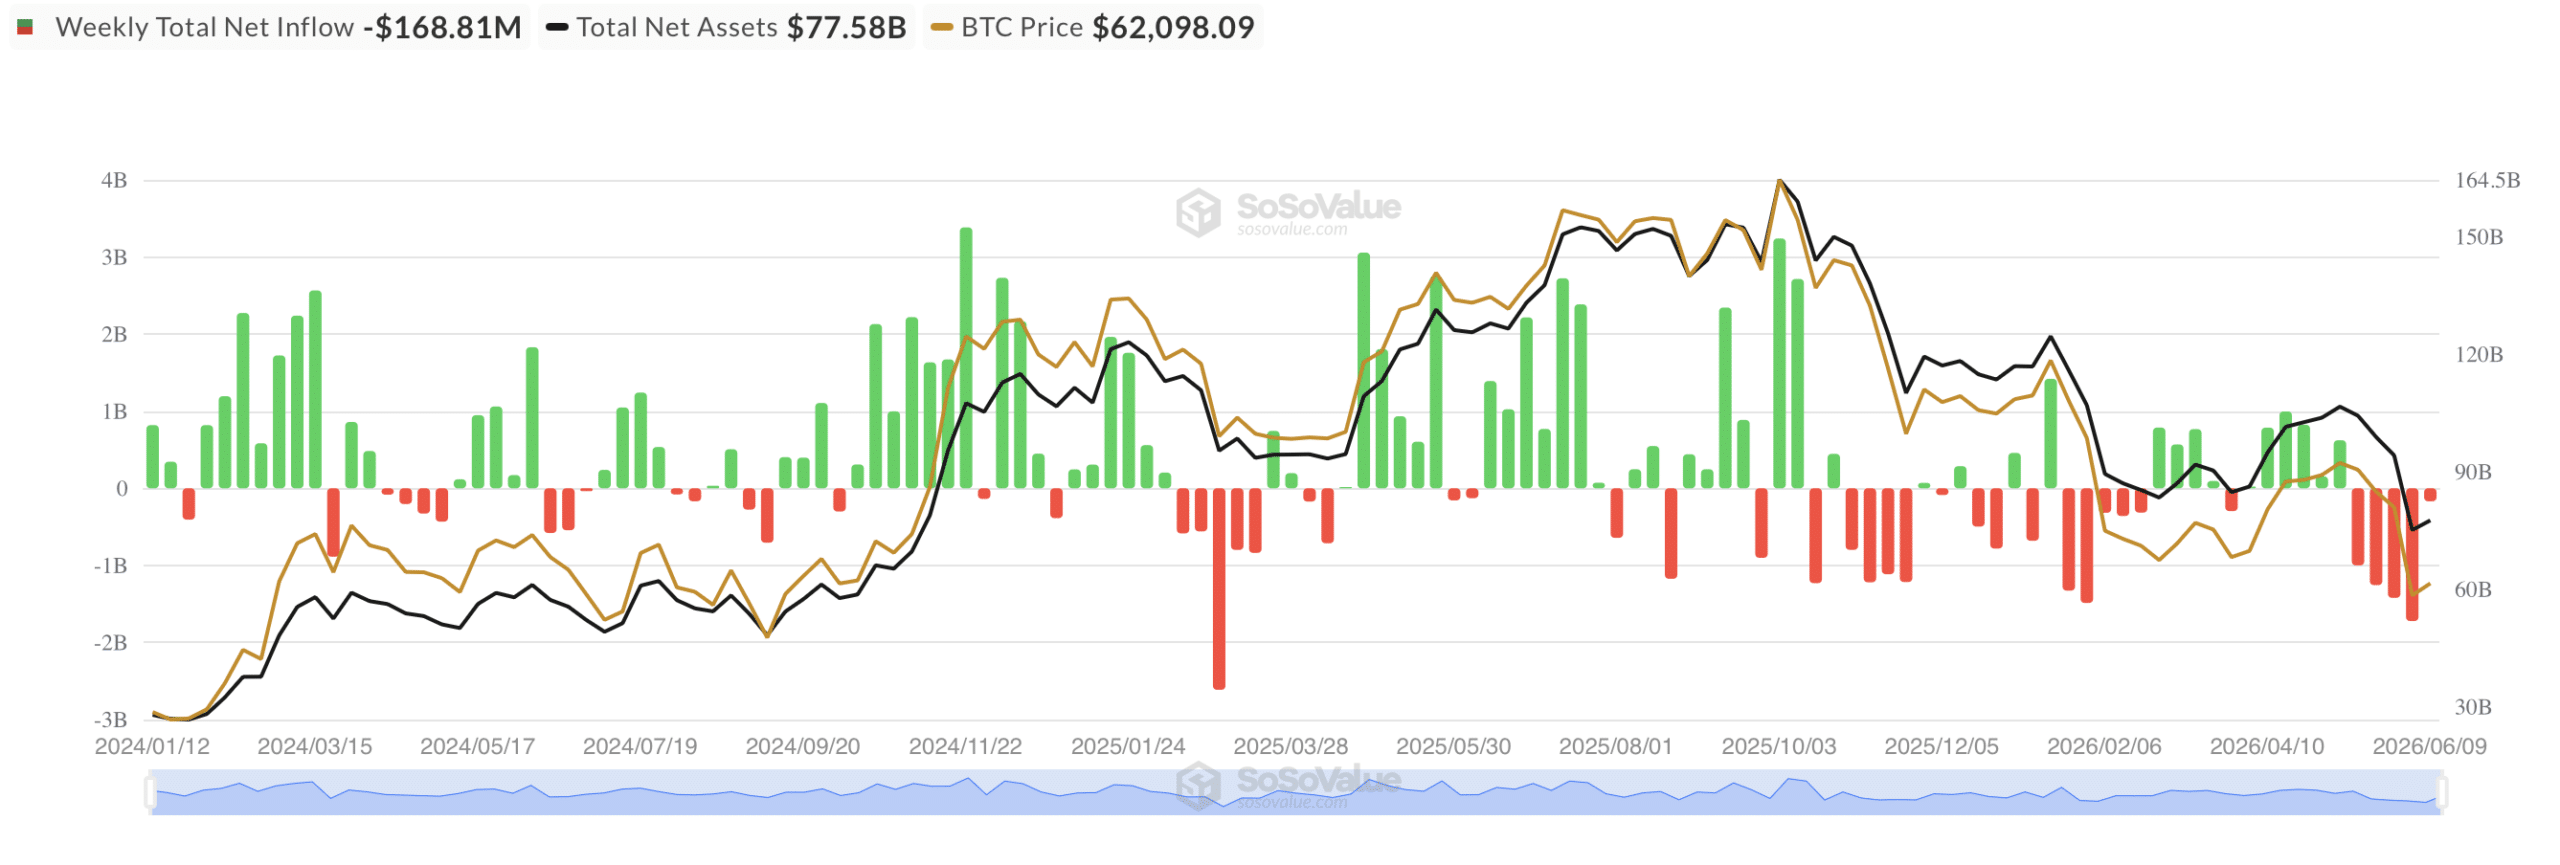
Selling pressure keeps building, with U.S. investors, key participants in the market, driving the continued sell-offs.
This group has kept offloading Bitcoin through US spot Bitcoin exchange-traded funds, with outflows reaching $5.568 billion as of this writing. When the sell-off began on May 15, Bitcoin traded at $79,146, and it has since fallen to $62,089.
The Coinbase Premium Index shows that US investors are in fact paying less for the asset than buyers on global exchanges—a sign of weakening demand.
At the time of writing, the index was at -0.07, and a further drop could signal more aggressive selling from this group, weighing on the asset’s overall performance.
Market-wide sell-off lifts exchange reserves
The concern stretches market-wide, with the broader sell-off showing up in the amount of Bitcoin now sitting in exchange reserves.
Bitcoin exchange reserves, which track the balance of Bitcoin held across centralized exchange wallets, have risen from $237.4 billion around the 15th of May , the week U.S. investors started selling, to roughly $241.4 billion at the time of writing.
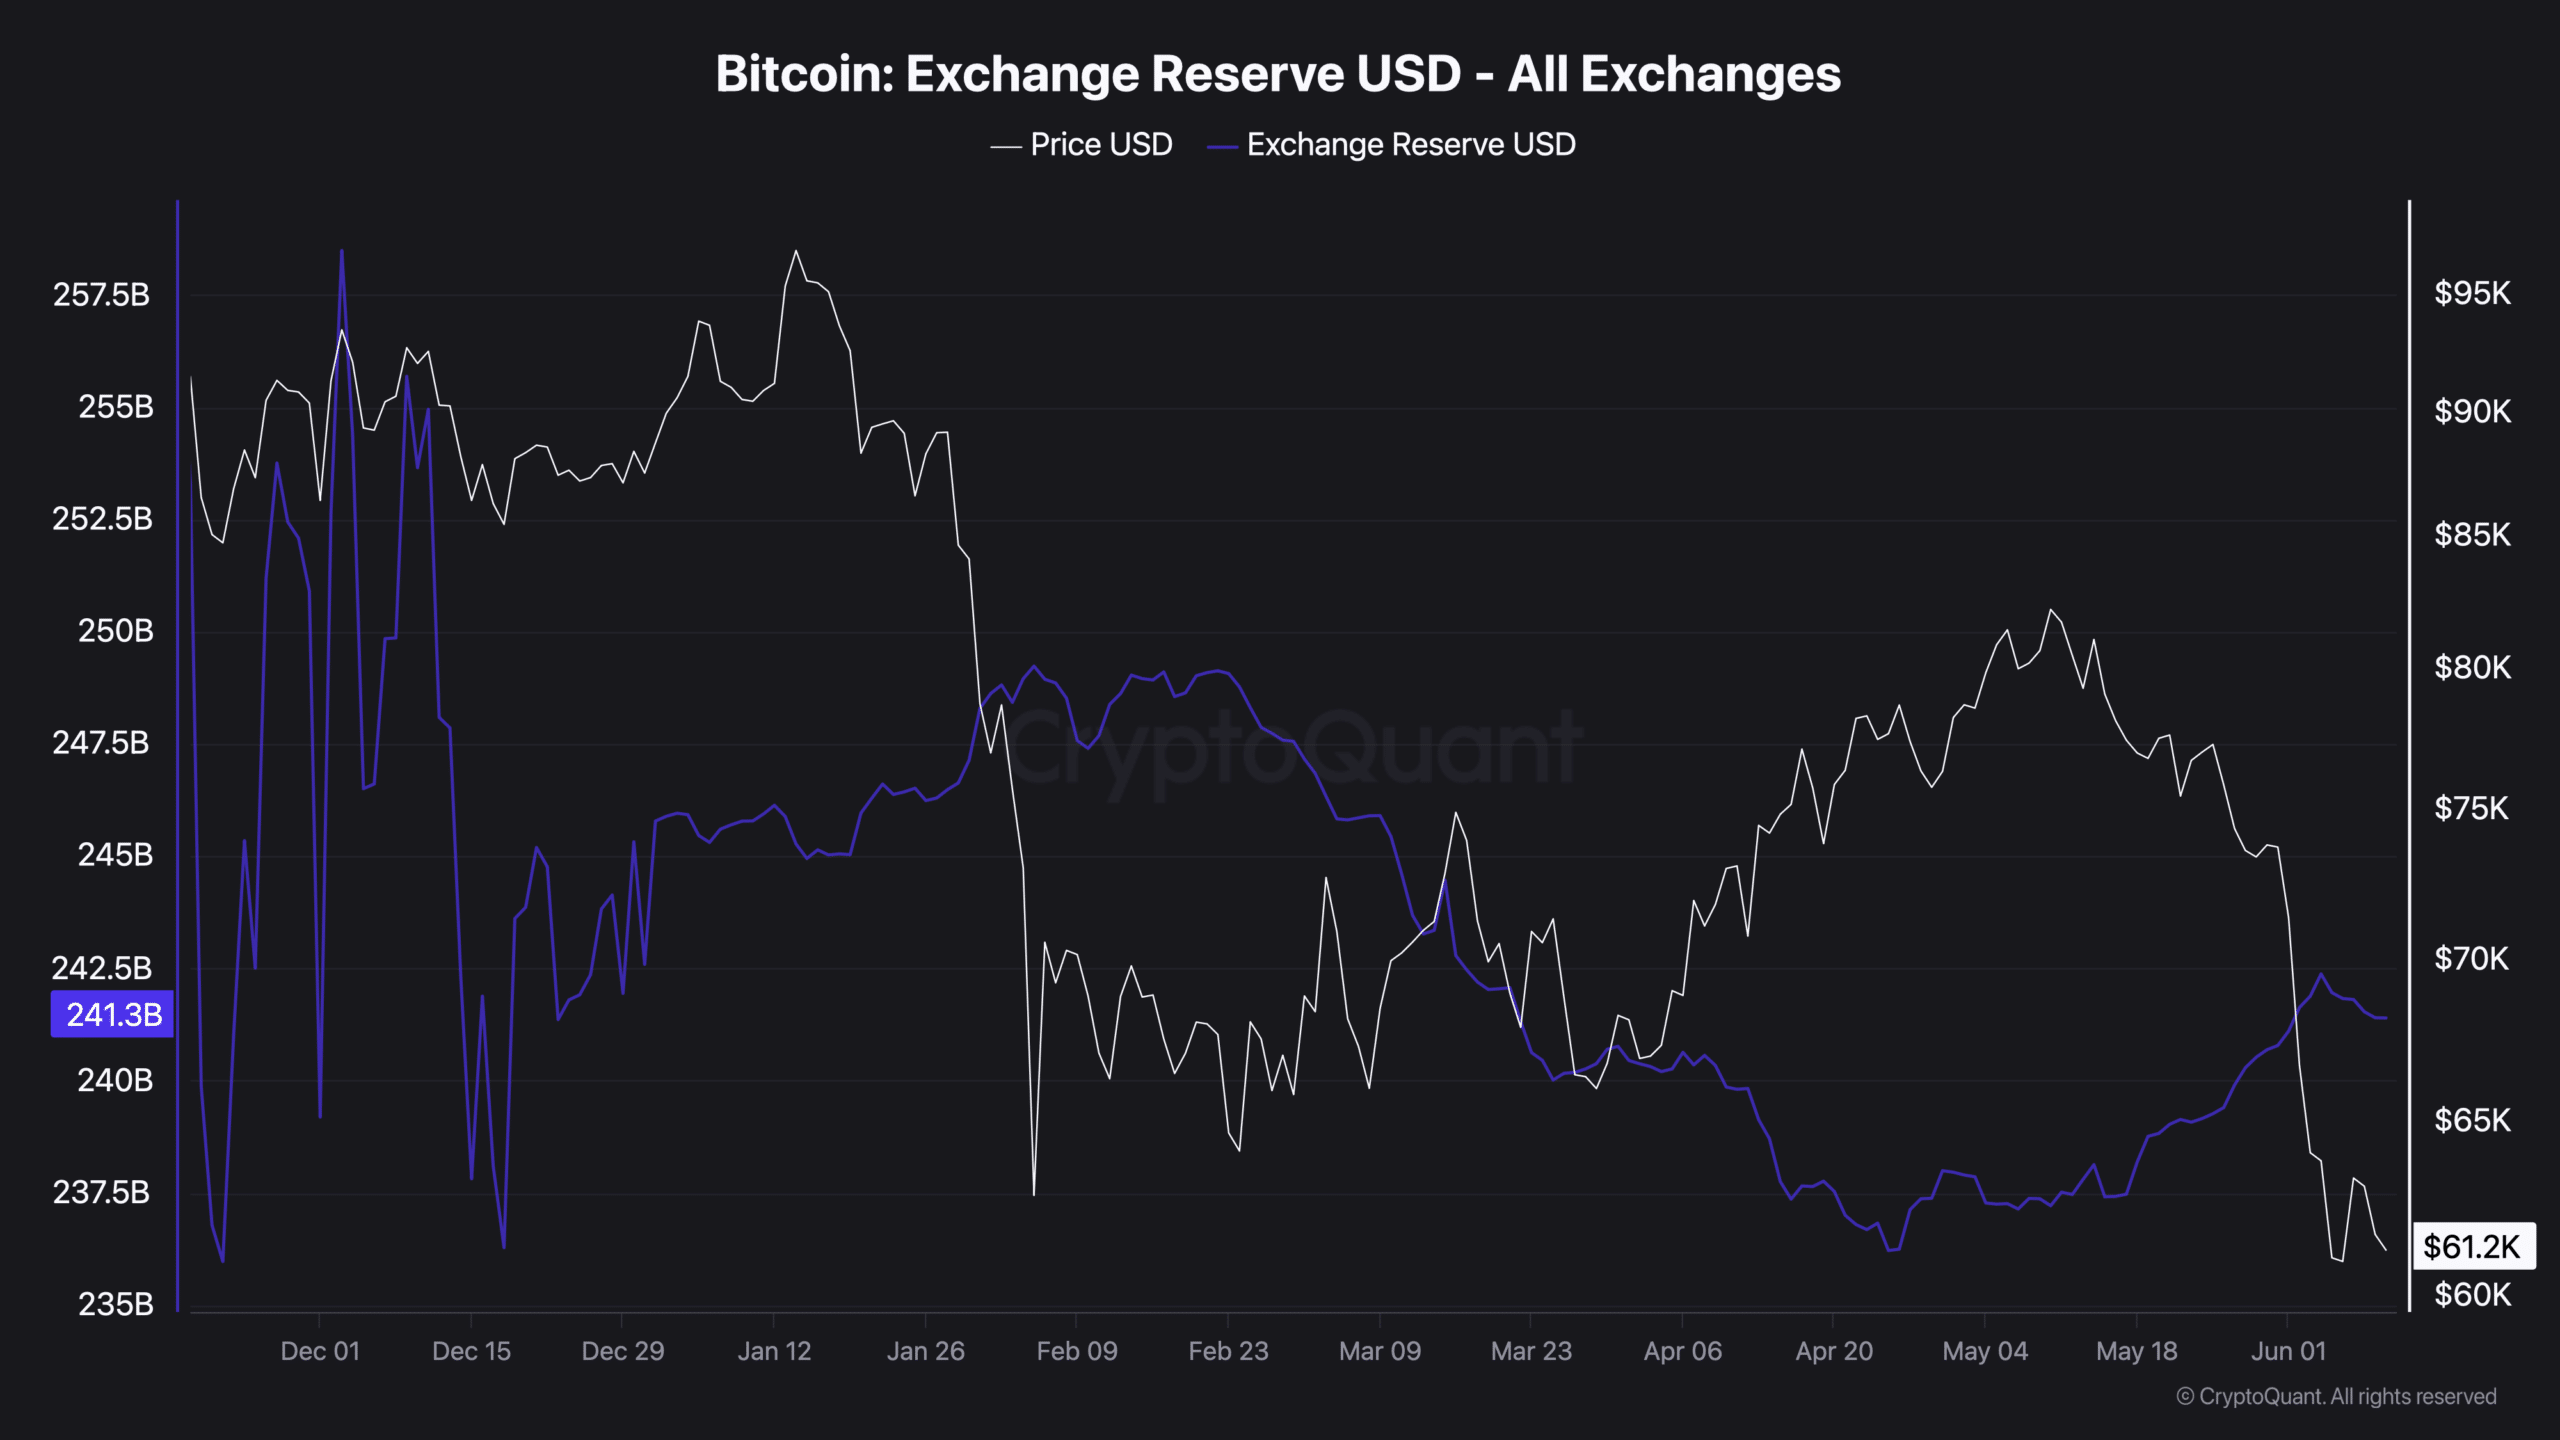
Rising exchange balances typically weigh on Bitcoin’s performance, as the additional $4 billion in BTC can be easily converted into other assets, pressuring the broader outlook.
Moreover, global economic conditions are weighing on risk assets like Bitcoin, as escalating tensions between the U.S. and Iran intensify.
Final Summary
- U.S. investors have been selling Bitcoin heavily for five weeks straight, pulling more than $5.5 billion out through US ETFs since mid-May.
- With selling pressure still building and global conditions shaky, Bitcoin may have further to fall before it finds a bottom.