
- Ethereum dropped over 55% in 14 months amid sustained sell-side pressure.
- The $1,800 support level holds despite bearish sentiment and price volatility.
Ethereum’s [ETH] descent from a $4,000 peak in February 2024 to just under $1,800 in April 2025 tells a story far deeper than a simple price crash.
There are signs the worst may be behind us
After 14 months of continuous selling pressure, Ethereum’s market appears to be nearing a turning point.
Recent CryptoQuant analysis highlights a significant bullish divergence emerging beneath the surface. Although Ethereum’s price has dropped to multi-month lows, several metrics indicate that sellers are losing momentum.
One key factor is Ethereum’s Net Taker Volume (NTV). Historically deeply negative, NTV peaked at -$360 million, reflecting intense and prolonged sell pressure. However, this pressure is now easing.
Recently, NTV has begun forming higher lows despite Ethereum’s declining price, signaling a classic bullish pattern often seen at major market inflection points.
This divergence suggests that sellers are losing control, hinting at a potential shift in market power dynamics and the possibility of a trend reversal.
Volume breakdowns only add to this evolving narrative
Between December 2024 and April 2025, Ethereum’s Taker Buy Volume saw erratic yet significant surges.
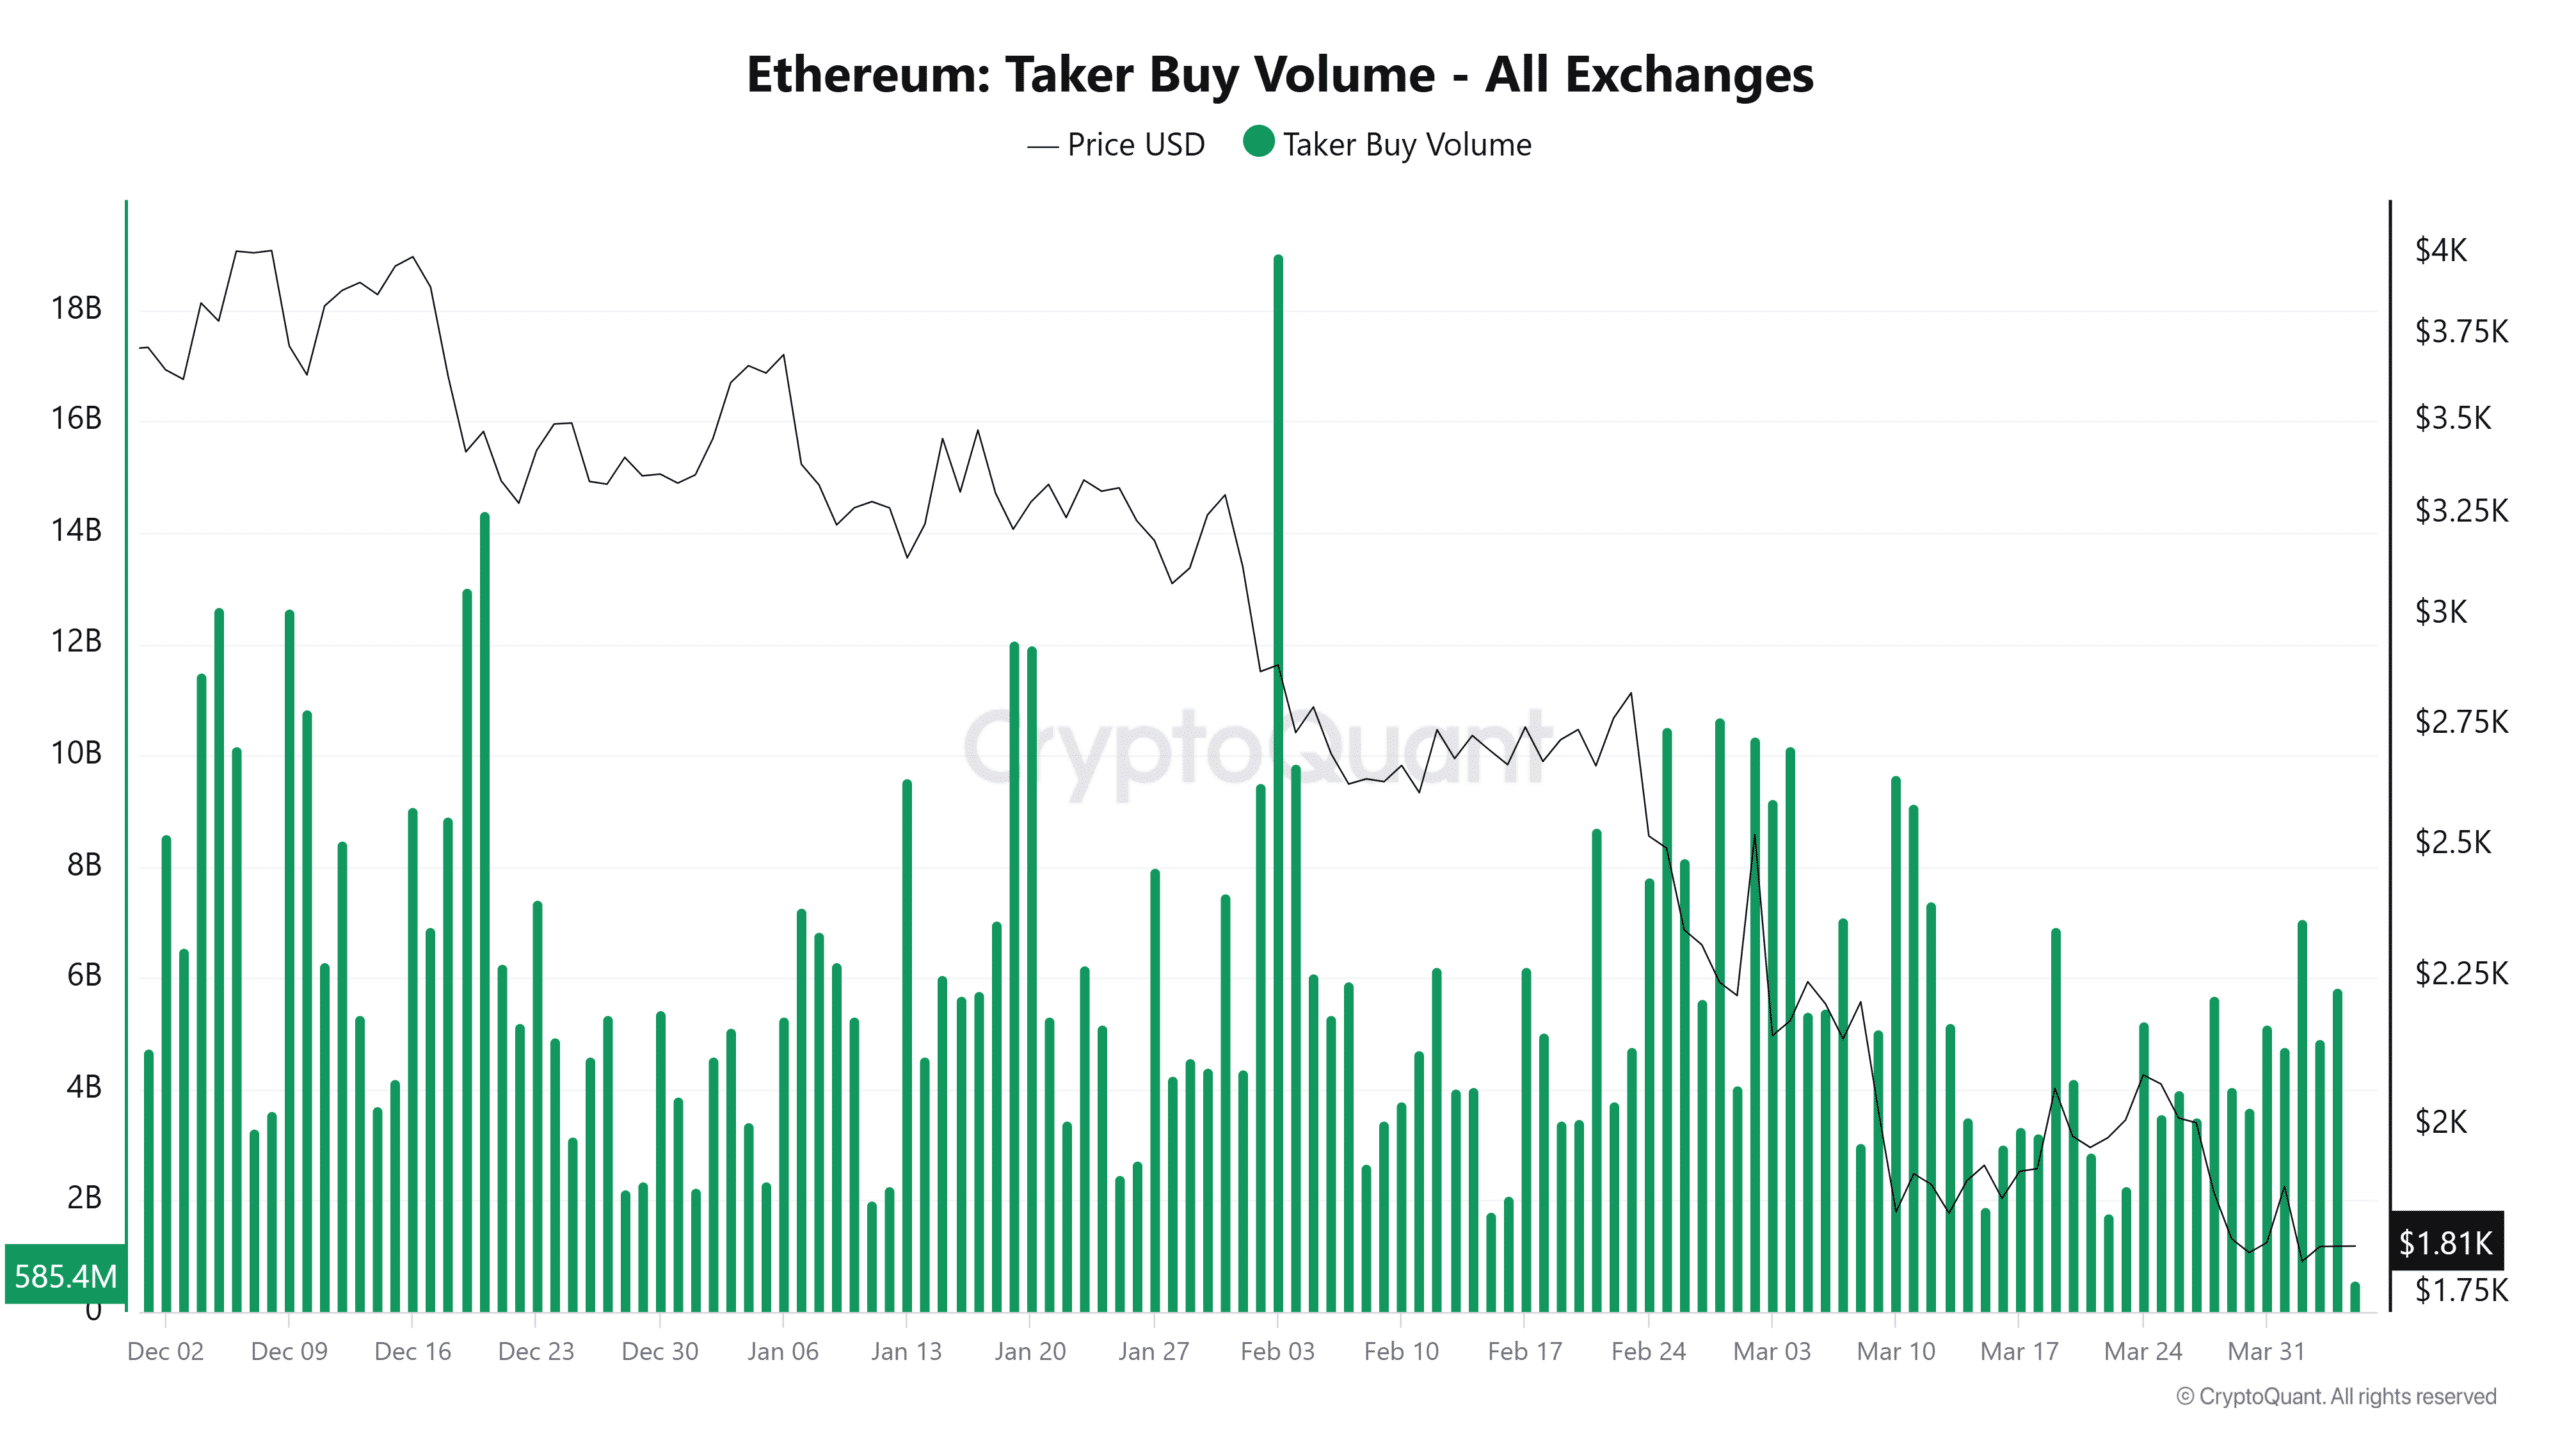
Source: CryptoQuant
For example, on the 3rd of February, the Taker Buy Volume hit $19 billion as ETH hovered around $2,882.93.
Though price didn’t rally, the spike reflects buyers attempting to absorb sell-side pressure. By the 1st of April, that volume had dropped to $4.75 billion, with ETH priced at $1,905.17.
Meanwhile, the Taker Sell Volume has also been tapering.
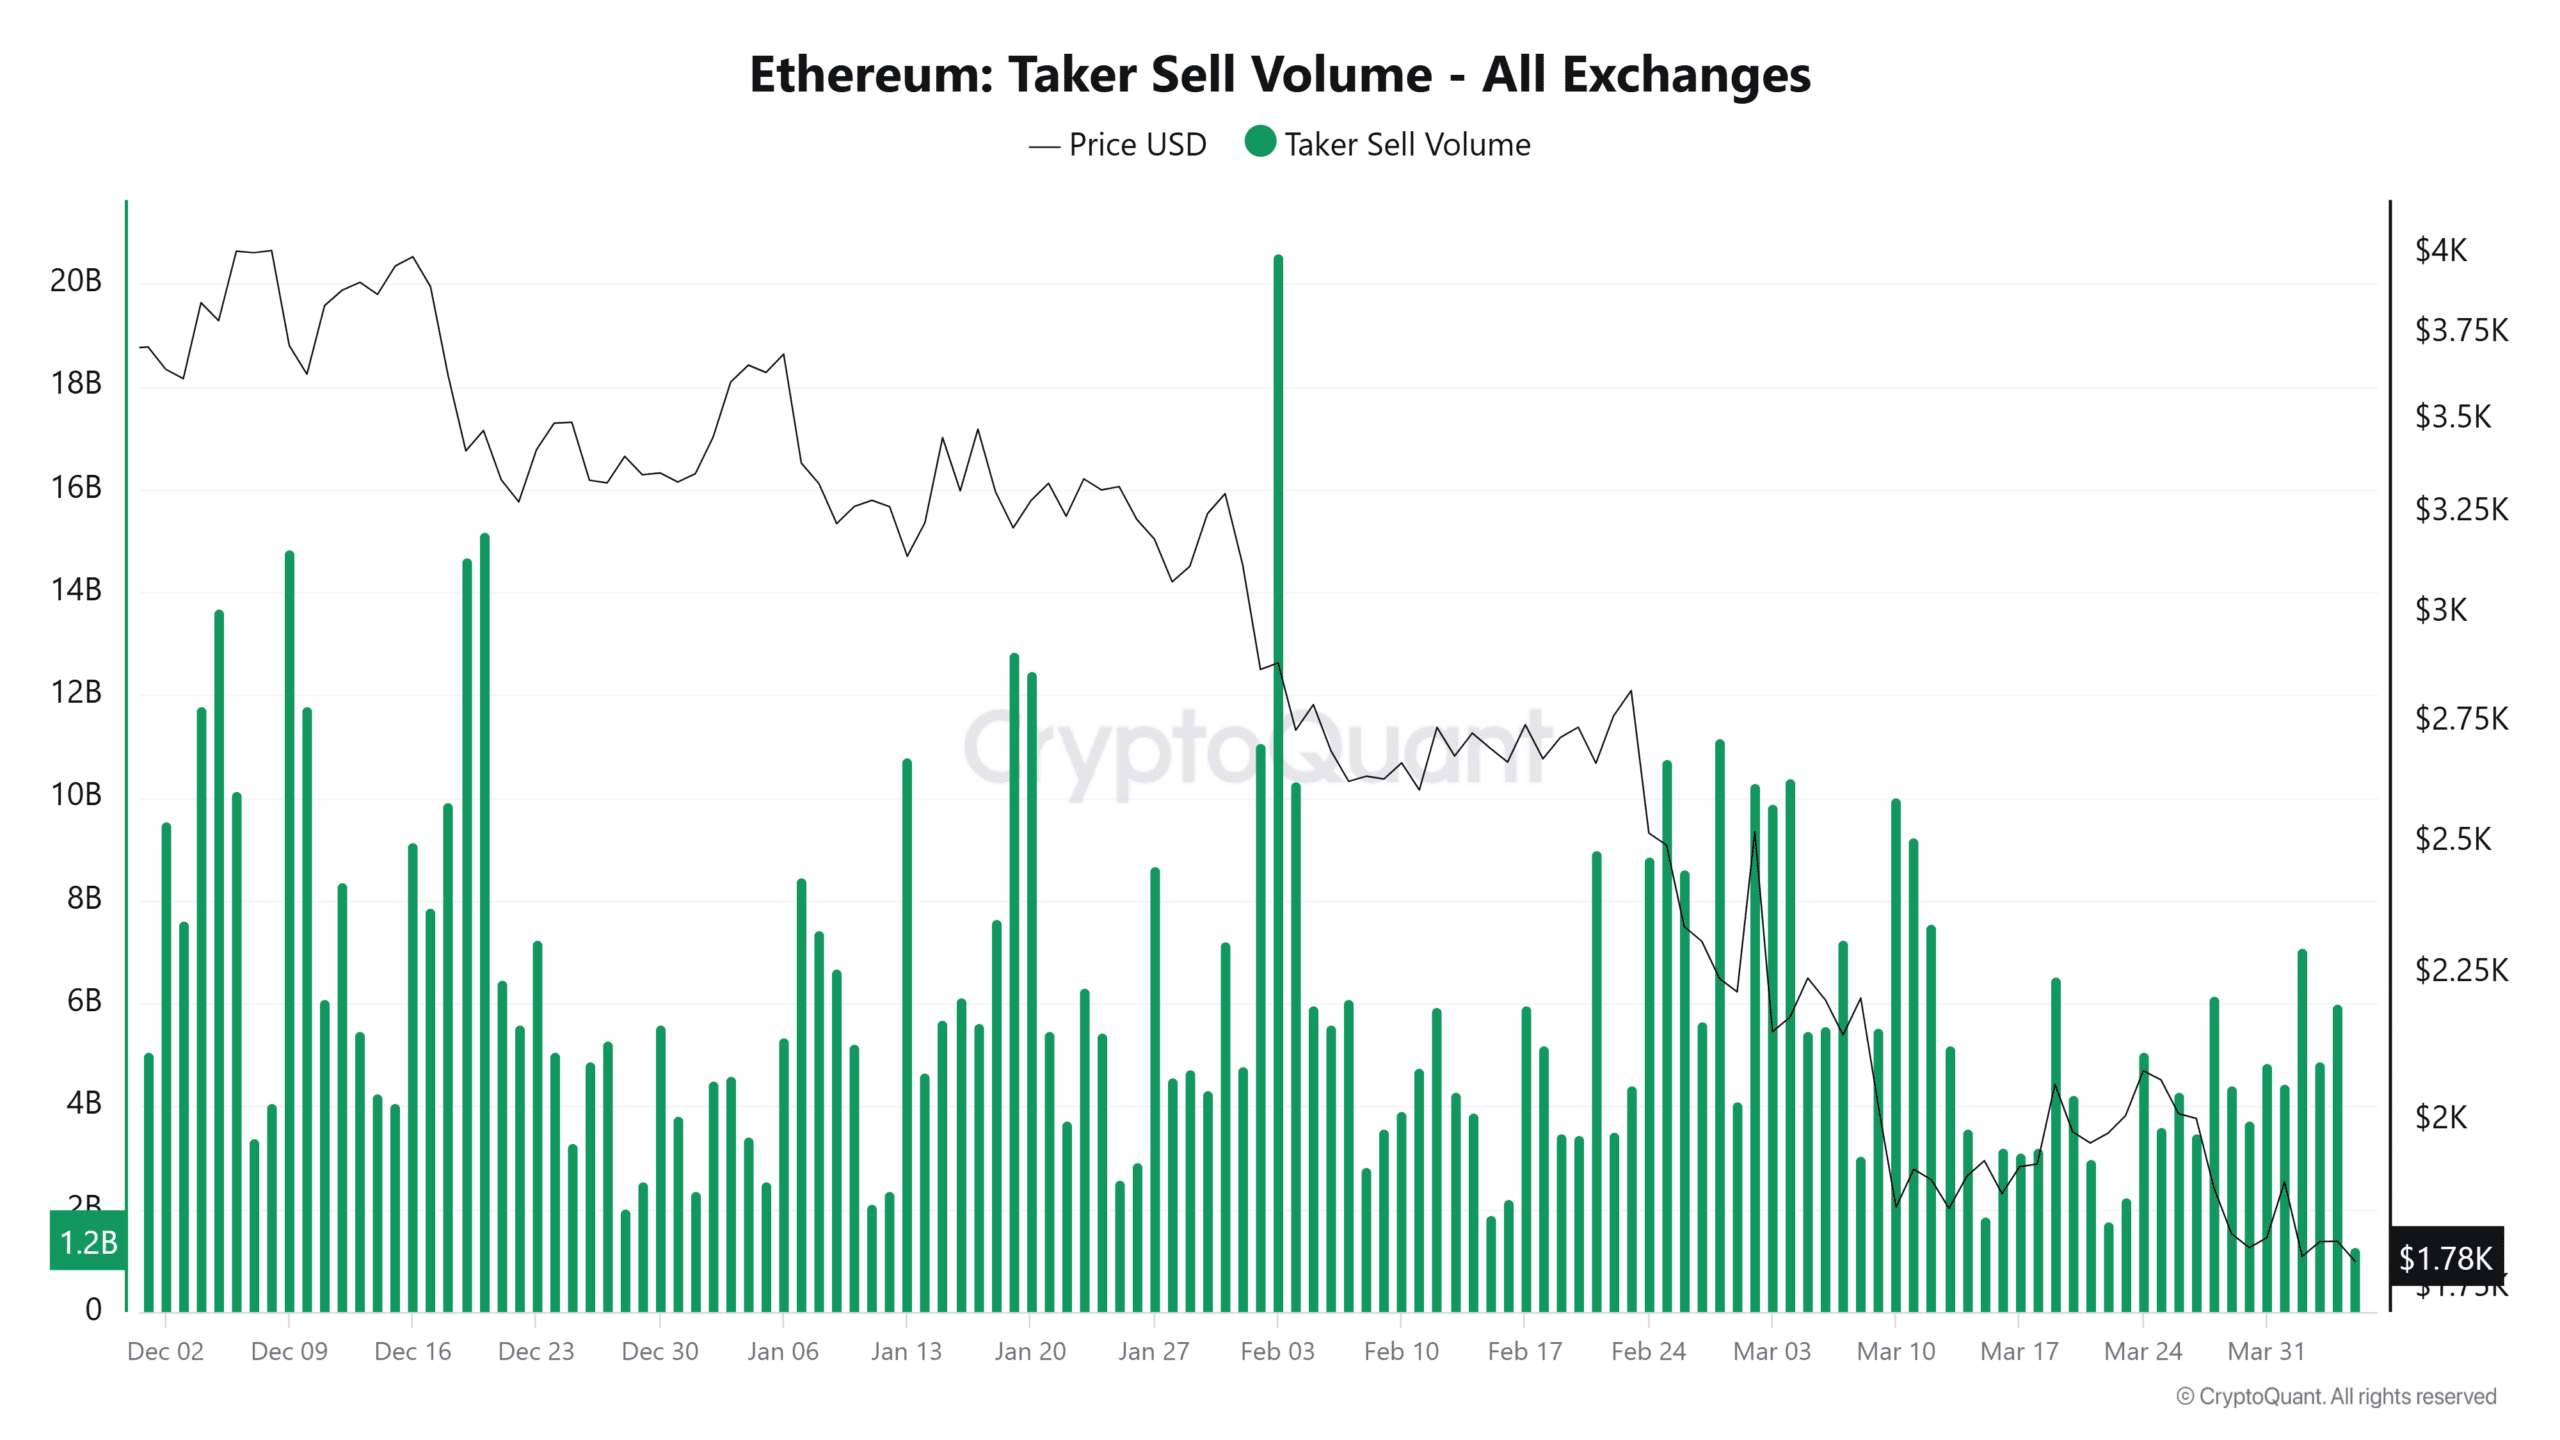
Source: CryptoQuant
Sell volumes for Ethereum reached $601.6 million at the end of December and surged to $17.6 billion in early February. However, by the 1st of April, they had significantly cooled to approximately $4 billion, indicating a decline in panic-driven sell-offs.
Furthermore, Ethereum’s exchange netflows provide additional insights into shifting market dynamics.
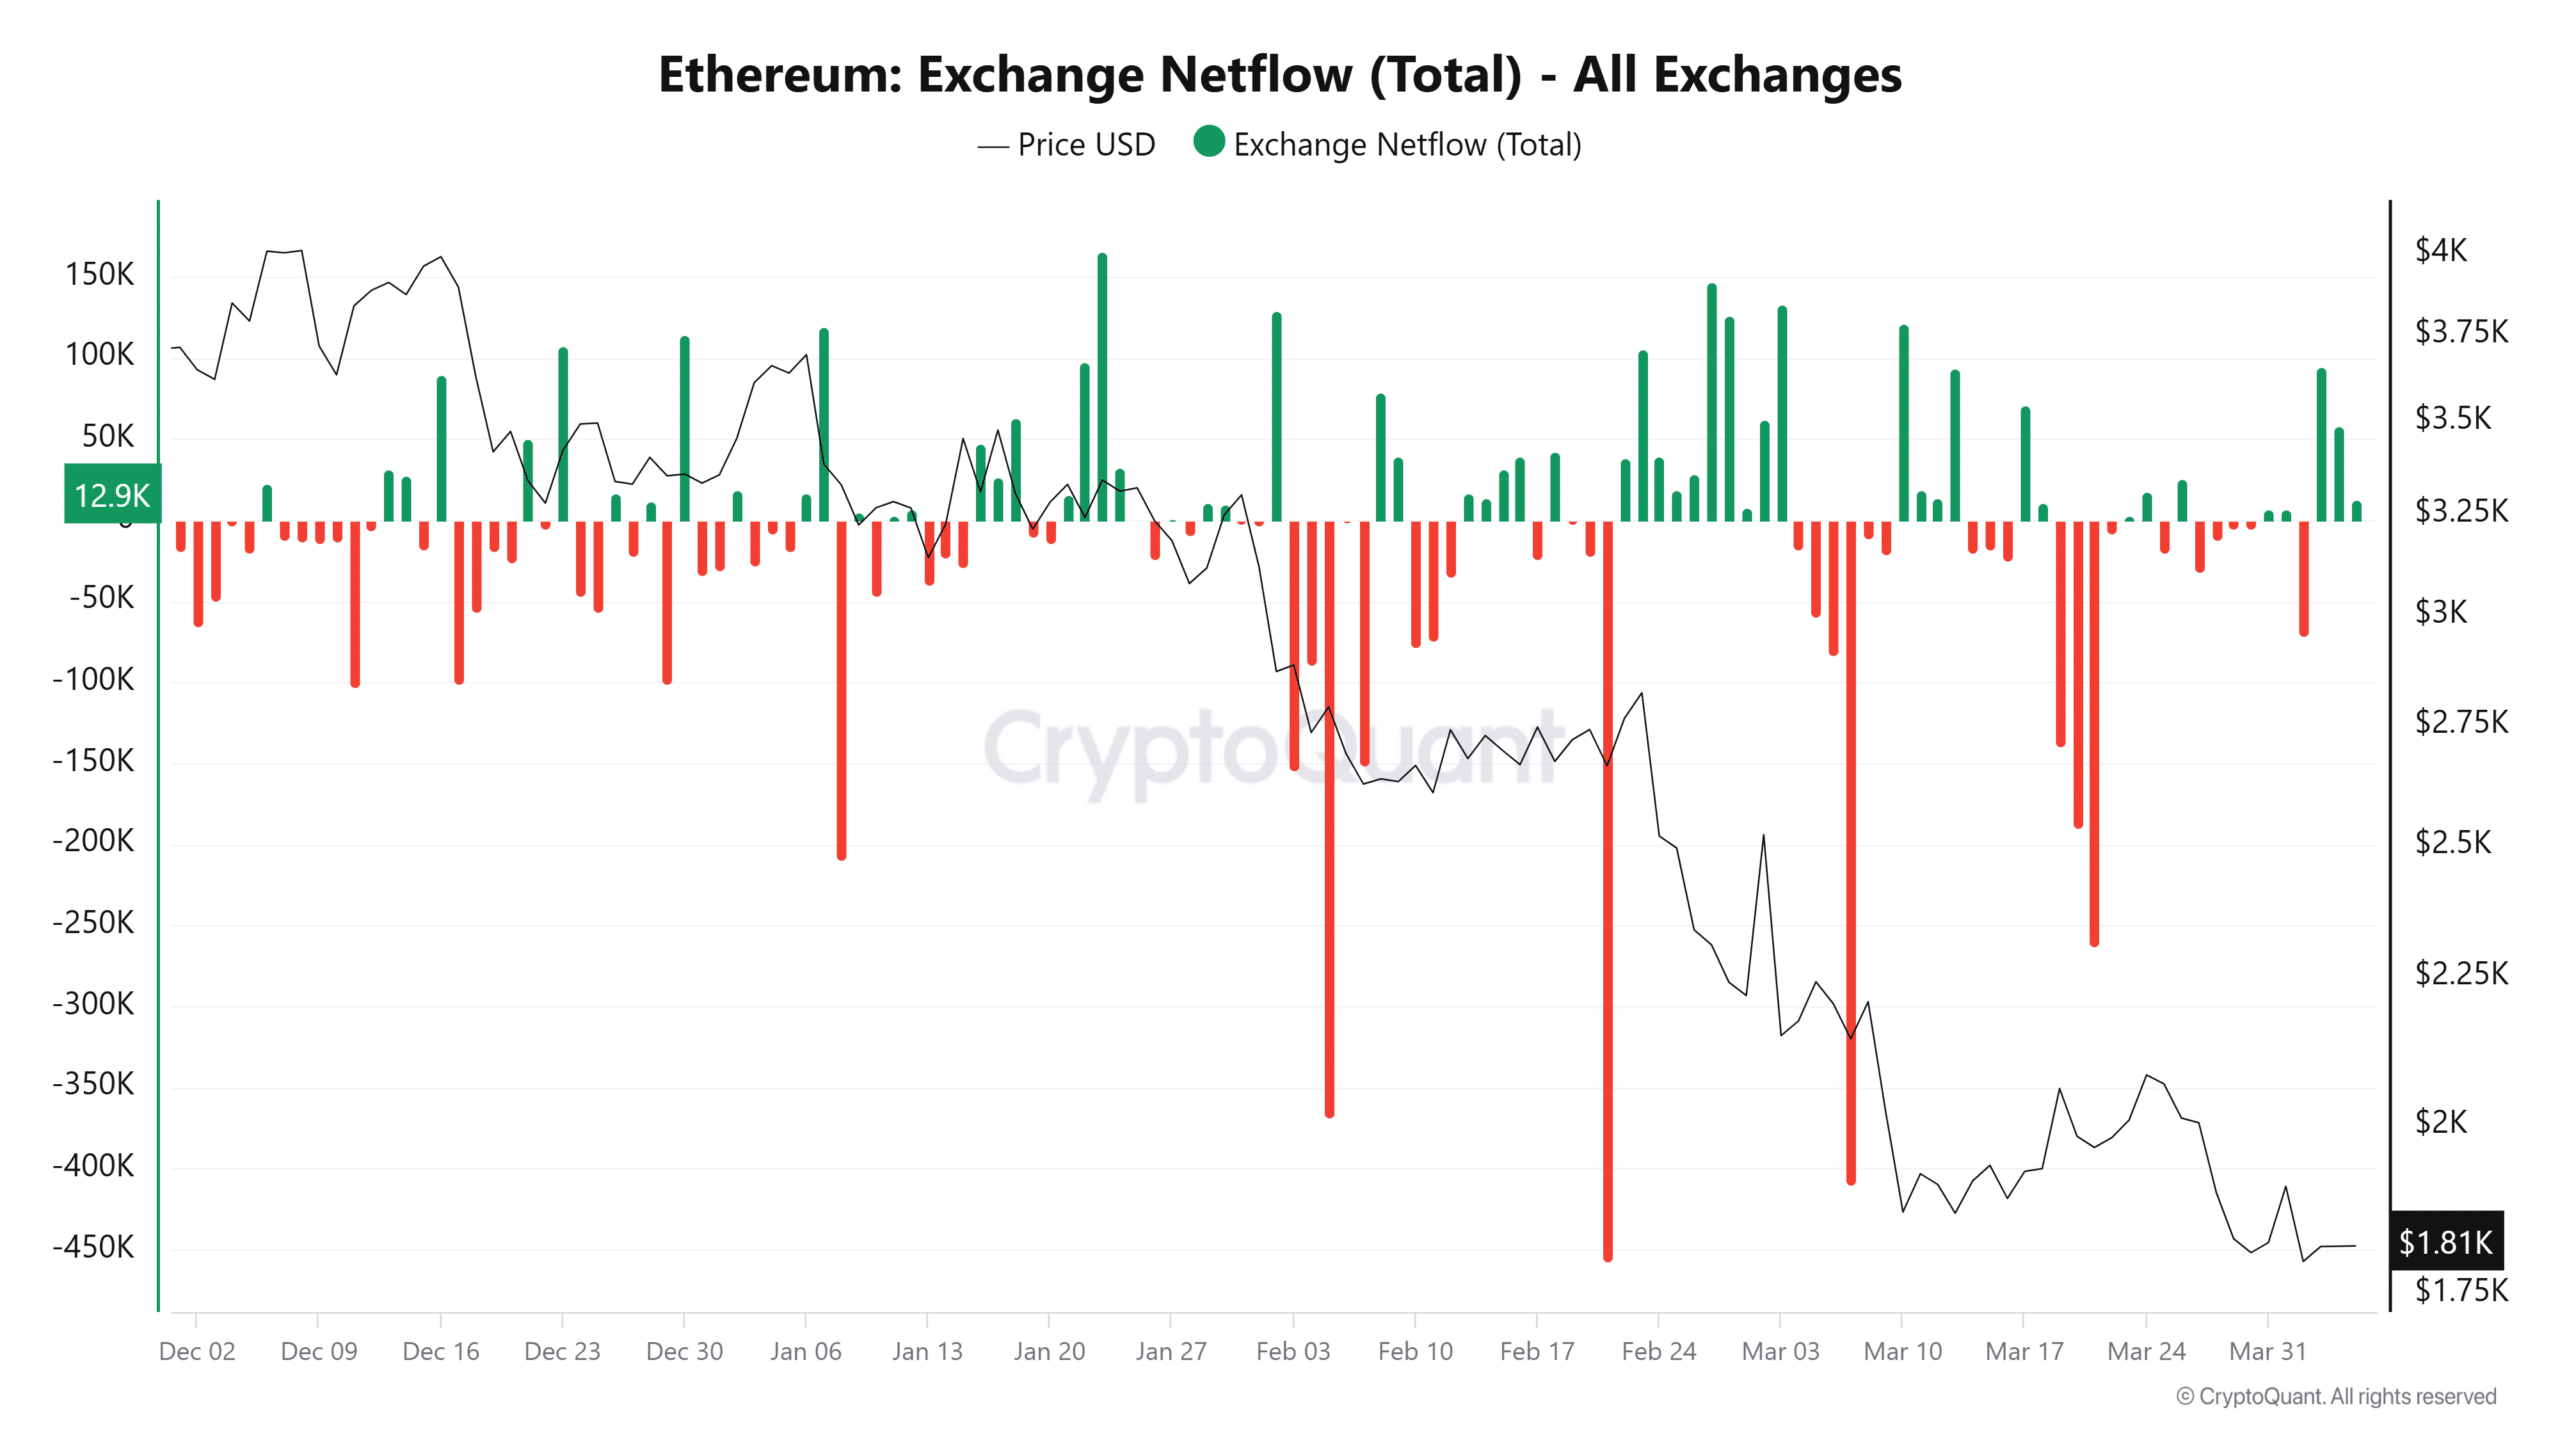
Source: CryptoQuant
From December to March, while ETH tumbled 45%—from $3,278 to $1,810—withdrawals from exchanges increased.
For instance, the 21st of February saw a net outflow of 257,700 ETH, with the price sitting at $2,661.
Having said that, there was one notable exception.
On the 10th of March, 120,900 ETH flowed into exchanges as the price dropped to $1,866—likely representing short-term traders liquidating.
Still, the broader trend leans toward strategic accumulation
From a technical standpoint, Ethereum remains entrenched in a downtrend.
Price action continues to hug the underside of its Simple Moving Average (SMA), which has acted as dynamic resistance since January 2025.
Several failed rallies—most notably to $2,700 in February and $2,000 in March show persistent overhead pressure.
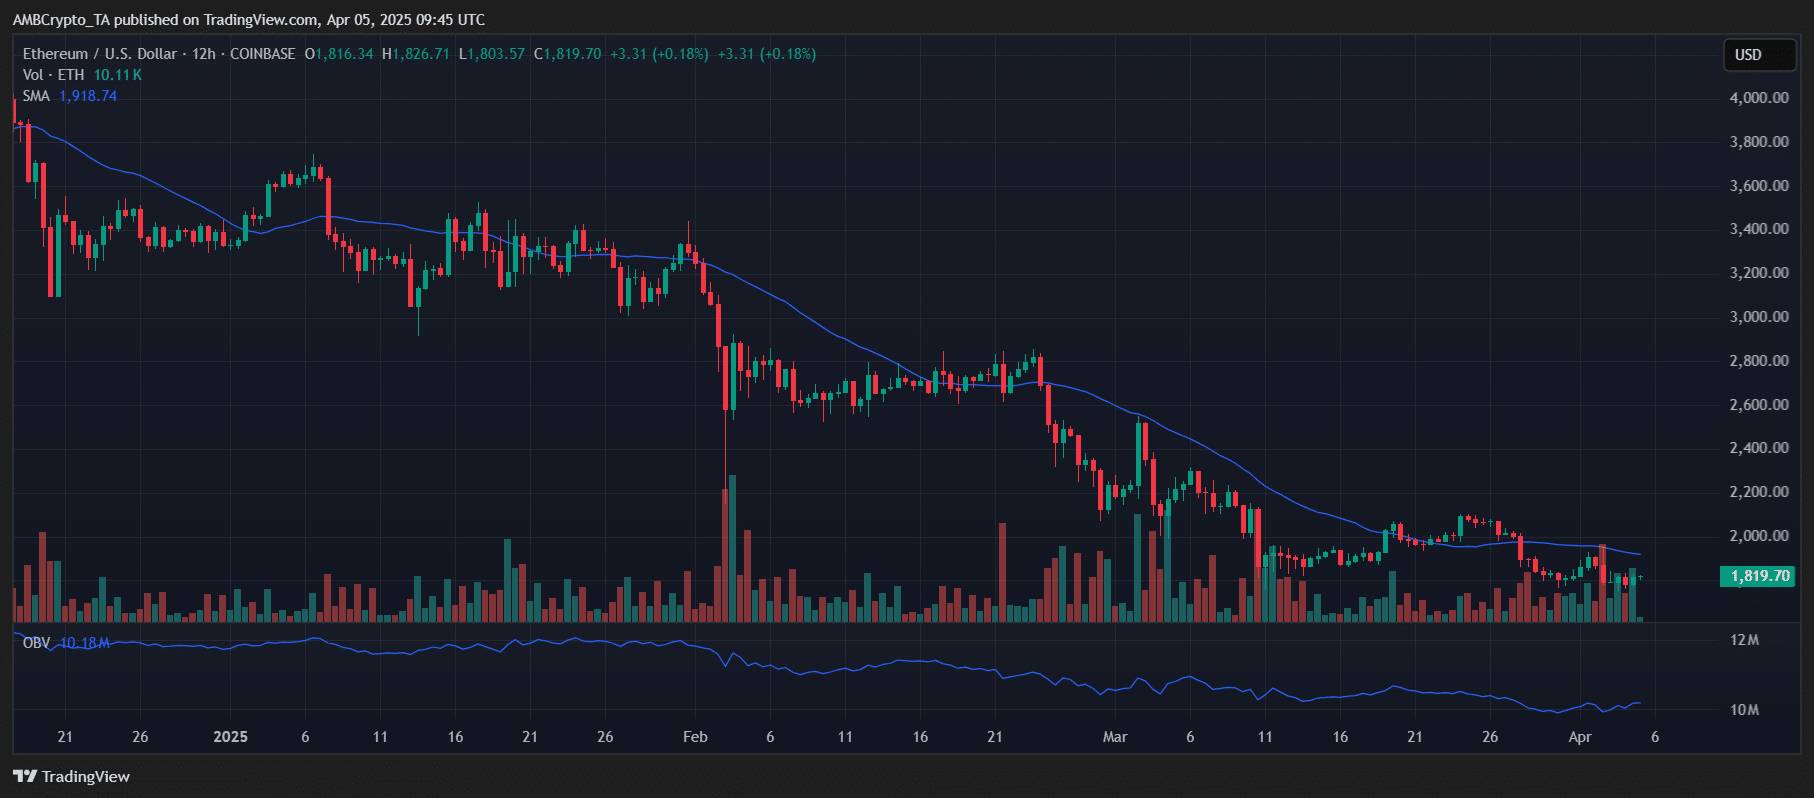
Source: TradingView
However, there’s a twist.
Ethereum has consistently held the $1,800 support zone during multiple tests in March and April. Each rebound from this level, combined with decreasing volume during price dips, indicates that sellers may be losing momentum rather than increasing their efforts.
Key factors such as the flattening OBV, exchange outflows, and cooling Taker Sell Volume suggest that $1,800 might be developing into a critical accumulation zone.
If Ethereum reclaims the $2,000–$2,200 range, it could signal a trend reversal. For now, $1,800 remains the central battleground, balancing between bearish continuation and bullish buildup.