Has MATIC’s bull run started? What you need to know
MATIC’s price broke above a key resistance level of $1.177, which can trigger yet another bull rally.

- MATIC surged by more than 3.6% in the last 24 hours.
- Metrics and indicators looked bullish.
Polygon [MATIC], following the current market trend, witnessed a price hike in the last 24 hours. But despite this, its 24-hour trading volume dropped.
However, the token might have been preparing for a further rally, if the latest data is to be considered.
Polygon breaks above a key level
According to CoinMarketCap, MATIC’s value surged by more than 6% in the last seven days. In fact, in the last 24 hours alone, the token’s price went up by over 3.6%.
At press time, Polygon was trading at $1.18 with a market capitalization of over $11.6 billion. As a result, the token’s social volume remained high throughout the last week.
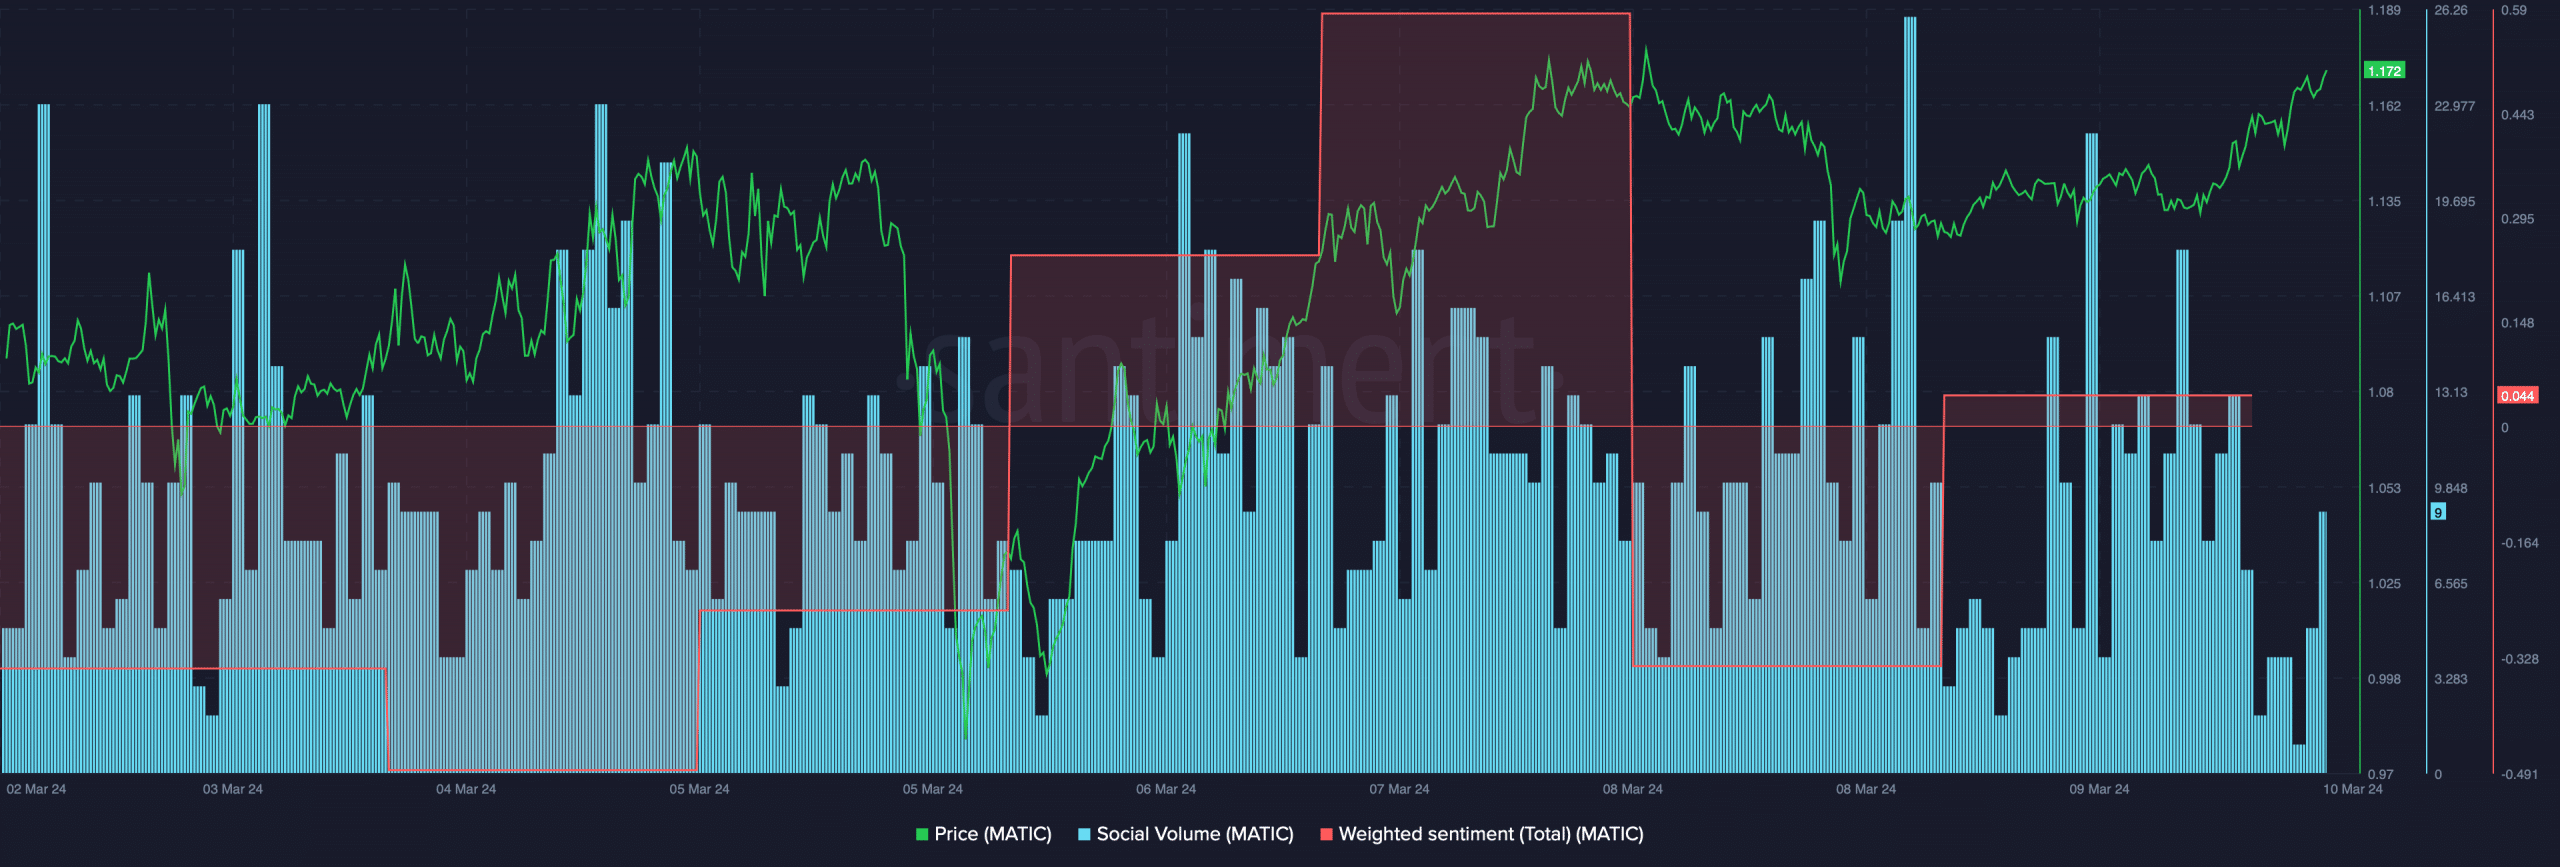
However, its Weighted Sentiment remained low, meaning that bearish sentiment around the token was dominant. Additionally, its trading volume declined by 21.5%.
A drop in trading volume suggests investors are not actively trading a token at press time.
Which way is MATIC headed?
To better understand what to expect from the token, AMBCrypto took a look at its metrics.
As per our analysis of CryptoQuant’s data, at press time, MATIC’s net deposit on exchanges was low compared to the last seven days’ average.
This meant that buying pressure on the token was high.
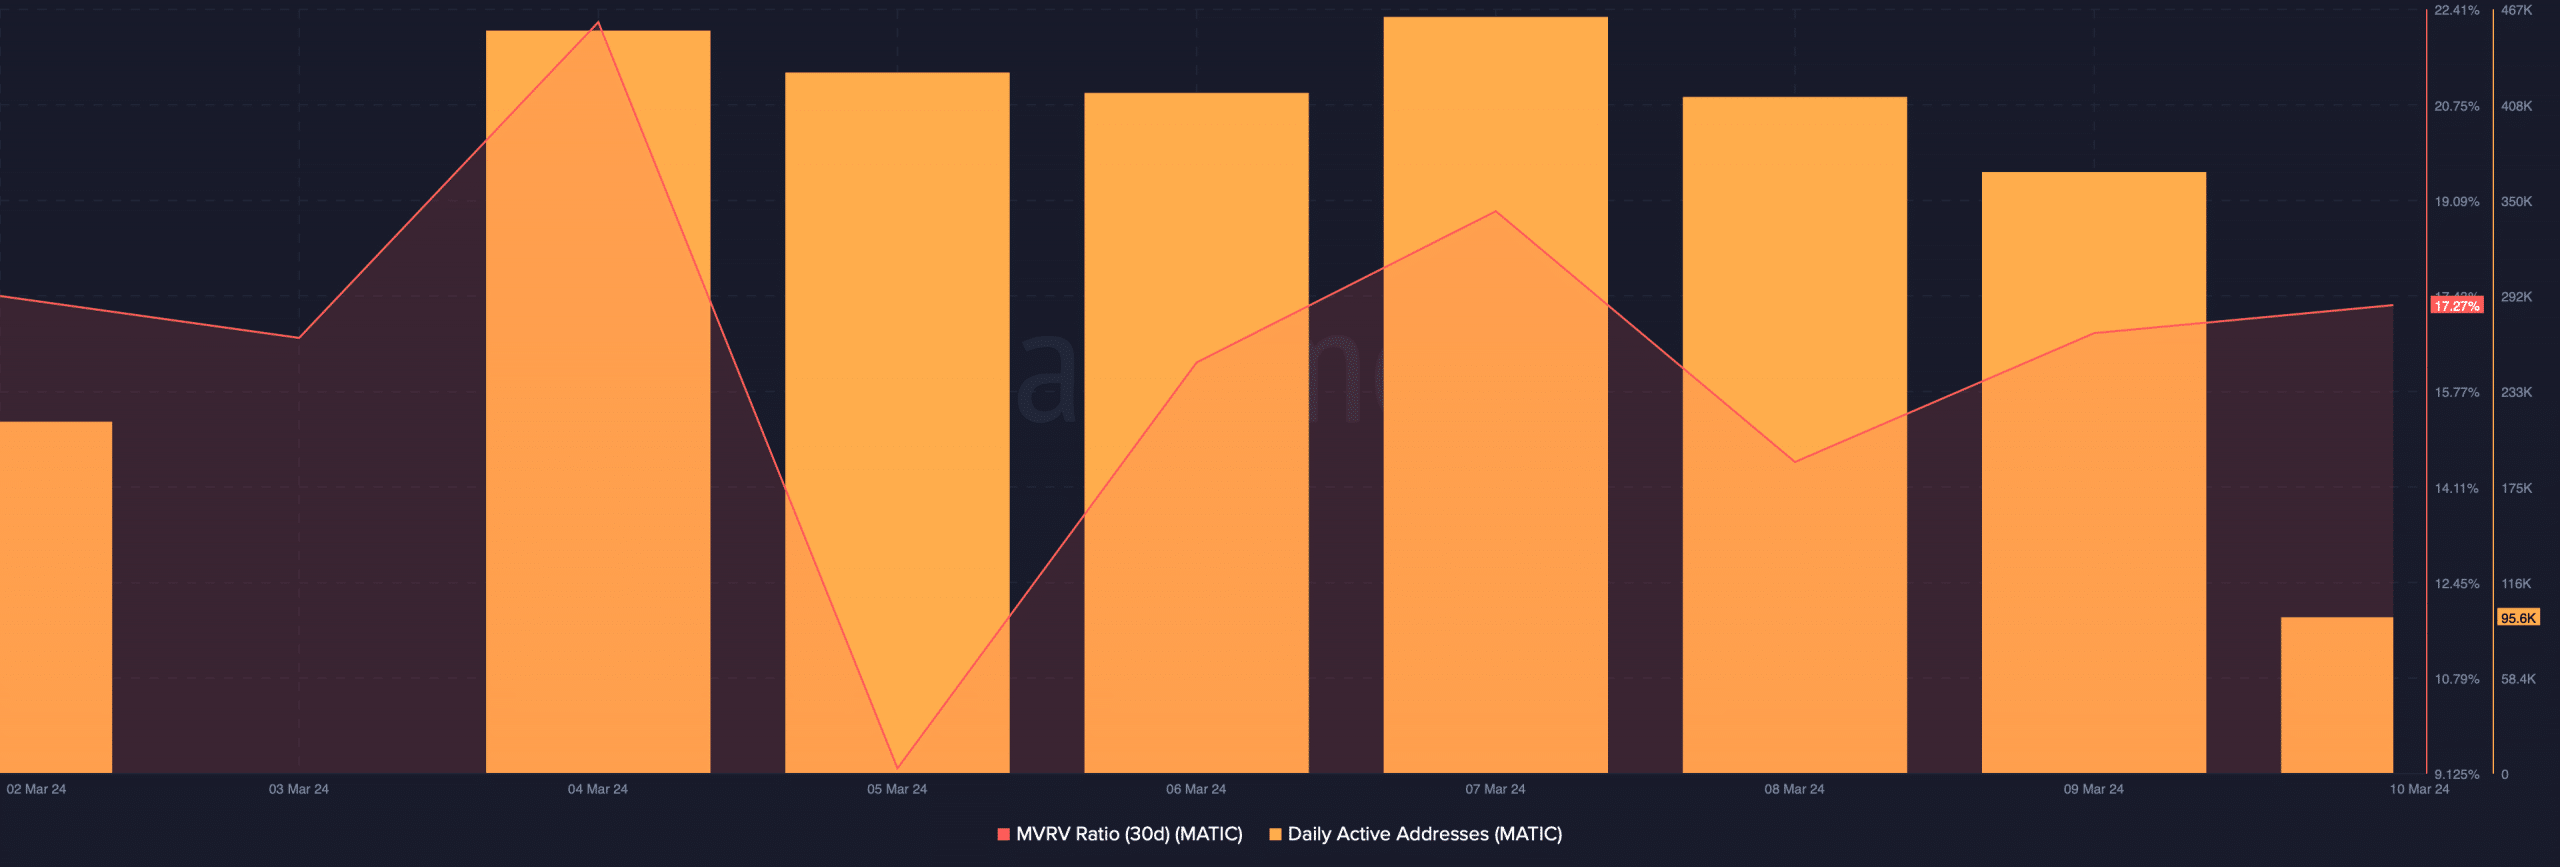
Another bullish metric was the token’s MVRV ratio, which increased in the last week. MATIC’s network activity was also high during this time, as evident from its daily active addresses.
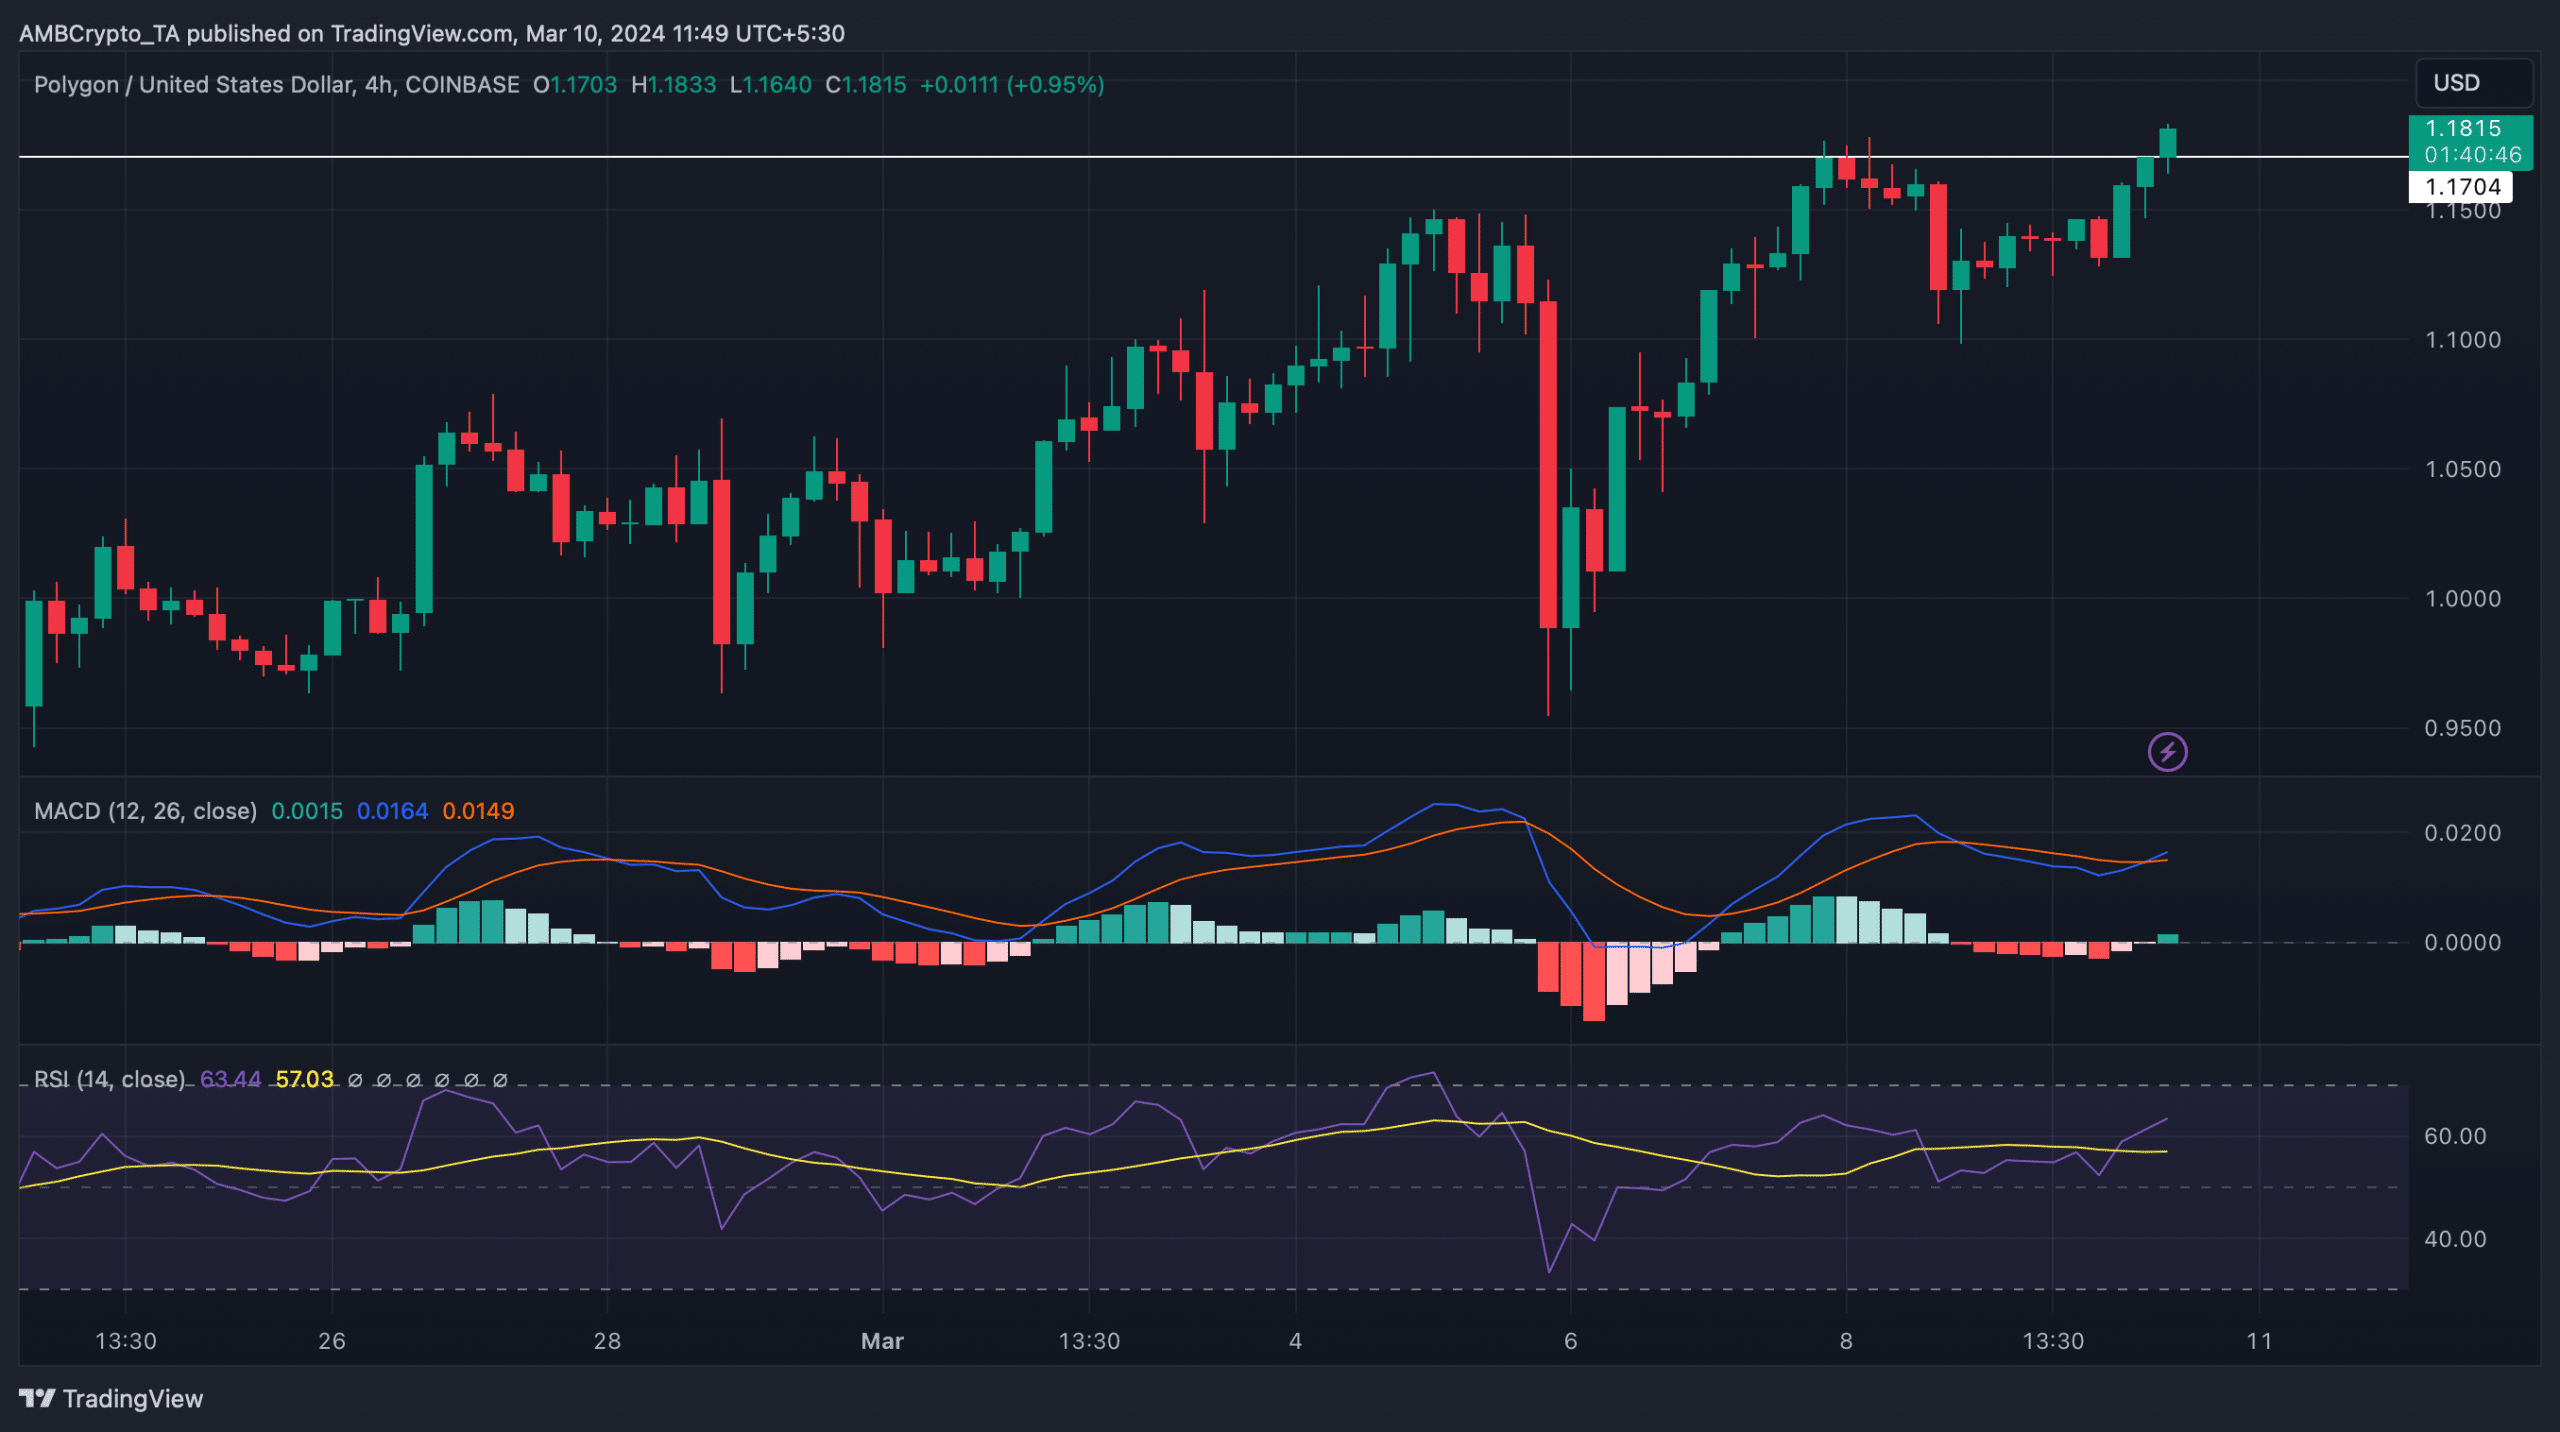
In fact, MATIC crossed a key resistance of $1.177 at the time of the report, suggesting that the token might begin yet another bull rally soon.
Is your portfolio green? Check out the MATIC Profit Calculator
Notably, its MACD displayed a clear bullish crossover, while the Relative Strength Index (RSI) also registered a sharp uptick.
This indicated that the possibility of a further northward price movement was high in the coming days.