Hedera Hashgraph price surges as expected: What’s next for HBAR will leave you wondering
The orders imbalance could see Hedera bounce between key short-term levels and hunt liquidity pockets instead of trending northward at a steady pace.

- HBAR was yet to flip the daily market structure bullishly.
- The $0.3 level could be retested in the next day or two before a bounce occurs.
Hedera [HBAR] was on the verge of breaking the $0.33 local resistance zone after the retracement it saw earlier this month. This retracement was cut short at $0.255, which was close to a significant level from March 2022 at $0.269.
The token saw a 67% hike in trading volume in the past 24 hours and was bullishly poised. AMBCrypto analyzed the price action of HBAR to understand the next targets for traders.
Hedera headed beyond $0.4 next
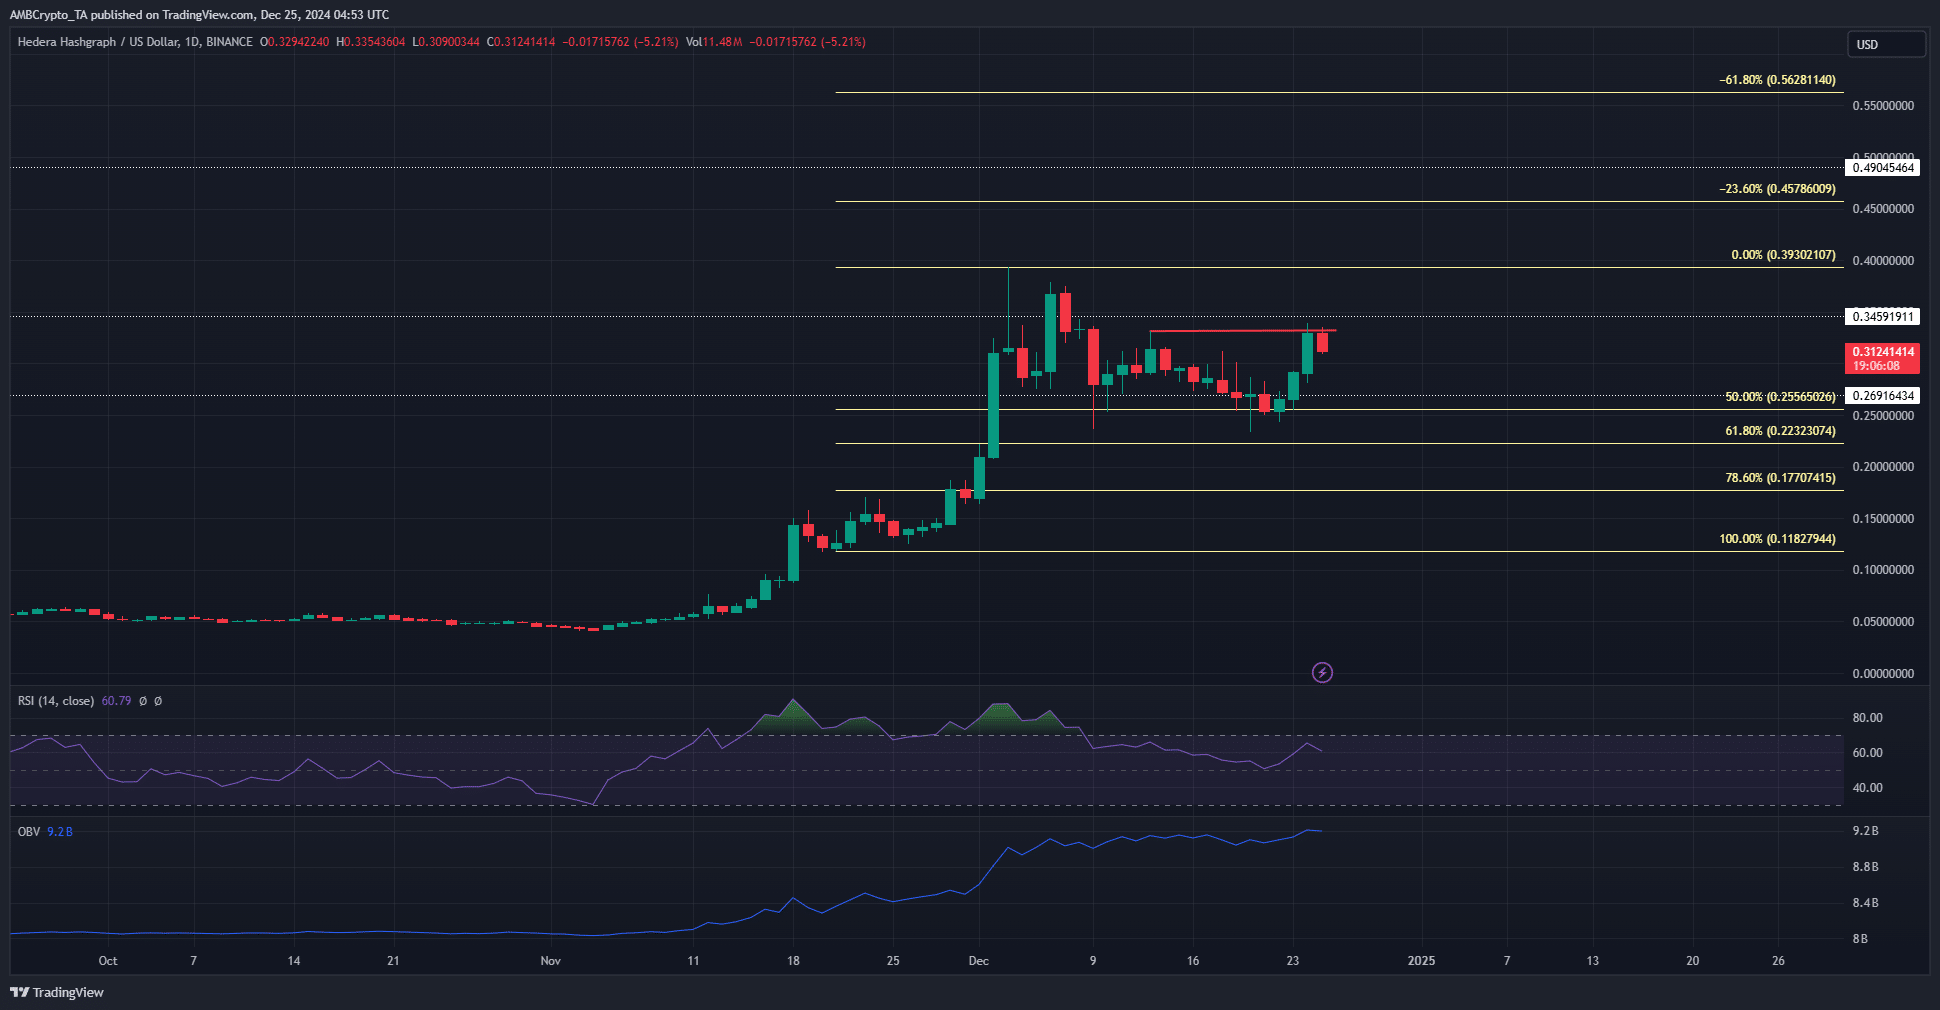
Even though HBAR saw 13.26% gains on Tuesday the 24th of December, its market structure on the daily chart was bearish. The lower high at $0.331 was not conclusively breached yet. On the other hand, the higher timeframe trend was bullish.
The Fibonacci levels plotted from the move from the second half of November that reached $0.393 showed that the $0.255 level was the 50% retracement level. The swift bounce from this support zone, which had been tested earlier in December, was a sign of demand.
Another firm indication of bullish dominance was seen on the OBV, which has steadily trended higher over the past two months. The RSI bounced off the neutral 50 mark a week ago to highlight the bullish momentum Hedera maintained.
A bullish structure break would likely be followed by a quick move beyond $0.4, so long as Bitcoin [BTC] does not experience a major drop. The next bullish targets for the coming weeks would be $0.457, $0.49, and $0.563.
Order imbalance flip could see volatility
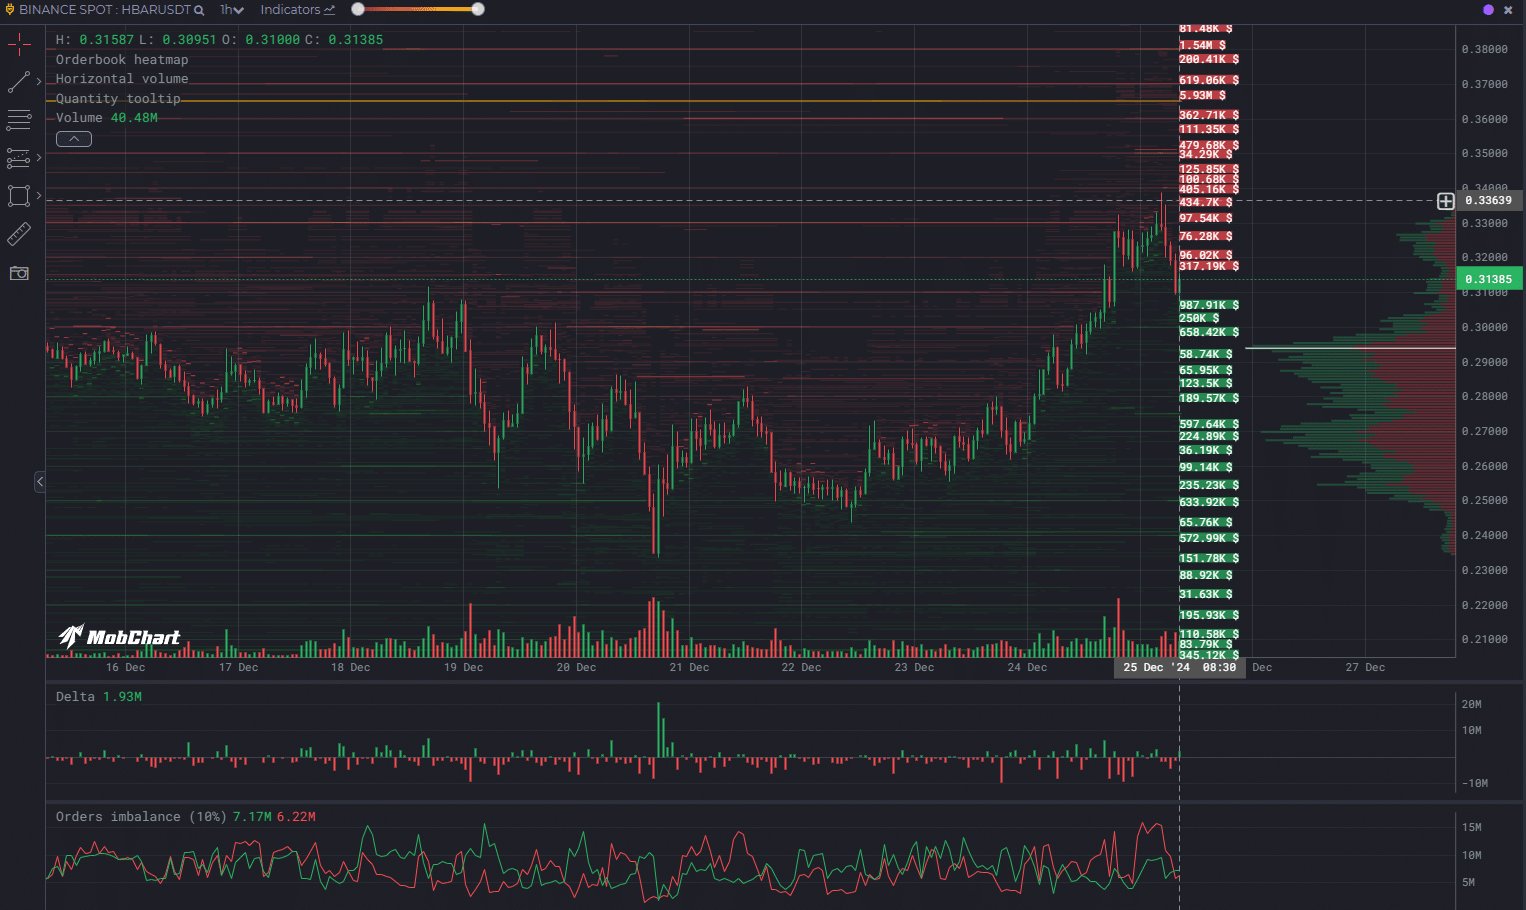
AMBCrypto found that there was a cluster of limit buy orders from $0.305-$0.308 worth $987k. Hence, it is possible that these recently opened buy orders will be visited. HBAR was likely to dip to $0.3 before the next move higher.
Read Hedera’s [HBAR] Price Prediction 2024-25
The orders imbalance indicator showed a crossover in buy orders being more numerous. While this showed more buy orders around the vicinity of the price in the lower timeframes, it does not guarantee a price rise in the coming days.
Instead, it could see Hedera bounce between key short-term levels and hunt liquidity pockets instead of trending northward at a steady pace.
Disclaimer: The information presented does not constitute financial, investment, trading, or other types of advice and is solely the writer’s opinion