Hedera’s NVIDIA-linked AI push fuels HBAR’s 24% rally – Is $0.20 realistic?
HBAR surged 24% as NVIDIA-linked attention, spot outflows, and a bullish CHoCH strengthened its breakout.



HBAR price climbed 24.38% as Hedera’s NVIDIA-linked AI story reinforced institutional interest, triggering a rapid expansion in the market activity.
The rally emerged as Hedera Council members joined NVIDIA’s Open Agent Safety Platform. Reportedly, five council members participated alongside EQTY Lab, which uses Hedera’s platform to maintain AI audit trails.
Additionally, the EQTY Lab also used NVIDIA GPUs within its Verifiable Compute infrastructure, strengthening the connection between the ecosystems.
This development reinforced Hedera’s positioning around AI verification, trust, and as well as enterprise infrastructure. On the Spot market, HBAR’s market participation increased rapidly, jumping 1,088% to $1.33 billion as the rally unfolded.
Leverage floods into HBAR’s rally
The heightened trading activity was reflected in the HBAR derivatives, where participants rapidly expanded their exposure as HBAR pushed higher.
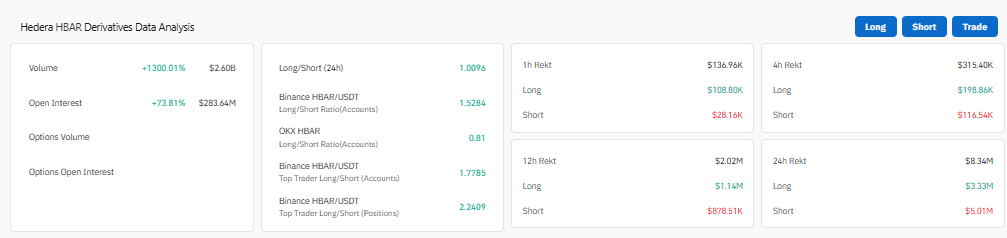
Notably, the derivatives volume surged 1,300.01% to $2.60 billion as of writing, highlighting a drastic expansion in speculative market participation.
Additionally, the Open Interest (OI) also increased 73.81% to $283.64 million, suggesting investors created substantial new positions.
Binance’s top-trader account Long/Short ratio, meanwhile, reached 1.77, while its top-trader position ratio sat even higher at 2.2409. This positioning implied stronger long exposure among larger traders.
It’s also worth noting that the increasing leverage, however, raised HBAR’s vulnerability to sharp price swings.
Exchange outflows tighten available supply
The spot flows added another dimension to HBAR’s sharp recovery while derivatives participants increased exposure.
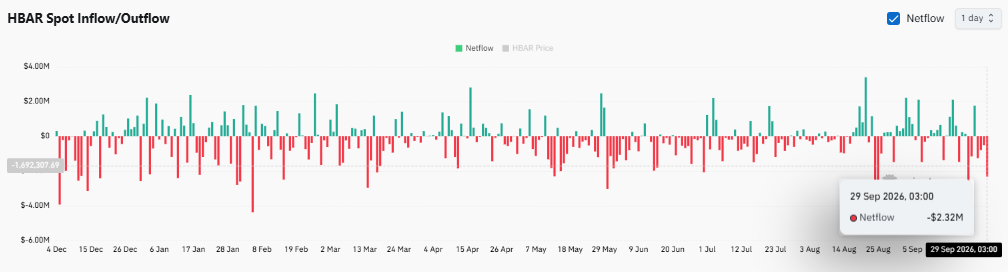
As per CoinGlass spot data, HBAR had recorded roughly $2.32 million in net spot outflows at reporting time. These negative netflows suggested more tokens moved away from exchanges during the 24-hour period.
Notably, the recent reading also extended the broader presence of negative flows visible across the recent sessions. Therefore, exchange-side supply pressure remained controlled as the HBAR price rallied.
This dynamic supported the rising trading activity instead of depending solely on the leveraged demand. The strong derivatives expanded, reflecting speculative participation as spot outflows pointed towards limited immediately available exchange supply.
However, the scale of the rally still made the technical price structure increasingly crucial. Hedera needed technical confirmation to gauge whether buyers had shifted its broader trend.
CHoCH confirms HBAR’s structural shift
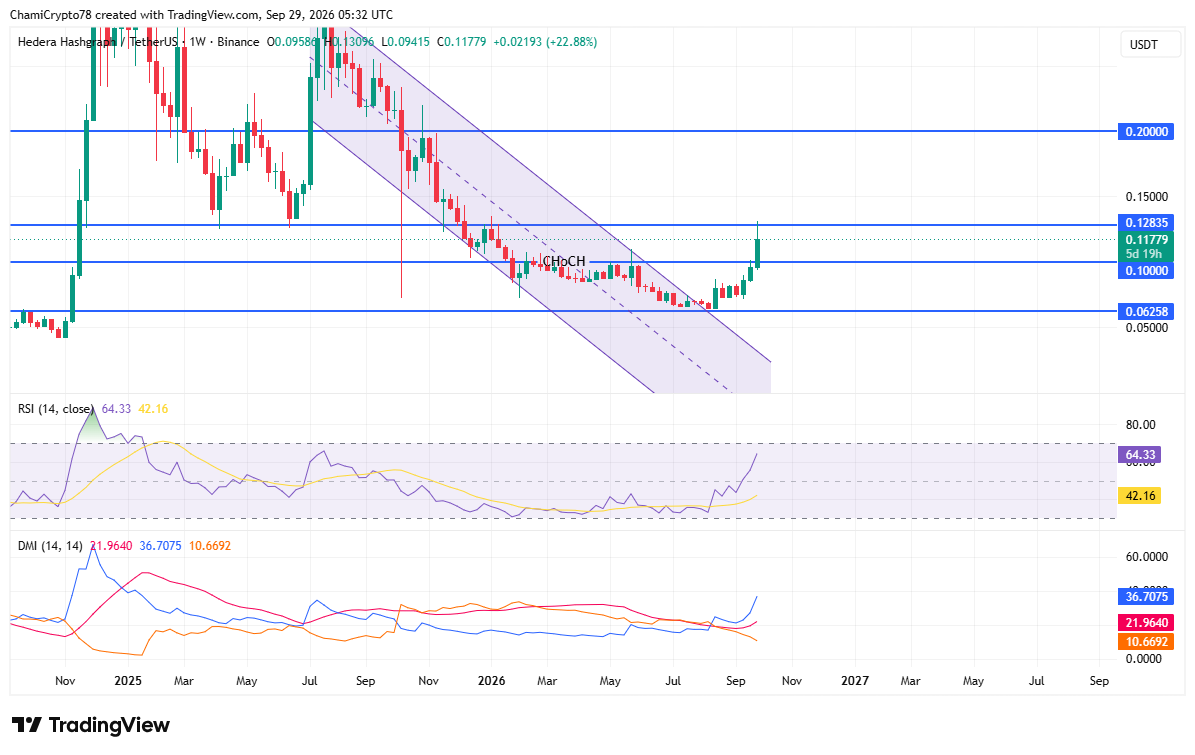
On a weekly timeframe chart, HBAR provided that confirmation by breaking its descending channel, registering a bullish change of character (CHoCH).
Notably, Hedera’s price reclaimed the $0.10 price level before pushing towards the next resistance at $0.12835. The CHoCH reflected a notable departure from the bearish structure that had governed HBAR’s price downtrend.
Additionally, the weekly DMI indicator added strength to the breakout, with the +DI signal reading reaching 36.71 as the -DI signal reading declined to 10.67. At the time of writing, the ADX strength indicator stood at 21.96, implying directional strength gradually developing behind the structural change.
The RSI indicator climbed to 64.33 as buying pressure accelerated. The indicator, however, remained below the 70 overbought conditions threshold despite HBAR’s steep rally.
Ultimately, a strong breakout above the $0.12835 resistance could open HBAR’s path towards the broader $0.20 region. However, a decisive price rejection could bring the $0.10 level back into focus as the breakout support.
Final Summary
- HBAR’s 24% rally gained strength from rising derivatives activity and sustained spot outflows.
- HBAR could target $0.20 above $0.12835, though minor pullbacks could come first.