Altcoin

Helium encounters key resistance: A look at HNT’s bullish pattern, volume slump
Posted:
Journalist

- The cryptocurrency is currently trading within an ascending channel, signaling a potential bullish breakout.
- Despite the presence of a pattern that typically precedes a rally, HNT’s low trading volume reflects a notable lack of enthusiasm.
Over the past seven days, Helium [HNT] has seen a 9.80% increase, setting market expectations for continued upward movement. However, the asset has encountered significant resistance within its bullish pattern, leading to a recent drawdown.
While such bullish patterns typically attract increased liquidity, AMBCrypto finds that the opposite trend is occurring, with liquidity not meeting expectations.
Resistance level at $7.8950 triggers a price decline for HNT
HNT has encountered resistance at the price of $7.8950, a level marked by considerable selling pressure, leading to a further decline in its price.
This resistance forms the upper boundary of the ascending triangle pattern within which HNT has been trading.
Typically, the price oscillates between the upper resistance and lower support boundaries of this pattern before potentially breaking out to the upside.
A decisive breakout from this pattern for HNT could be facilitated by the descending line serving as support, potentially driving the HNT back to the $10 zone or higher. Conversely, failure to maintain this momentum could see HNT retreat to the pattern’s lower support.
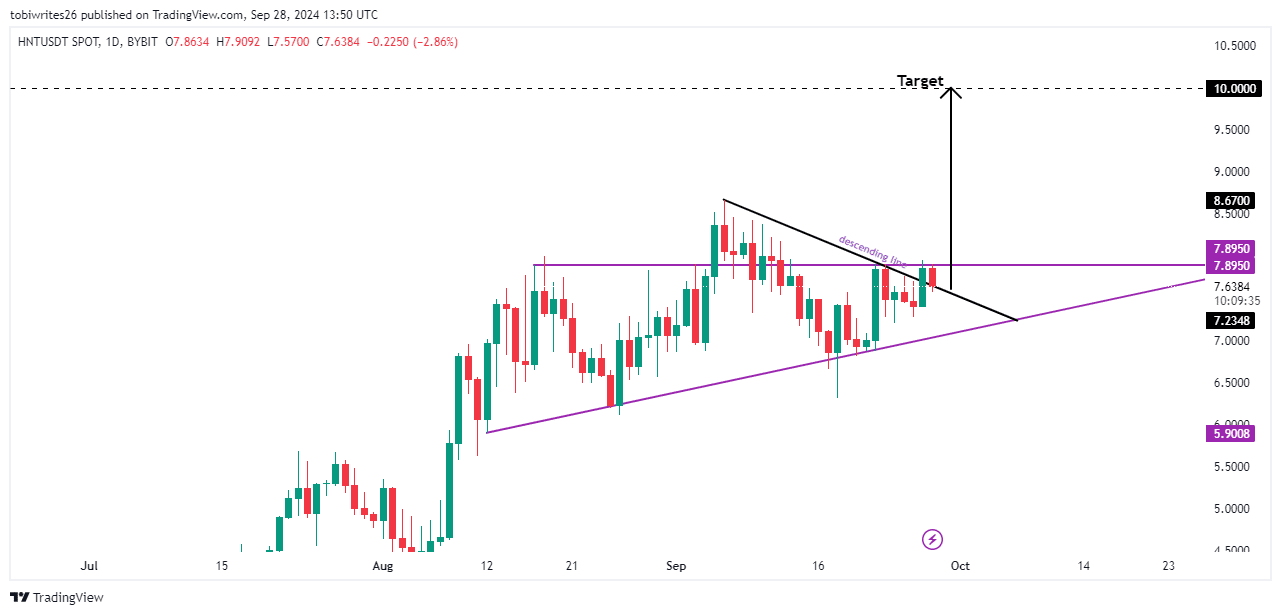
Source: Trading View
AMBCrypto provides additional analysis indicating that the descending pattern is expected to hold firm for the time being.
Market sentiment skews bullish for HNT as traders dominate
Market action reveals a prevailing bullish sentiment for HNT, as evidenced by indicators like the Parabolic SAR (Stop and Reverse) and the Relative Strength Index (RSI).
The Parabolic SAR, which appears as dots positioned above price bars in a downtrend and below in an uptrend, is currently below the price bars for HNT. This placement indicates a setup for potential upward movement, despite recent pullbacks from the resistance level.
Similarly, the RSI supports this bullish outlook, currently positioned at 53.30, above the neutral threshold.
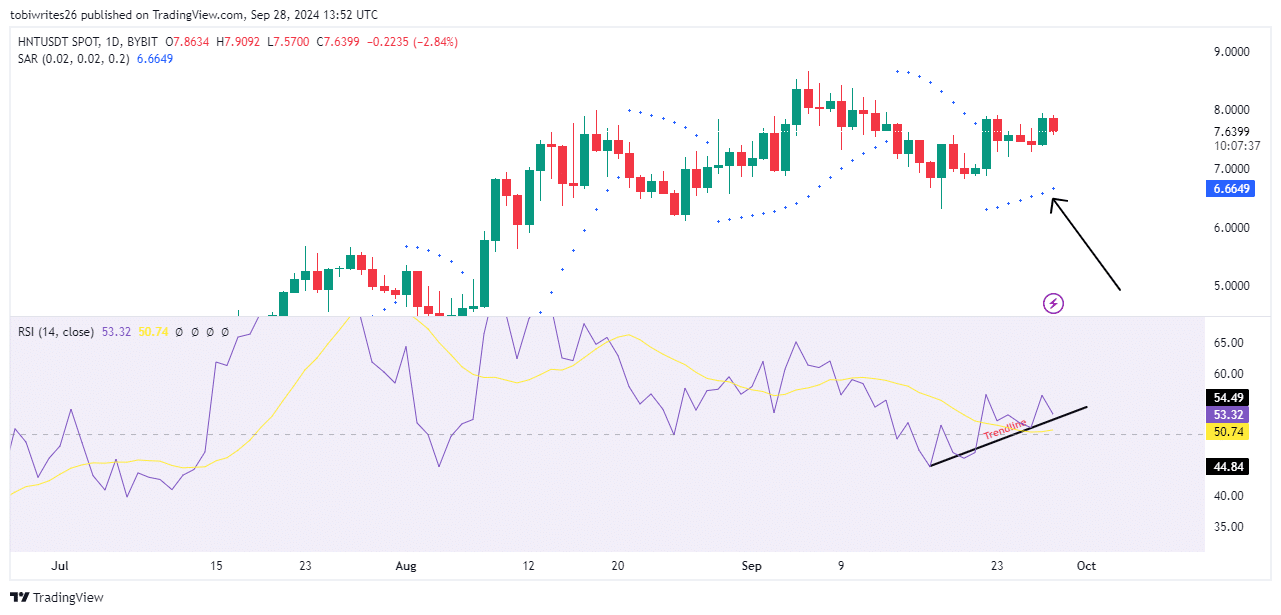
Source: Trading View
However, further analysis of the RSI trend line suggests a possible slight retreat to the support trend line. This could temporarily lower HNT’s price before catalyzing an upward trajectory in both the RSI and HNT’s market price.
HNT’s upward Movement will face a delay
Despite favorable conditions for an upward market movement, HNT’s progress may be delayed due to a significant drop in trading volume.
Read Helium’s [HNT] Price Prediction 2024–2025
CoinMarketCap reports a 46.32% decrease in HNT’s trading volume, currently valued at $9.07 million, ranking it 347th in the cryptocurrency volume table.
This decline in volume, coupled with neutral price movement, suggests that traders are not yet fully supporting the anticipated rally. Consequently, HNT’s price is unlikely to rise until there is an increase in market activity and liquidity.