Helium’s bearish reversal – Why HNT could drop below $6

- HNT has extended its losses amid intense selling pressure.
- After losing support at $6.70, HNT risks a steeper downtrend below $6 if buyers fail to step in.
Helium [HNT] was showing signs of an extended bearish trend after dropping by 6% within 24 hours as selling pressure took its chokehold on price.
HNT traded at $6.52 at press time, its lowest price month-to-date. The token was undergoing a correction after soaring to a multi-month high above $8 earlier this month.
HNT’s recent rally came amid the growth of the decentralized physical infrastructure network (DePIN) sector, whose market capitalization has ballooned to surpass $17 billion per Coingecko.
Will HNT drop below $6?
Traders that bought into the Helium rally are taking profits, and if this trend continues, HNT price risks further decline.
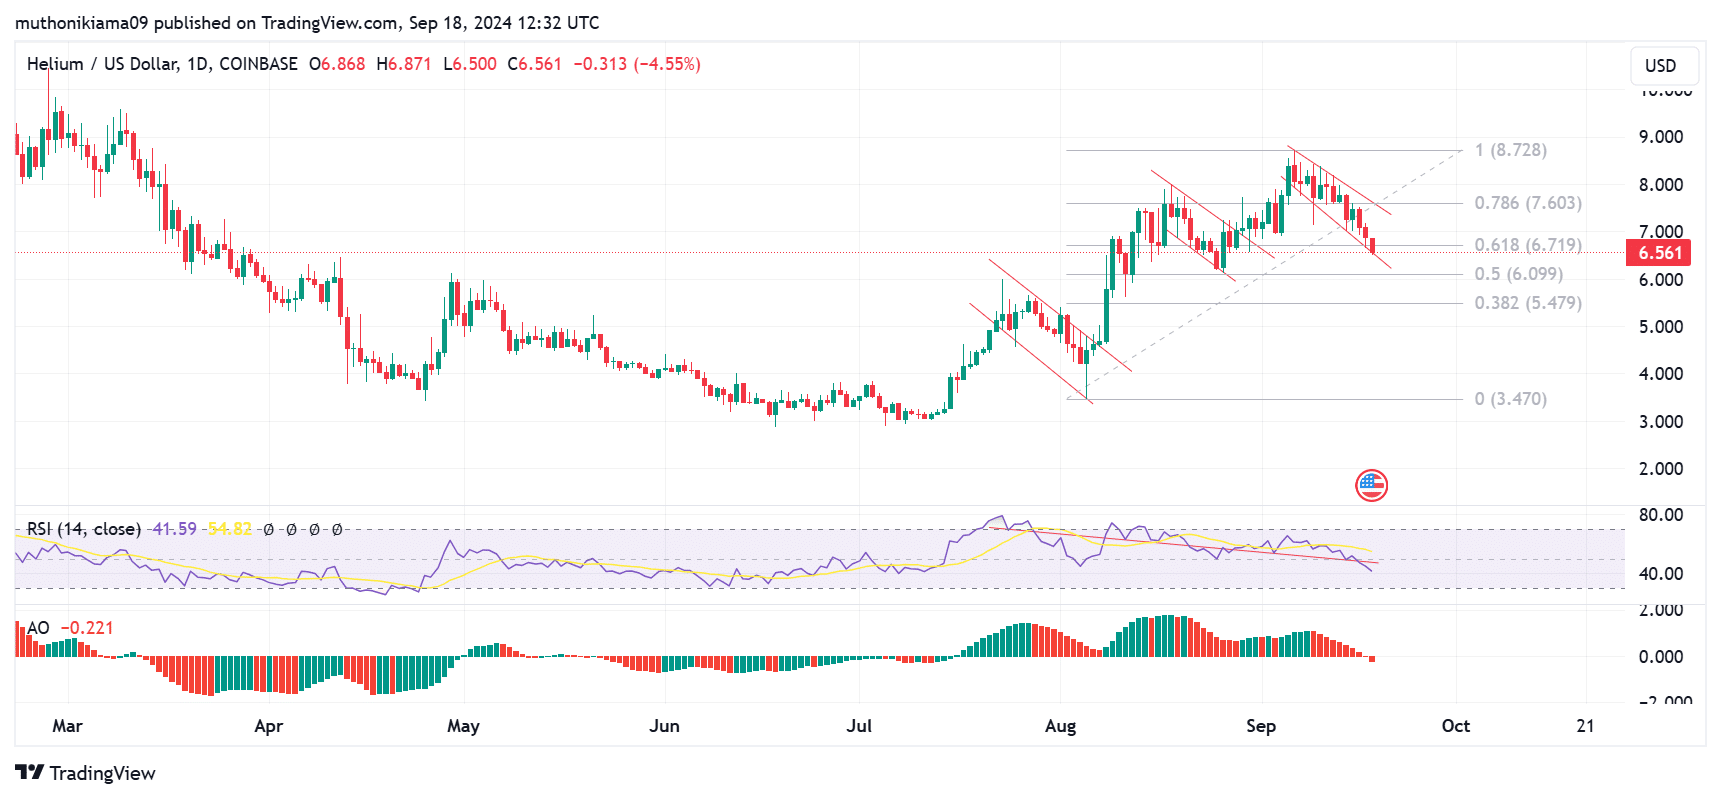
The one-day chart shows consecutive descending channels, with HNT undergoing a correction after brief rallies. This bearish formation shows that each time the price has attempted to rise, traders have suppressed the rally by taking profits.
The persistent selling activity is also seen in the movement of the Relative Strength Index (RSI), which has made lower lows. The RSI line has also dropped further below the signal line indicating that the bearish momentum is strong.
With the RSI at 41, HNT is yet to be oversold. However, after losing support at the 0.618 Fibonacci level ($6.70), HNT price risks dropping further below $6. This level has also acted as a strong support in the past, and if it fails to hold, a drop towards $5.47 is likely.
The Awesome Oscillator (AO) further strengthens the bearish thesis. The AO has dropped below the zero line for the first time since mid-July. This shows that sellers are gaining strength and HNT could continue to move lower.
On-chain data appears bearish
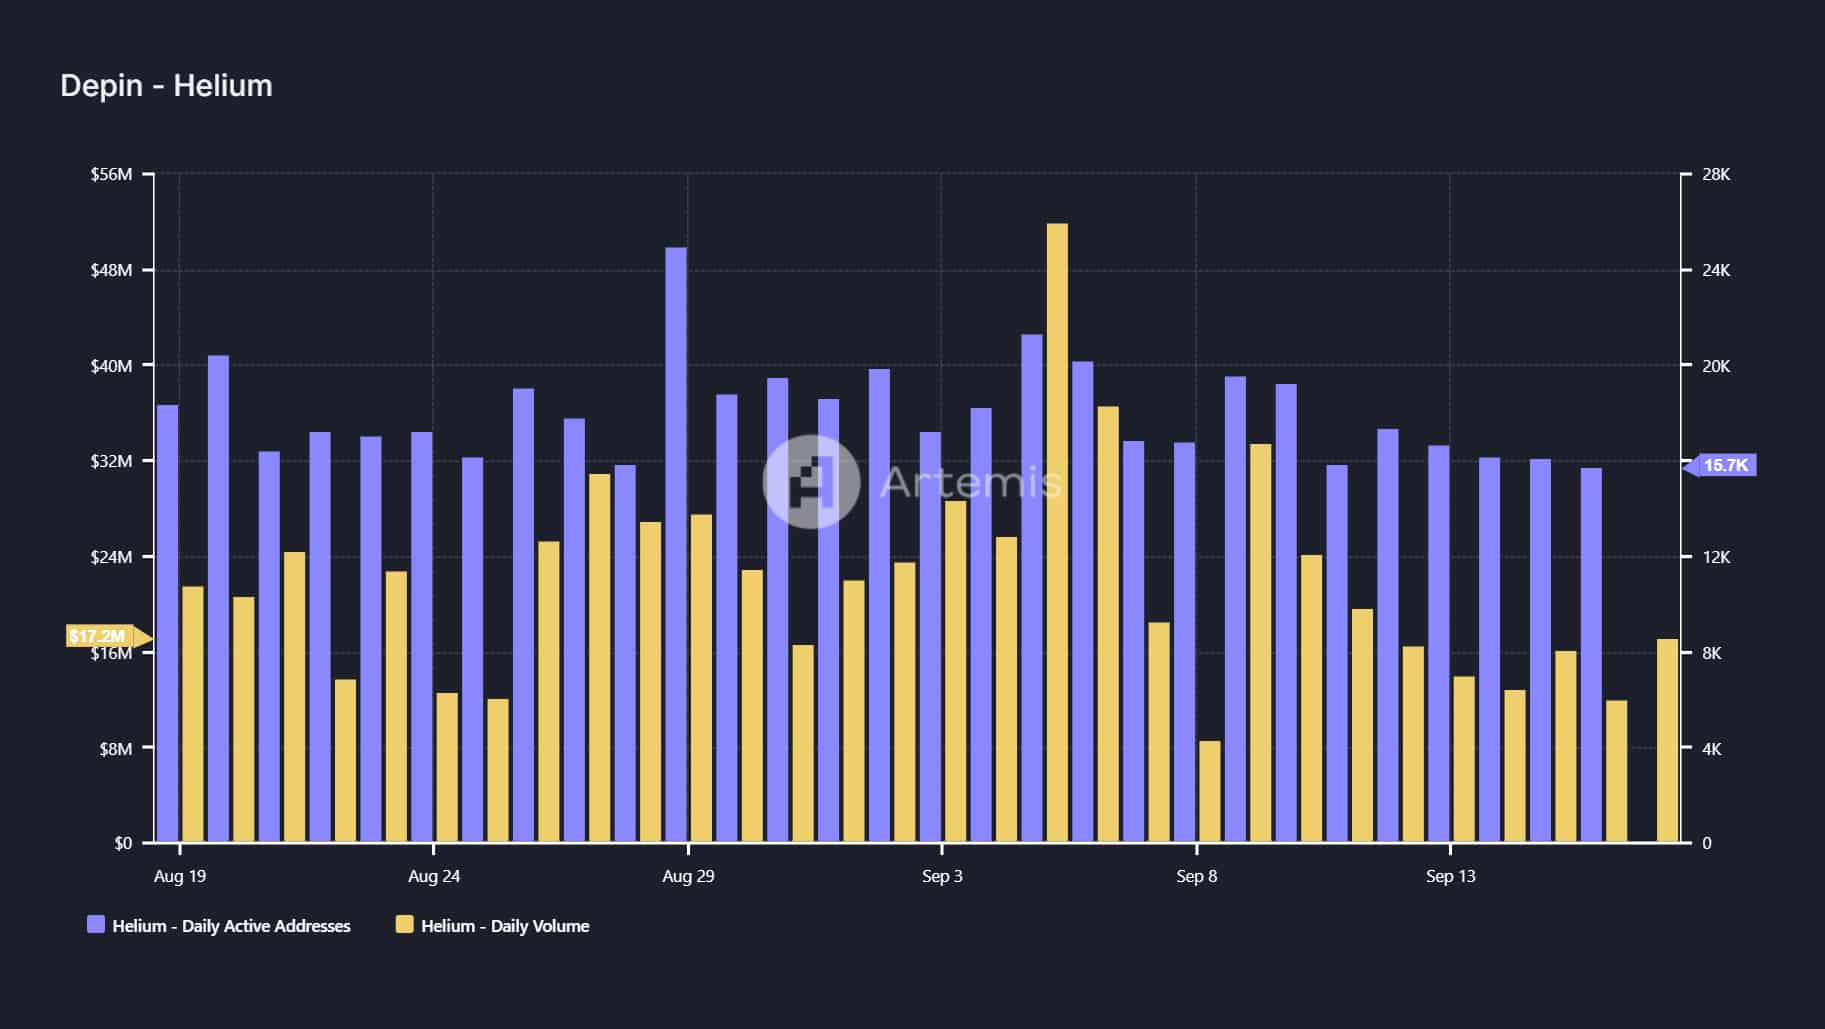
Activity on the Helium network is also showing bearish signals. Data from Artemis shows that the daily active addresses have fallen to 15,700, the lowest level this month.
At the same time, the daily volumes have increased, given that on 17th September, this metric jumped by $5 million to $17 million.
Read Helium’s [HNT] Price Prediction 2024–2025
An increase in volumes shows that the short-term trading activity is high. However, as the price is not rising alongside these volumes, it strengthens the argument of intense selling activity, further dampening the long-term price outlook.
Data from Coinglass also shows that the long/short ratio has dropped to a record low of 0.74. This indicates that most traders are expecting the price to drop further and have taken short positions on HNT.


![Algorand [ALGO]](https://ambcrypto.com/wp-content/uploads/2025/05/EE821387-E6C9-4C21-A2AC-84C983248D2F-400x240.webp)


