Helium’s [HNT] latest test opens door to these possibilities

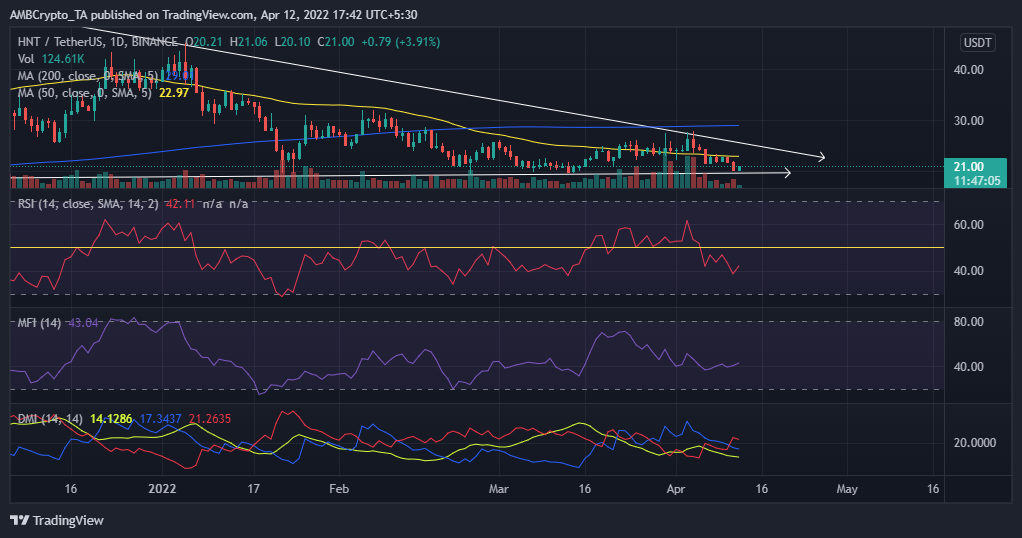
Helium’s native cryptocurrency HNT has sold off significantly since its historic all-time-high of $59 in November 2021. Interestingly, a closer inspection reveals that it has been trading in a wedge pattern. One restricted by a descending resistance line and a structural support.
Here’s what the charts say
HNT’s price action over the last 10 days also reveals a retest of resistance around the $27-level last week. The retest concluded the cryptocurrency’s bull run from mid-March and marked the beginning of a bearish weekly performance.
Judging by the ongoing retracement, it looks like the bears have now retested support at the $22-level.
Here, it’s worth looking at HNT’s past performance too. According to the same, the $22-price level is a tried and tested structural support level. Furthermore, while the price was not oversold on the 1-day chart, the situation seemed different on the 4-hour chart.
As per the 4-hour chart, the price has enjoyed an uptick over the last few hours after briefly being oversold. Its MFI registered significant inflows after briefly being oversold, while the DMI registered a decrease in bullish momentum.
Finally, some of HNT’s on-chain metrics seemed to correlate with the bounce back from support. Its volume and market cap have declined significantly over the last 7 days and this was reflected in its bearish performance.
However, the same metrics have also recorded a significant uptick in the last 24 hours, with the same corresponding with the cryptocurrency’s current price action.
Accounting for HNT’s latest performance
HNT’s bearish price action, by and large, has correlated with the wider market’s performance. It might also have been aided by a notable drop in proof-of-coverage witness activity last week. This was around the same time HNT bears took over the price charts.
Worth pointing out, however, that at press time, Helium had confirmed improved activity after adding extra seed nodes.
HNT’s price outlook
HNT is currently in a tight zone courtesy of the support and resistance convergence. This means that a breakout is imminent, but its direction will likely be subject to market sentiments. Favorable market conditions may lead to a bullish breakout.
On the contrary, more FUD could trigger further sell-offs, leading to a breakout below current support.


