Here are the conditions for an Ethereum Classic rally

Disclaimer: The findings of the following analysis are the sole opinions of the writer and should not be taken as investment advice
Ethereum Classic’s movement has been rather quiet of late. While its larger competitor Ethereum rallied to a near 2-month high, ETC has continued to form lower peaks since 19 May. On the plus side, higher lows were also seen, something that gave rise to a symmetrical triangle.
Ergo, a key breakout could develop in the coming days, presenting chances of the next rally. At the time of writing, Ethereum Classic was trading at $51, with the crypto holding the 18th position on CoinMarketCap’s crypto-rankings.
Ethereum Classic 12-hour Chart
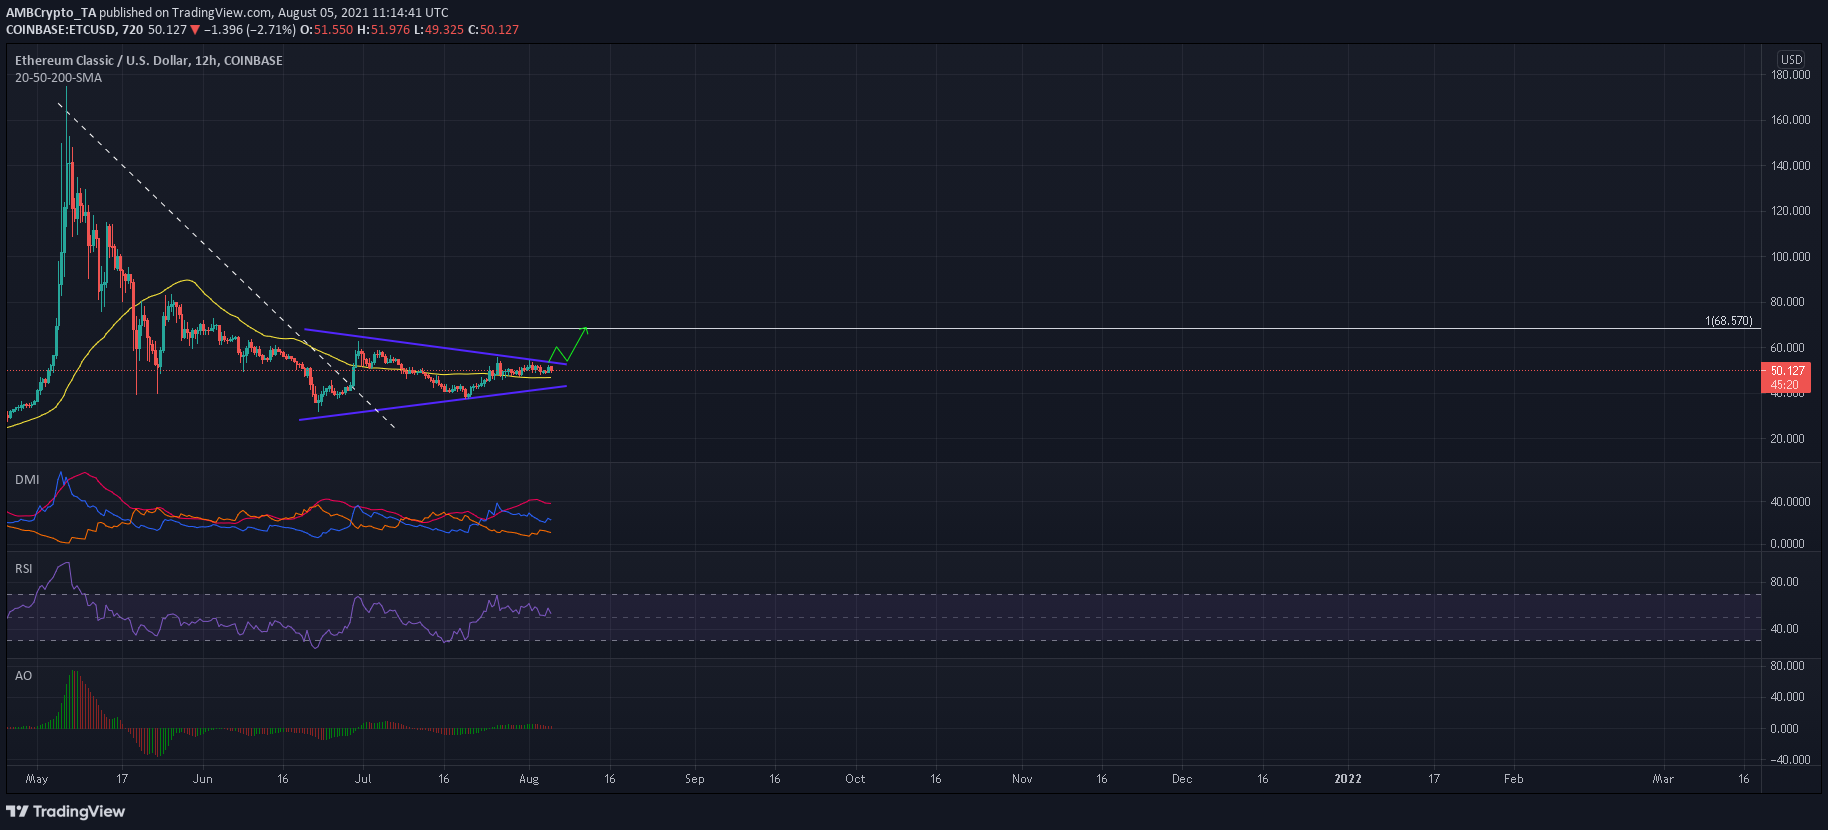
ETC’s rally post 22 June was important as the candlesticks rose above their upper sloping trendline which extended from its May peak. However, a downtrend was still active on its chart. Isolating ETC’s move post late June showed the formation of a symmetrical triangle characterized by higher lows and lower highs.
Usually, this setup sees a break in the direction of the preceding trend but broader market cues took precedence. In case BTC moves above the $42k price level, the sentiment could trigger a 31% hike to ETC’s 100% Fib Extension ($68.5) of its June low. Conversely, a close below the 12-hour 50-SMA (yellow) would invalidate this scenario and extend the symmetrical triangle.
Reasoning
The indicators still held key levels, but there were signs of weakening. The RSI was on a downtrend and a move below 50-45 would increase the chances of a further decline. The Awesome Oscillator formed a slight bearish divergence after bullish momentum receded in the market. On the other hand, the DMI maintained a bullish position as the +DI remained above the -DI.
Conclusion
Ethereum Classic’s charts pictured chances of a 29% rally in the coming days in case of a symmetrical triangle breakout. Long trades can be set up once the price closes above the 26 July high of $56. Meanwhile, traders must also be cautious of a close below the 50-SMA (yellow) as this would negate ETC’s bullish prediction.