Here is why MATIC traders can expect selling pressure to increase at $1.03

Disclaimer: The information presented does not constitute financial, investment, trading, or other types of advice and is solely the writer’s opinion.
- The $1.05 has posed stern resistance in the past two weeks.
- A revisit to the 12-hour bullish breaker and Fibonacci retracement level could be expected.
Polygon [MATIC] saw bullish sentiment rise in recent weeks. On-chain metrics showed a large uptick in the number of new users, and the price action of the native asset also highlighted strong demand behind the rally.
Read Polygon’s [MATIC] Price Prediction 2023-24
While the higher timeframe bias remained bullish, MATIC formed a lower timeframe range. At the time of writing, it approached the highs of this range, making another rejection likely.
The ten-day range has been respected so far, traders can look to enter short positions
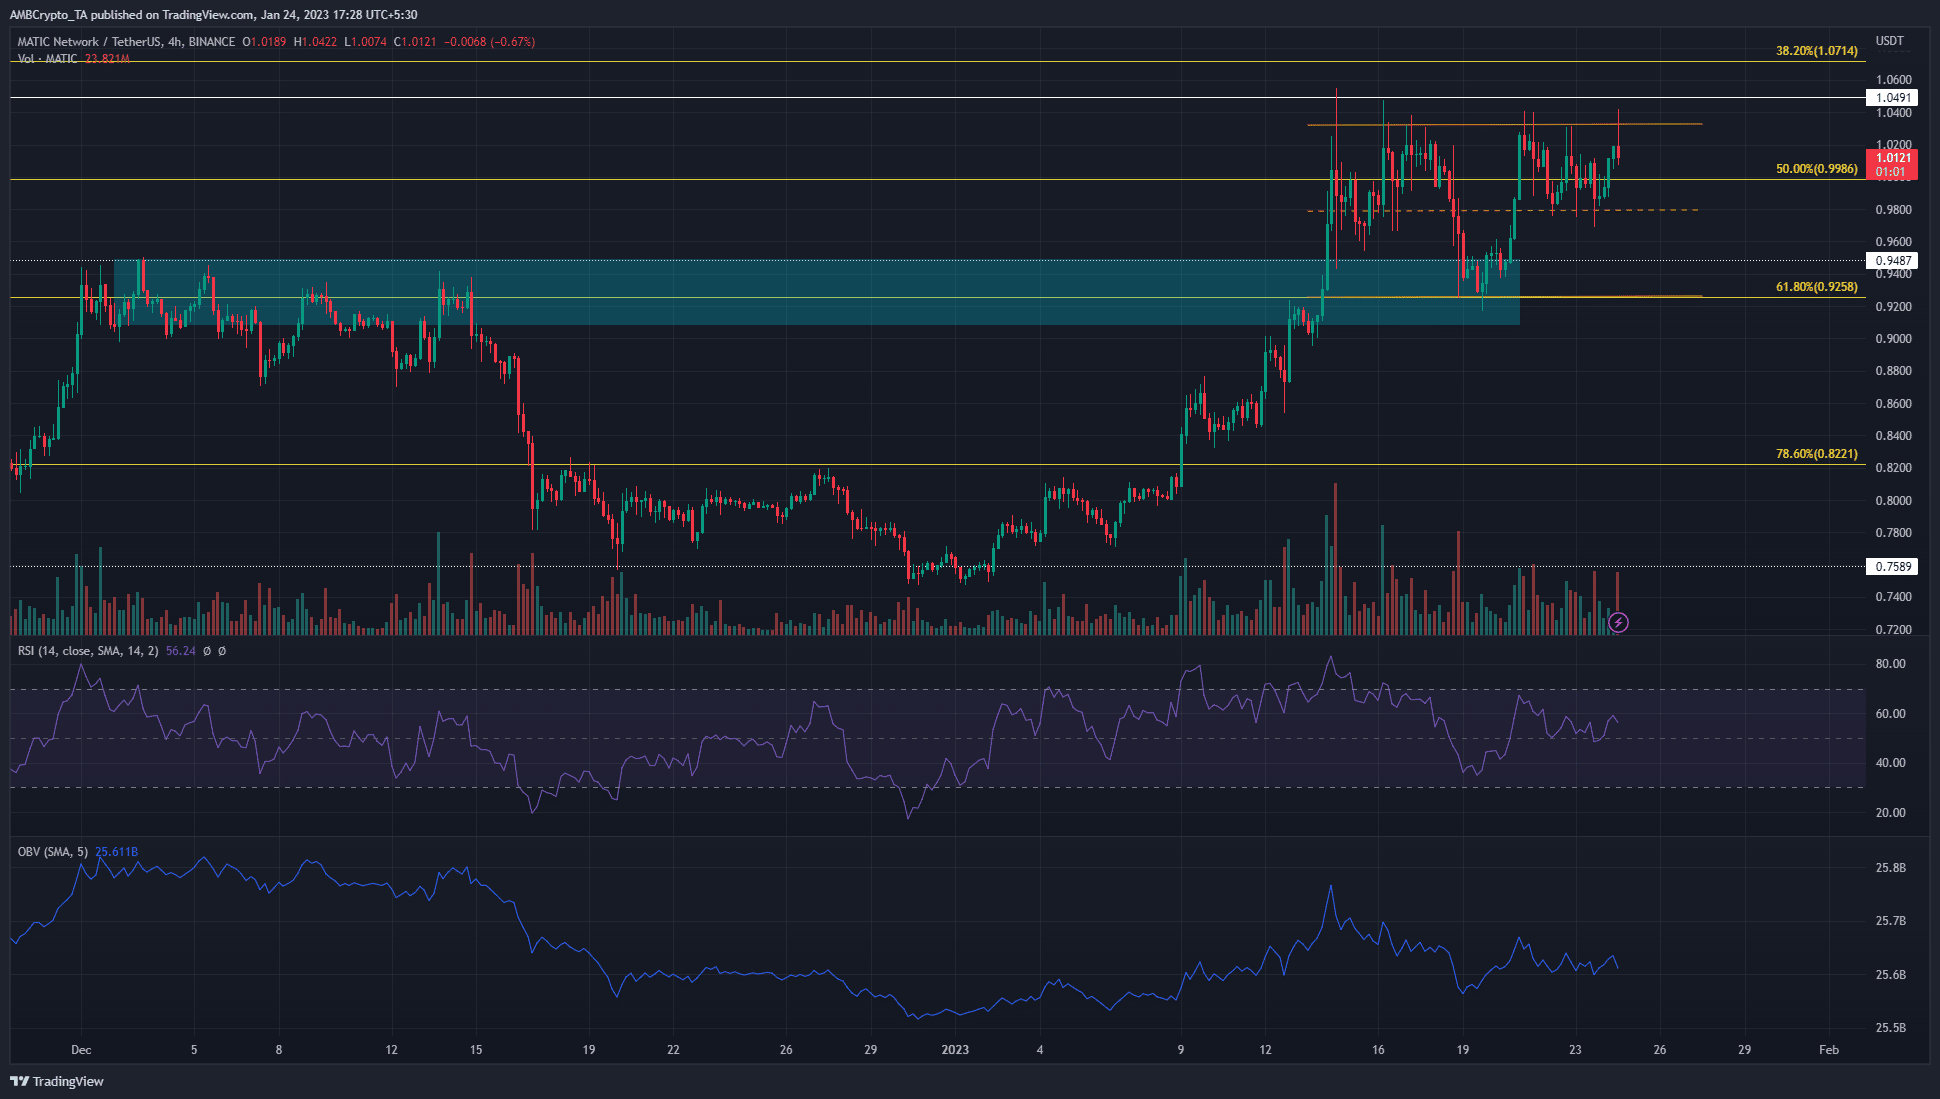
A range between $0.92 and $1.03 was highlighted in orange. MATIC has traded within this range for the past 10 days. The lower extreme of the range coincided with a bullish breaker (cyan) from early December on the 12-hour chart.
The upper boundary has seen many candlewicks as high as $1.05, but no four-hour session closed above it in the past two weeks. Although a breakout was still possible, it was better to trade within the range than to seek a breakout.
Is your portfolio green? Check the Polygon Profit Calculator
The RSI has formed lower highs in the past week, as has the OBV. This indicated muted buying strength. Until the liquidity pocket at $1.03-$1.05 is broken by a session close above $1.05, traders can look to short MATIC in that area. The profit targets are the mid-range mark at $0.98 and the range low at $0.92.
Futures market participants remain bullish
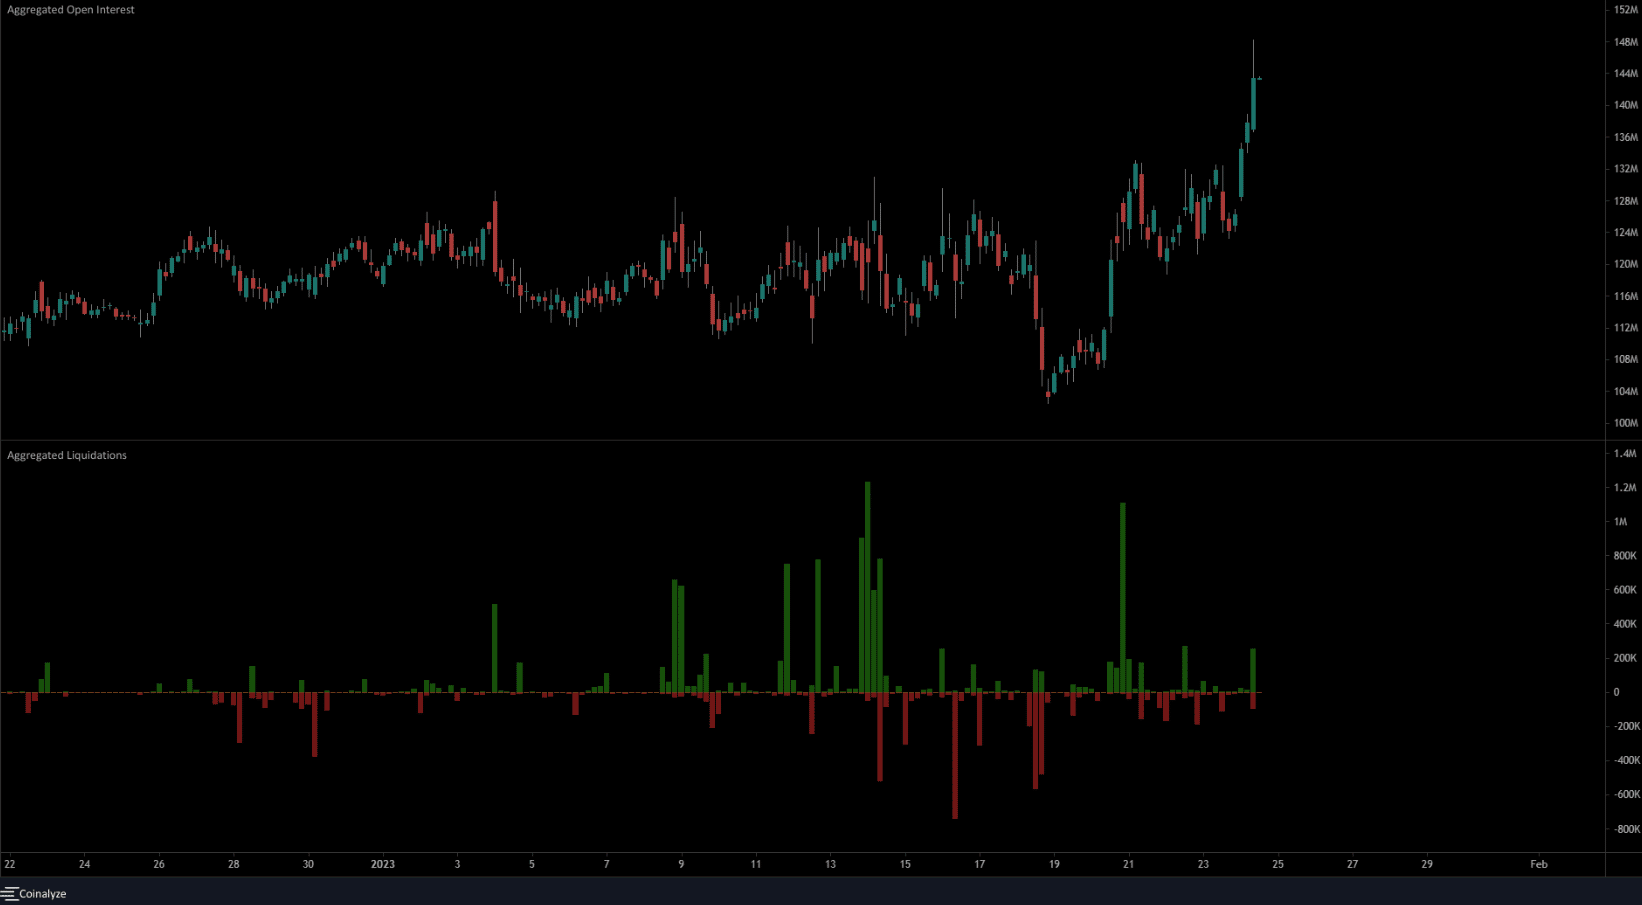
On 19 January, the price revisited the range lows and the 12-hour bullish breaker at $0.92. The very next day, MATIC bounced to the range high and caused numerous short positions to be liquidated. Coinalyze’s data showed that $1.11 million worth of short positions liquidated within a four-hour session on January 20.
The inference was that the move south to $0.92 invited a lot of bearish attention. The violent surge upward that followed wiped them out. This also reinforced the strength of the range extremes. A retest of the $0.92-$0.93 levels could thus be used to buy MATIC.