
- Bitcoin continued its descending channel trajectory on the daily chart.
- The recent gains helped the coin trigger a golden cross on its EMAs.
Bitcoin [BTC] oscillated within a well-established down-channel for over seven months. After bouncing off the $53.8K support level earlier this month, BTC has rallied nearly 18%, pushing toward the channel’s upper boundary.
The crucial question is whether the bulls can push beyond this resistance to initiate a breakout or succumb to another downward.
At press time, BTC traded at around $63,446. The recent price action showed a tug-of-war between buyers and sellers, with Bitcoin hovering around the edge of the pattern.
Rebounding from key support
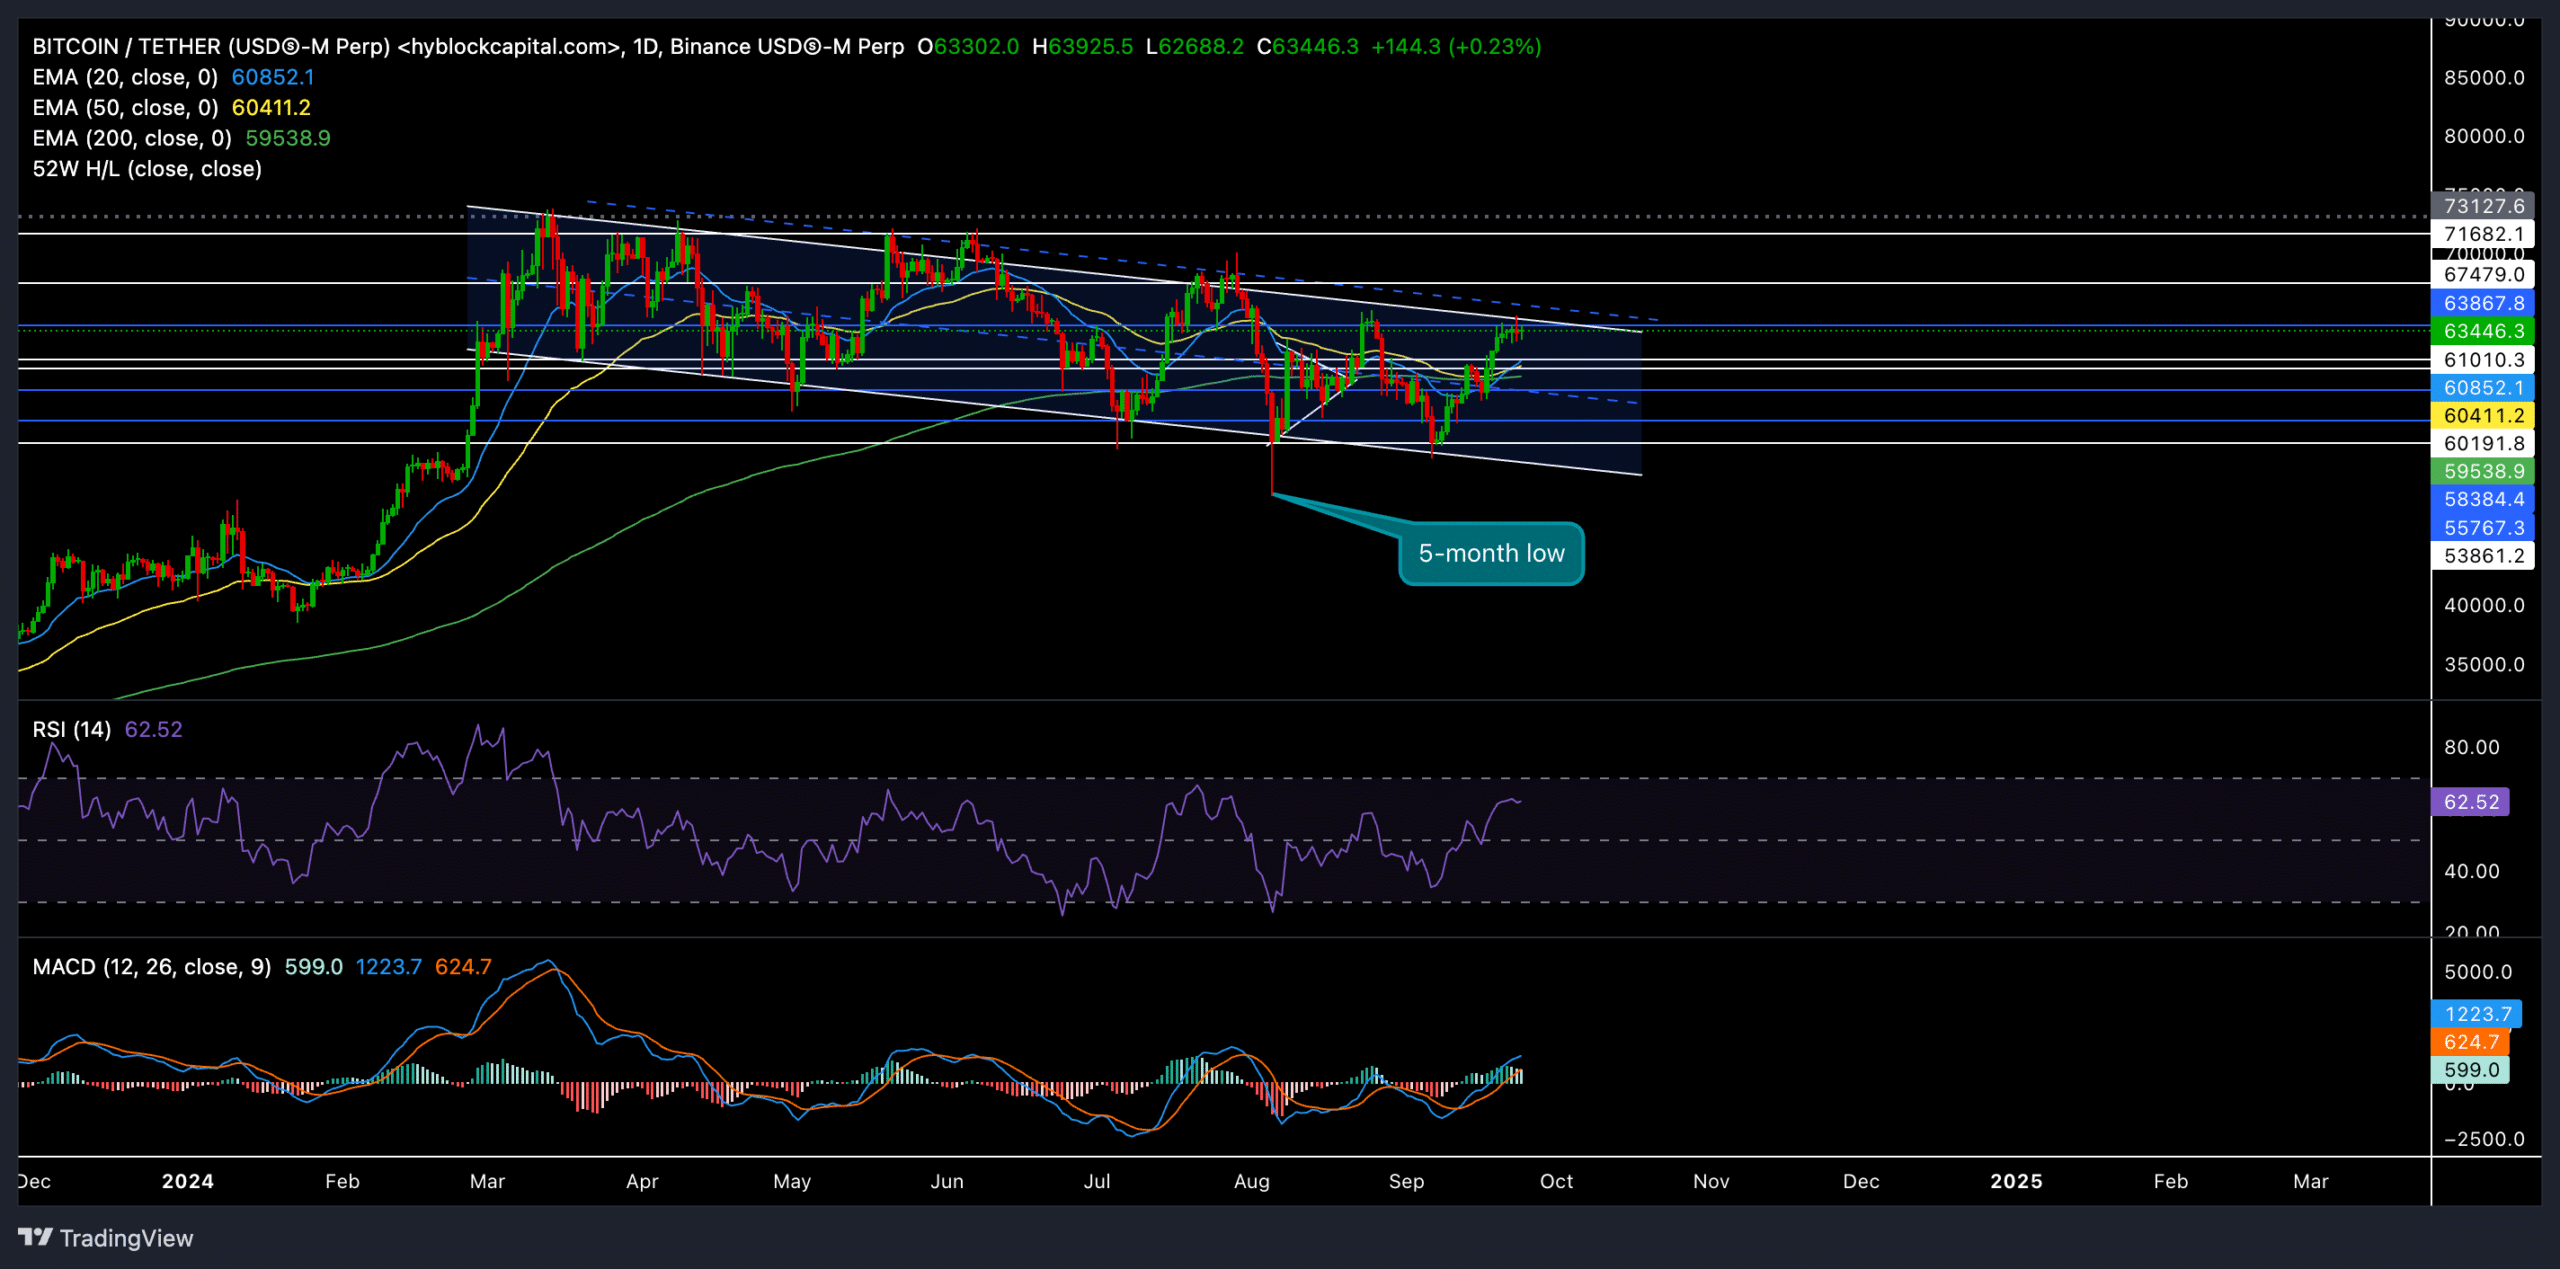
Source: TradingView, BTC/USDT
It’s worth mentioning that the 20-day EMA recently crossed above the 200-day EMA, confirming a ‘golden cross’ on the daily chart. The empirical tendencies of the king coin show how a continued upside on the chart usually follows such a crossover.
A breakout above this level could set the stage for a sustained rally toward the $67,000 – $70,000 range.
However, the price was yet to break the upper boundary of the down channel. If buyers cannot push through, it may trigger a short-term pullback. A rejection from here could lead to a pullback toward $60,000 or even $55,838.
The RSI stood at around 62.52 at the time of writing. It hovered above the neutral 50 mark to depict a strong bullish edge but was yet to touch the overbought mark. This showed there is still room for upside if the bulls sustain their momentum.
It’s important to note that RSI marked higher highs alongside flatter highs on price action. This highlights the chances of a potential bearish divergence with price.
On the other hand, the MACD (Moving Average Convergence Divergence) indicator reaffirmed the bullish momentum, with the MACD line remaining above the signal line.
Derivatives data revealed THIS

Source: Coinglass
BTC’s volume dropped by 19.93% to $47.39B, reflecting a relatively weak daily movement. Similarly, open interest decreased by 0.58% to suggest that traders hesitated to commit to new positions at current levels.
The long/short ratio for the last 24 hours was slightly bearish at 0.9869. This indicated a balanced sentiment with a slight edge for short positions.
Read Bitcoin’s [BTC] Price Prediction 2024–2025
However, top traders on Binance showed more confidence in the bulls with a long/short ratio of 1.0172.
The golden cross between the 20-day and 200-day EMAs hinted at bullish potential but traders should watch for confirmation with a close above the upper boundary of the down channel.


