Here’s how Cardano can break away from its bearish shackles

Cardano has been in a constant downtrend since early-September and has struggled to recover lost ground even during broader market rallies. The last rally was observed between 5-10 November, although bulls were unable to clear the 38.2% Fibonacci level.
Over the near-term, ADA could continue its consolidation and expect traders to shift back to long positions once ADA closes above $2.30. At the time of writing, ADA traded at $2.06, up by 1.2% over the last 24 hours.
Cardano Daily Chart
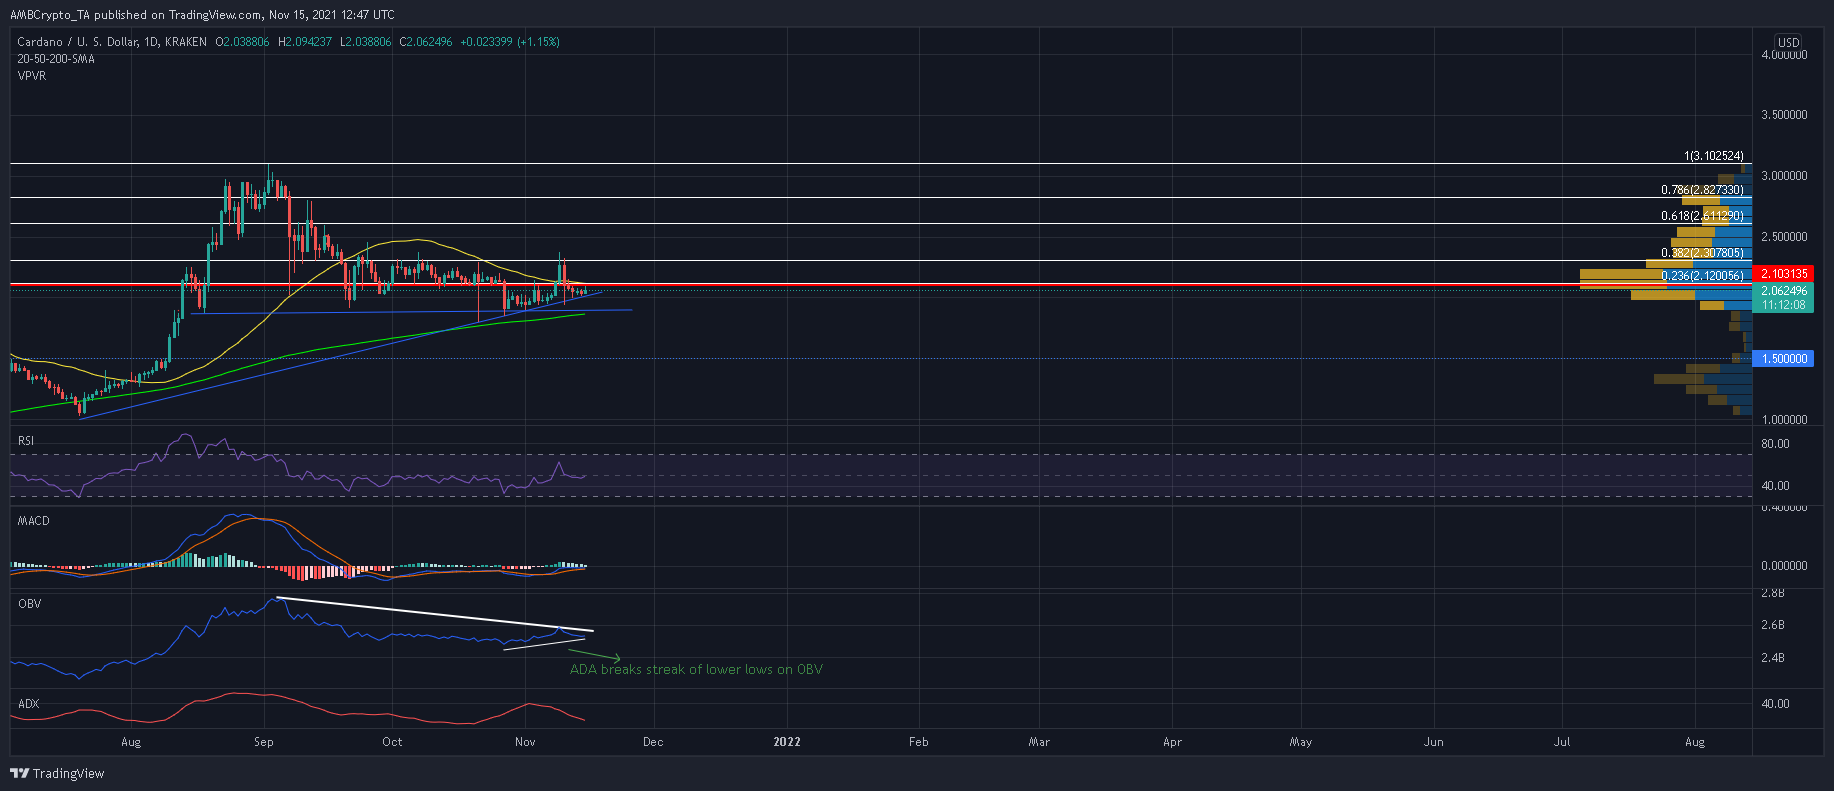
A look at ADA’s On Balance Volume’ downtrend shows that selling pressure has increased significantly. Especially since the price hit record levels at $3.09 in early-September. However, the OBV did break away from its streak of lower lows and has attempted a comeback since late-October, but was yet to break above an upper sloping trendline.
Should a revival in buying pressure push ADA above the confluence of the 50-SMA (yellow), 23.6% Fibonacci level and Visible Range’s POC at $2.10, the next rally can be anticipated. ADA would also need to scale past the 38.2% Fibonacci level convincingly to liquidate short positions in the market. Meanwhile, its near-term trajectory was protected by two lower trendlines and the 200-SMA (green), which often lends support during a downtrend.
On the downside, expect short-sellers to enter the fray once ADA slips below its long term moving average line. From there, a major defensive line at $1.50 could be called into action should ADA continue its southbound trajectory over the next couple of weeks.
Reasoning
Since 10 September, ADA’s RSI has shifted above its half-line only once due to persistent selling pressure in the market. While the index has formed higher lows, such setups have been negated over the past month. Similarly, the MACD has also been restricted below its equilibrium and still flashed a bearish-bias.
On the plus side, an ADX reading of 23 indicated that the market was becoming less directional and a large sell-off was unlikely should the broader market remain risk-on.
Conclusion
There was not much to expect from ADA’s price trajectory till it recovers above a strong resistance at the 38.2% Fibonacci level. Even though bulls were making some headway according to the OBV, the RSI and MACD were yet to recover above their mid-lines. However, a weakening ADX reading did mean that bears were losing control and a major drawdown was off the table for the time-being.