Cardano to $1 – What might be the price trajectory?

Disclaimer: The findings of the following analysis are the sole opinions of the writer and should not be considered investment advice
After struggling to overturn its 20 EMA (red) for nearly six weeks, Cardano (ADA) bulls finally flipped it from resistance to support after the recent rally.
A potential close above the 50 EMA (cyan) would brace ADA for a test of its long-term liquidity range (Point of Control/POC) near the $1-mark. On the flip side, a close its immediate resistance can cause a pullback towards the 20 EMA before continuing its upward movement. At press time, ADA traded at $0.949, up by 5.88% in the last 24 hours.
ADA Daily Chart
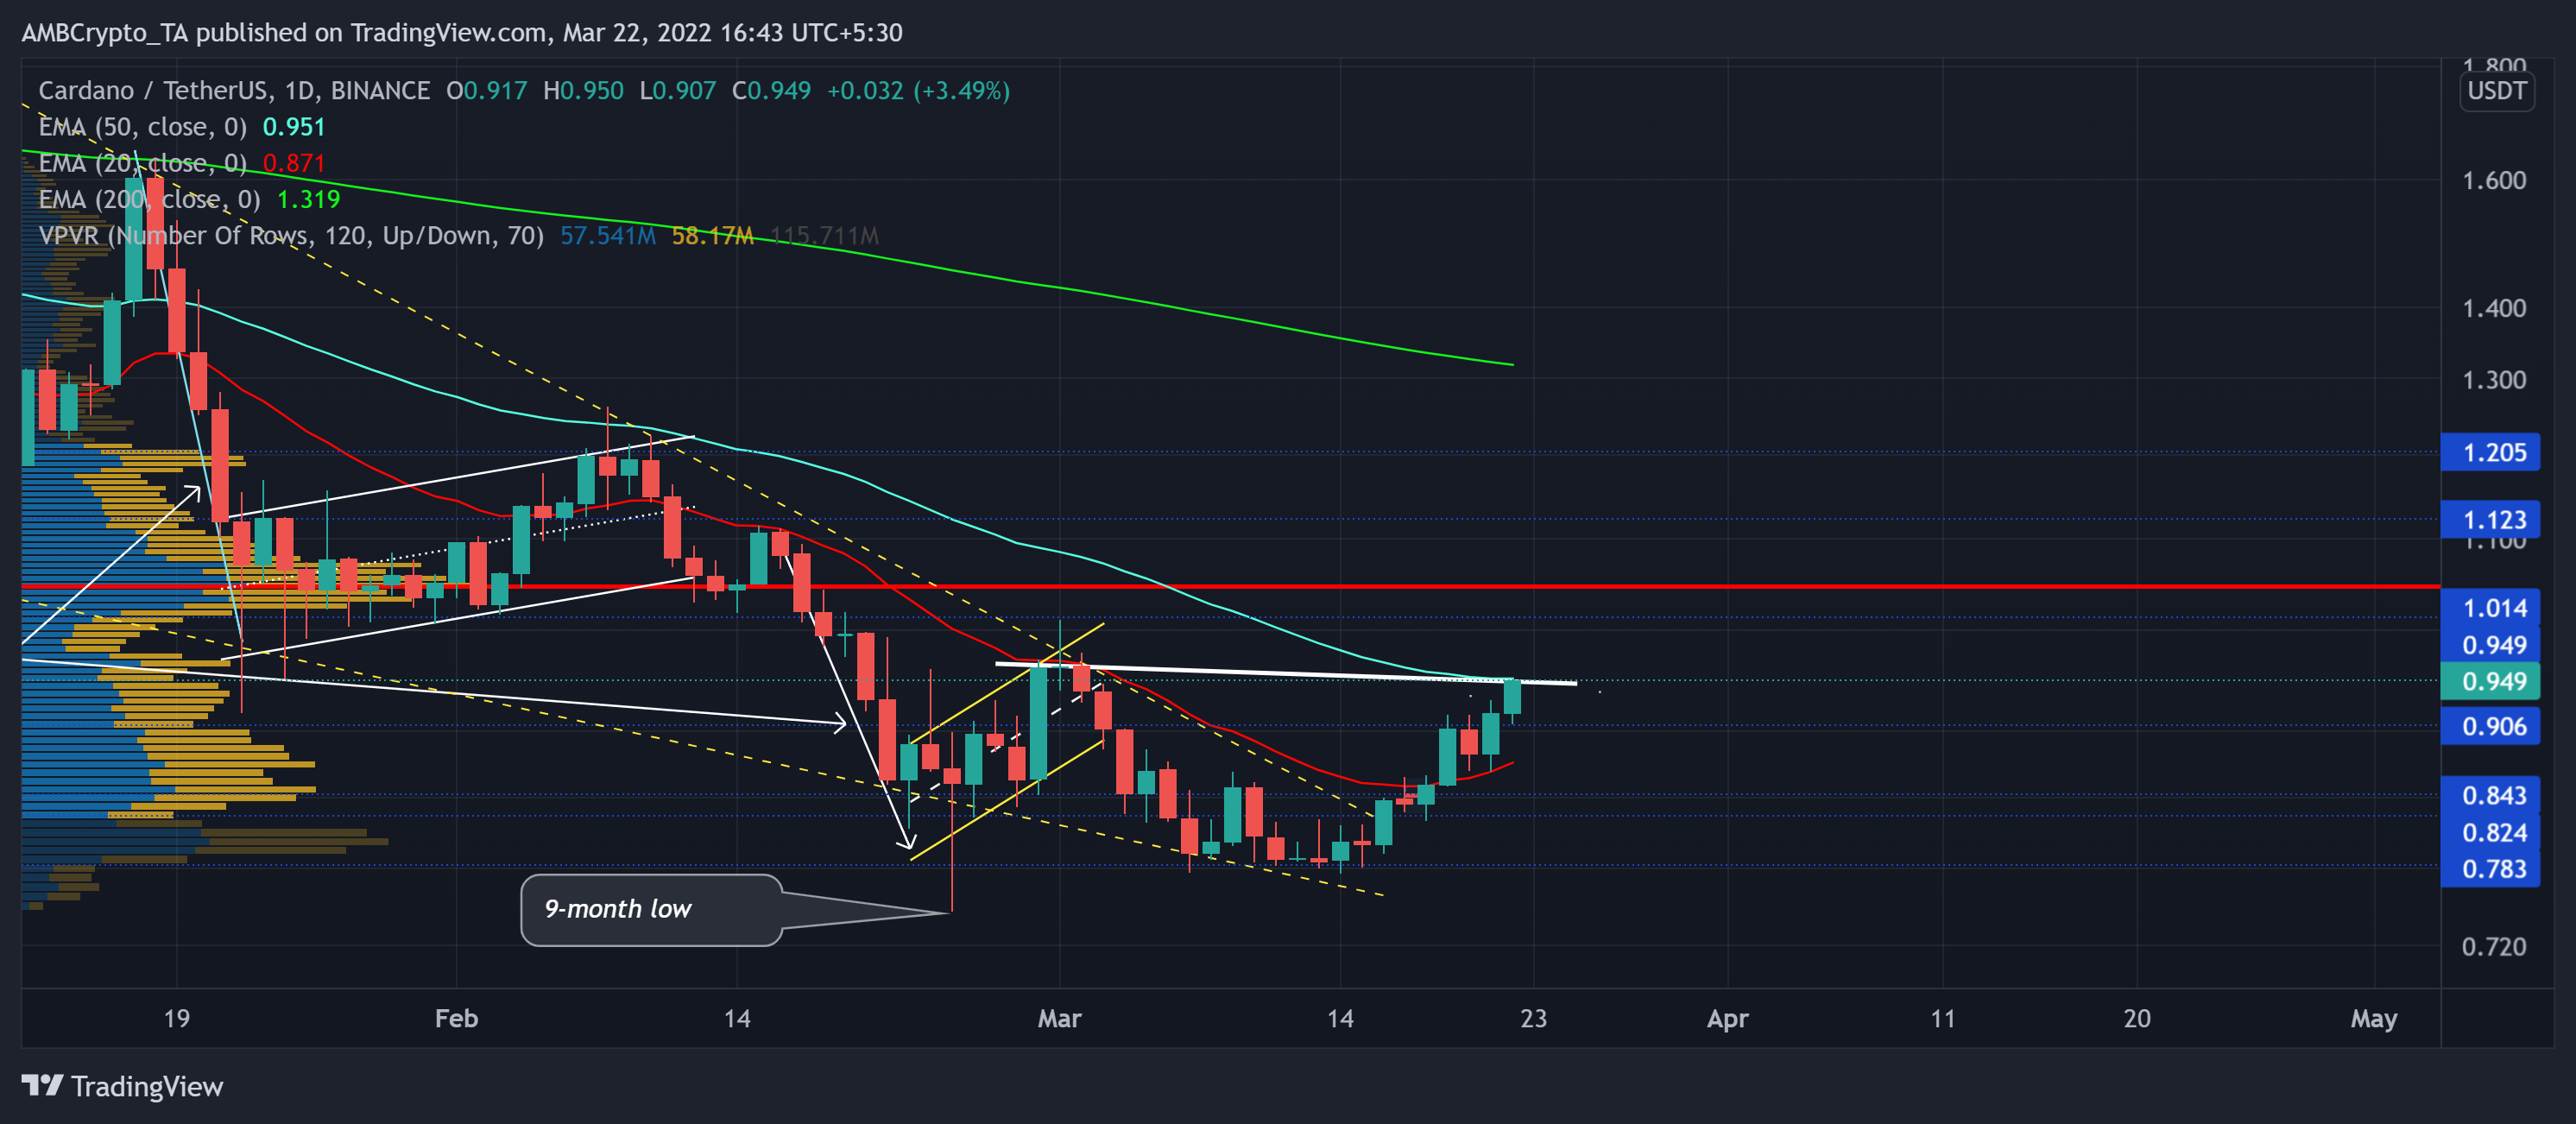
ADA formed seven-month-long trendline support (yellow, dashed) while the alt was on a steep downtrend. Consequently, it has lost nearly 70% of its value since its ATH and formed a falling wedge over the last three months on its daily chart.
Interestingly, the $0.783 support has stood as a testing floor for nearly 13 months. Thus, after picking itself up from its nine-month-low on 24 February, the alt managed to break out of the falling wedge. In the last two days, the gap between the 20 EMA and 50 EMA has improved in favor of bulls.
Any close above the $0.95-mark would open up recovery gates towards the $1-zone. Whereas if the 50 EMA stood sturdy, it would propel a near-term pullback. Following this, ADA would likely continue its upturn whilst the 20 EMA looked north.
Rationale
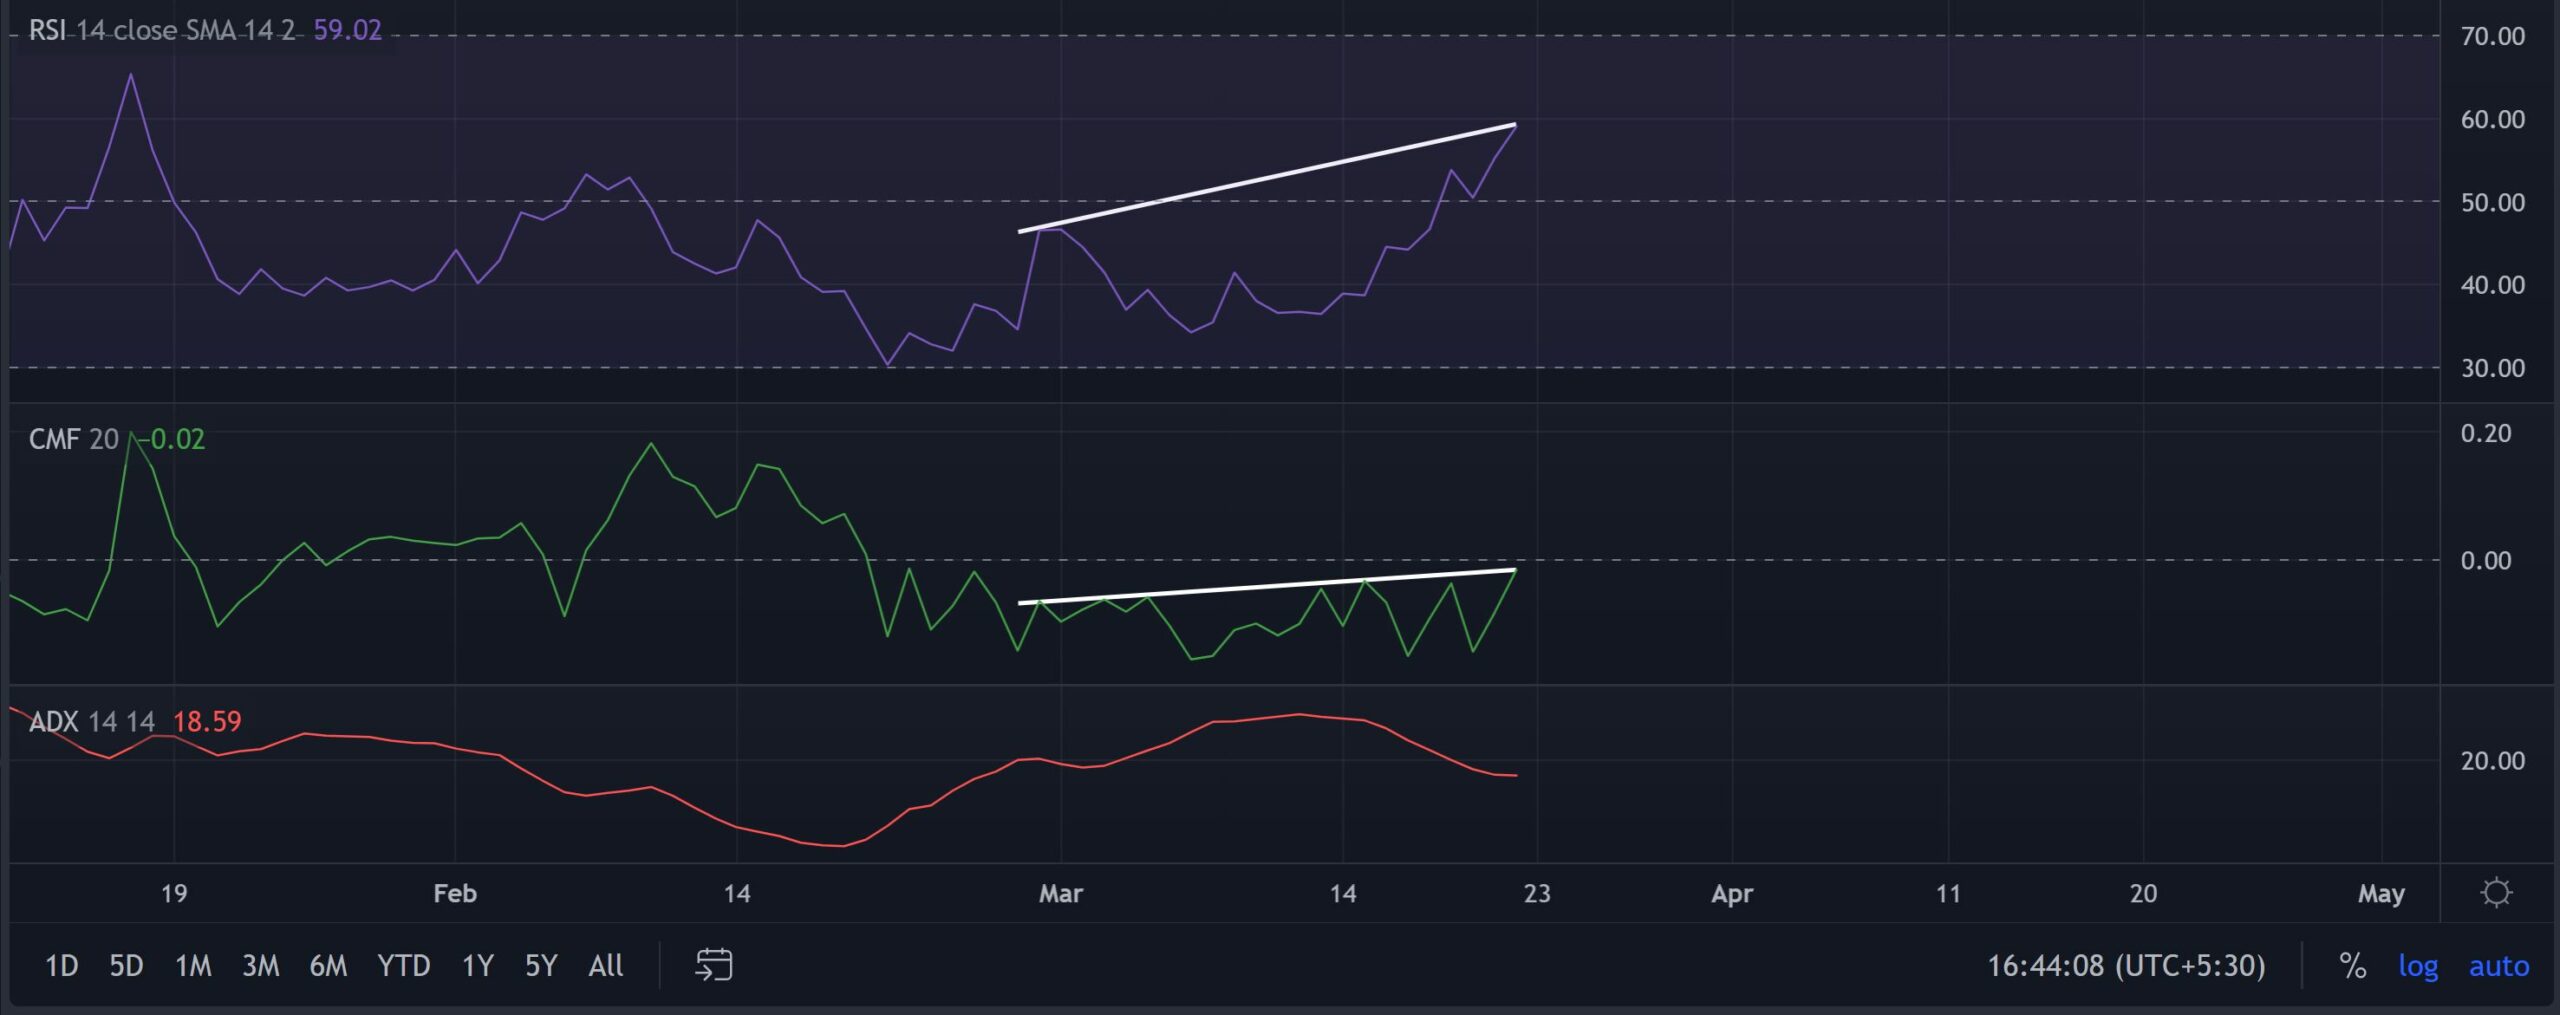
The RSI exhibited a bullish inclination after jumping above its equilibrium. Any close below its trendline resistance would confirm the existence of a hidden bearish divergence with the price. Furthermore, the CMF was yet to find a close above the zero-line.
This reading entailed that the underlying perception was yet to improve in favor of bulls. A hurdle near the zero-line could confirm a short-term bearish divergence. Nevertheless, the ADX displayed a weak directional trend for ADA.
Conclusion
ADA eyed at an eventual test of its POC near the $1-mark, but a pullback from its 50 EMA could ignite a near-term reversal. Besides, traders/investors should keep a close eye on Bitcoin’s movement as ADA shares a 77% 30-Day correlation with the king coin.