Shiba Inu

Here’s how Shiba Inu’s latest attempt to flip THIS level may succeed or fail
Posted:
Journalist

- Shiba Inu’s daily price chart had a bullish outlook as the memecoin traded under a resistance zone from June
- Liquidation levels overhead could induce a short squeeze, before a bearish reversal in the second half of October
Shiba Inu [SHIB] was trending upwards at press time, but its trading volume dropped by 4.4% in the 24 hours before press time. This accompanied a drop in whale activity too – A sign of reduced demand from SHIB whales.
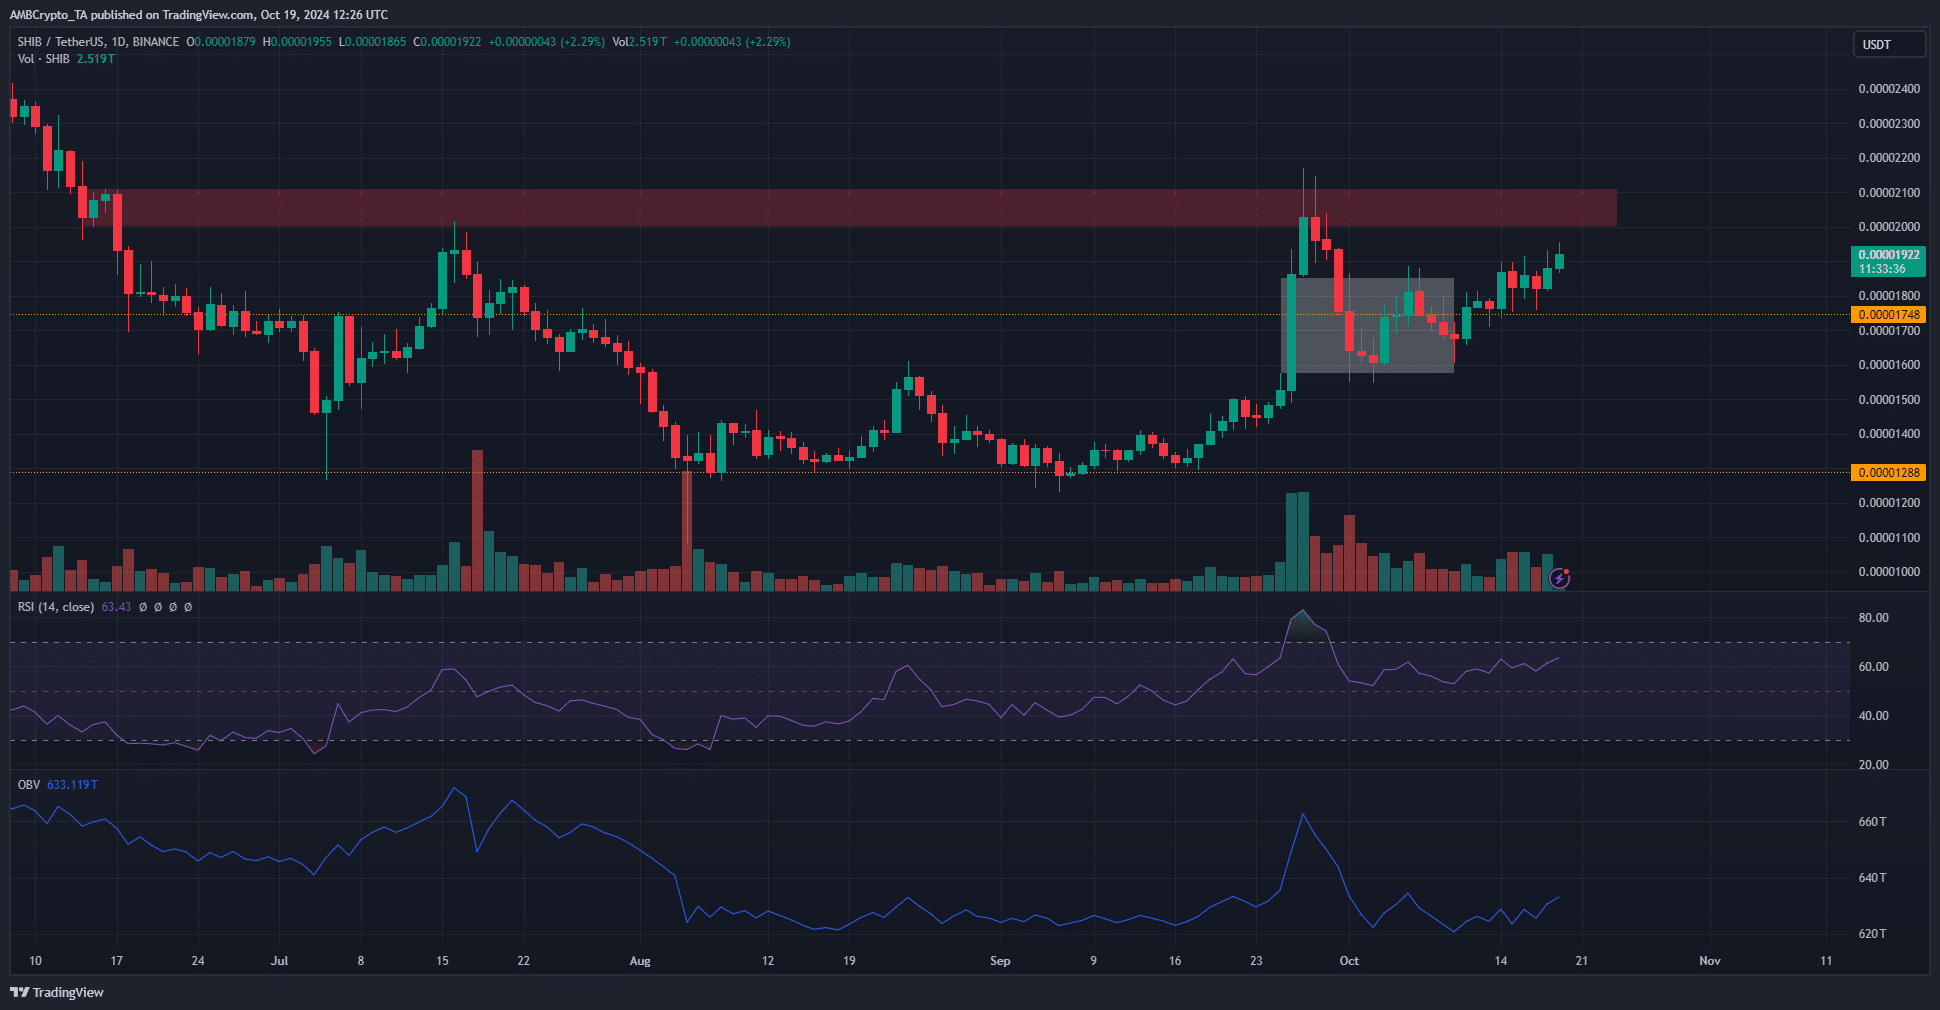
Source: SHIB/USDT on TradingView
The memecoin’s bulls made a good recovery from the retracement in early October that tested the fair value gap. The trading volume has been above the August and September average. The psychological $0.00002 resistance zone stood in the bulls’ way.
This region has been a stern obstacle since June. The RSI and market structure showed bullish dominance, but the OBV was less convincing. This lack of demand in October could stall efforts to break past the bearish order block overhead.
Falling volatility could aid investors
Source: Santiment
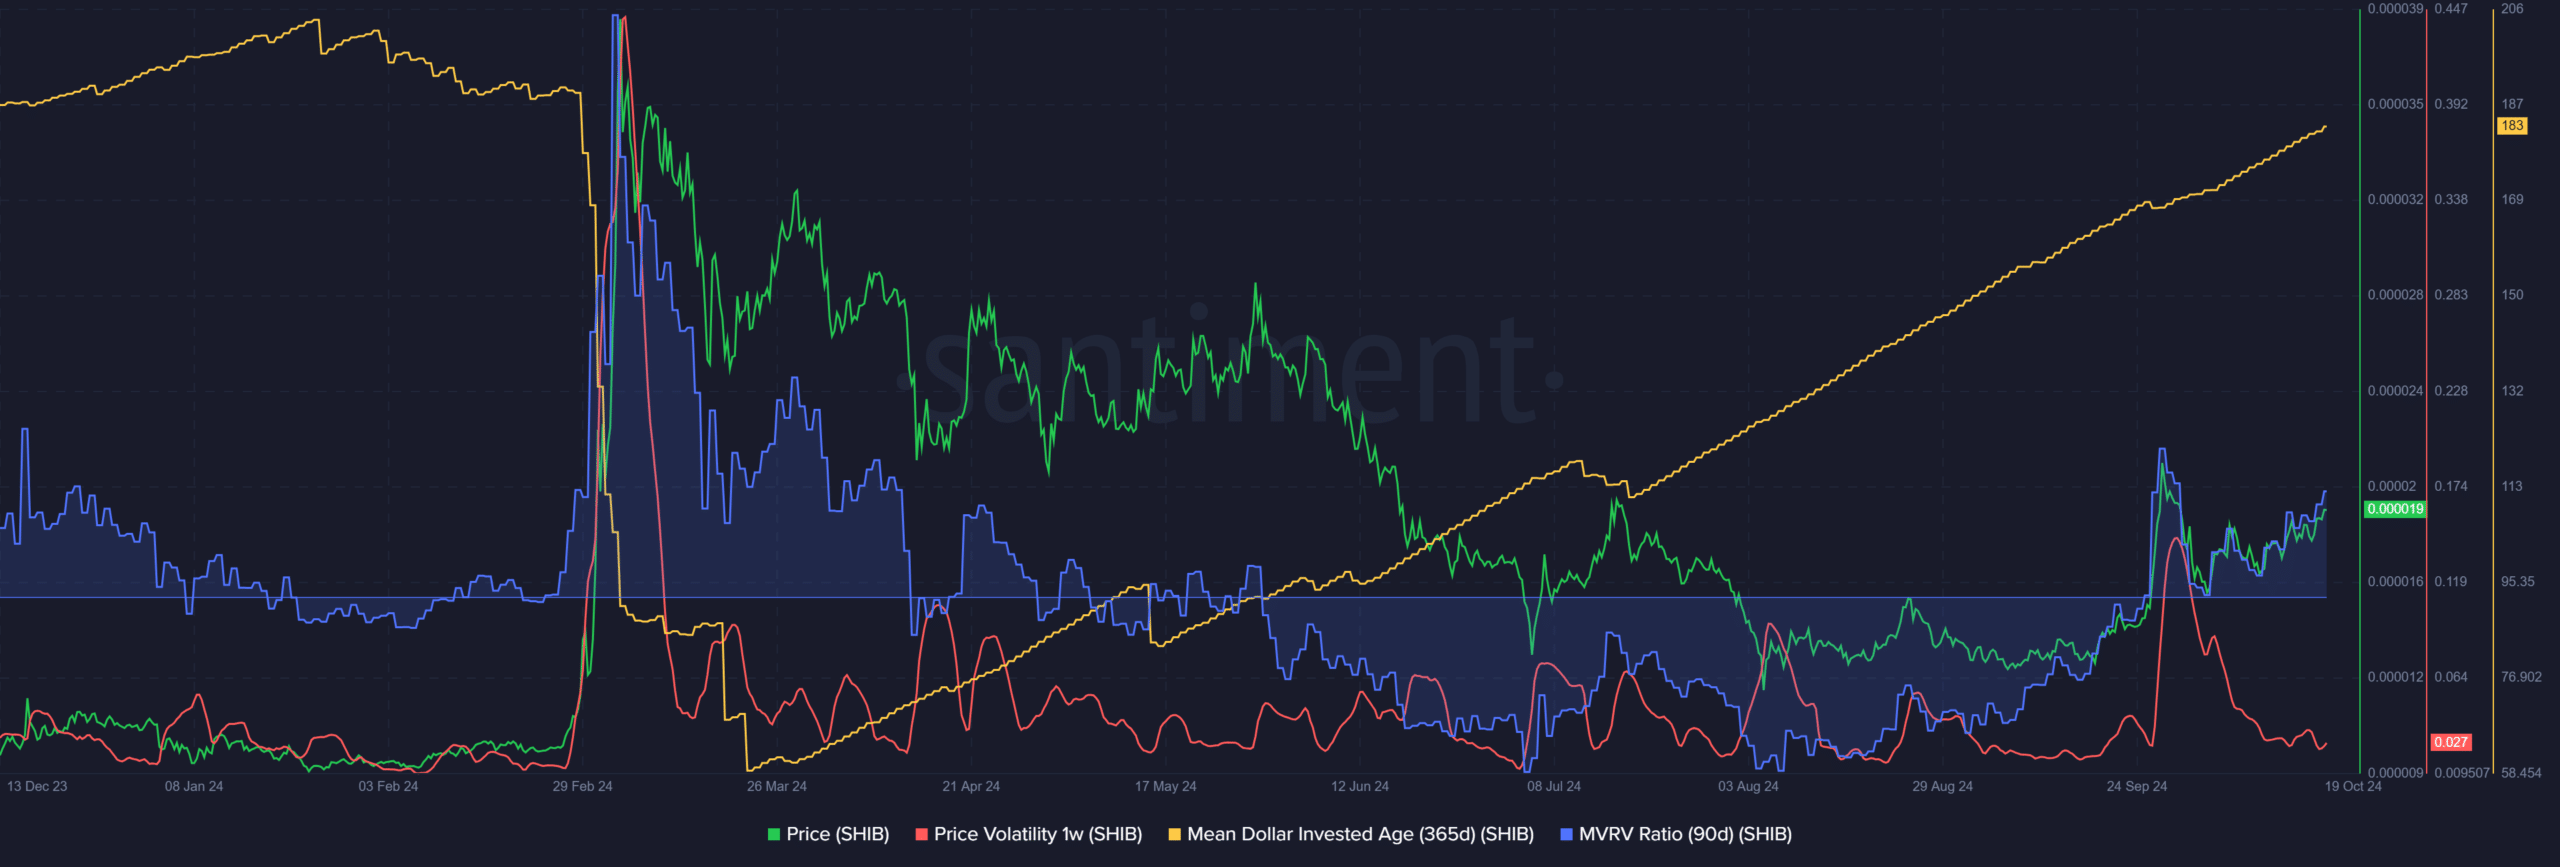
The 1-week volatility metric saw a sharp upturn in late September, but it has quieted down since. The reduced volatility is a sign of consolidation as we saw in the first half of September, before the strong rally.
The 90-day Shiba Inu MVRV ratio was trending higher, alongside the price. It raises the chances of profit-taking activity and selling pressure, but does not threaten the chances of a breakout.
Meanwhile, the Mean Dollar Invested Age was on an unrelenting uptrend at press time. It revealed that investments have been getting stagnant and old coins remained in their wallets.
Once this metric begins to fall, it would be an early sign of reduced stagnancy and could usher in a firm uptrend. This occurred in February and March earlier this year and could play out again.
Short liquidations building up above SHIB’s press time price
Source: Coinglass
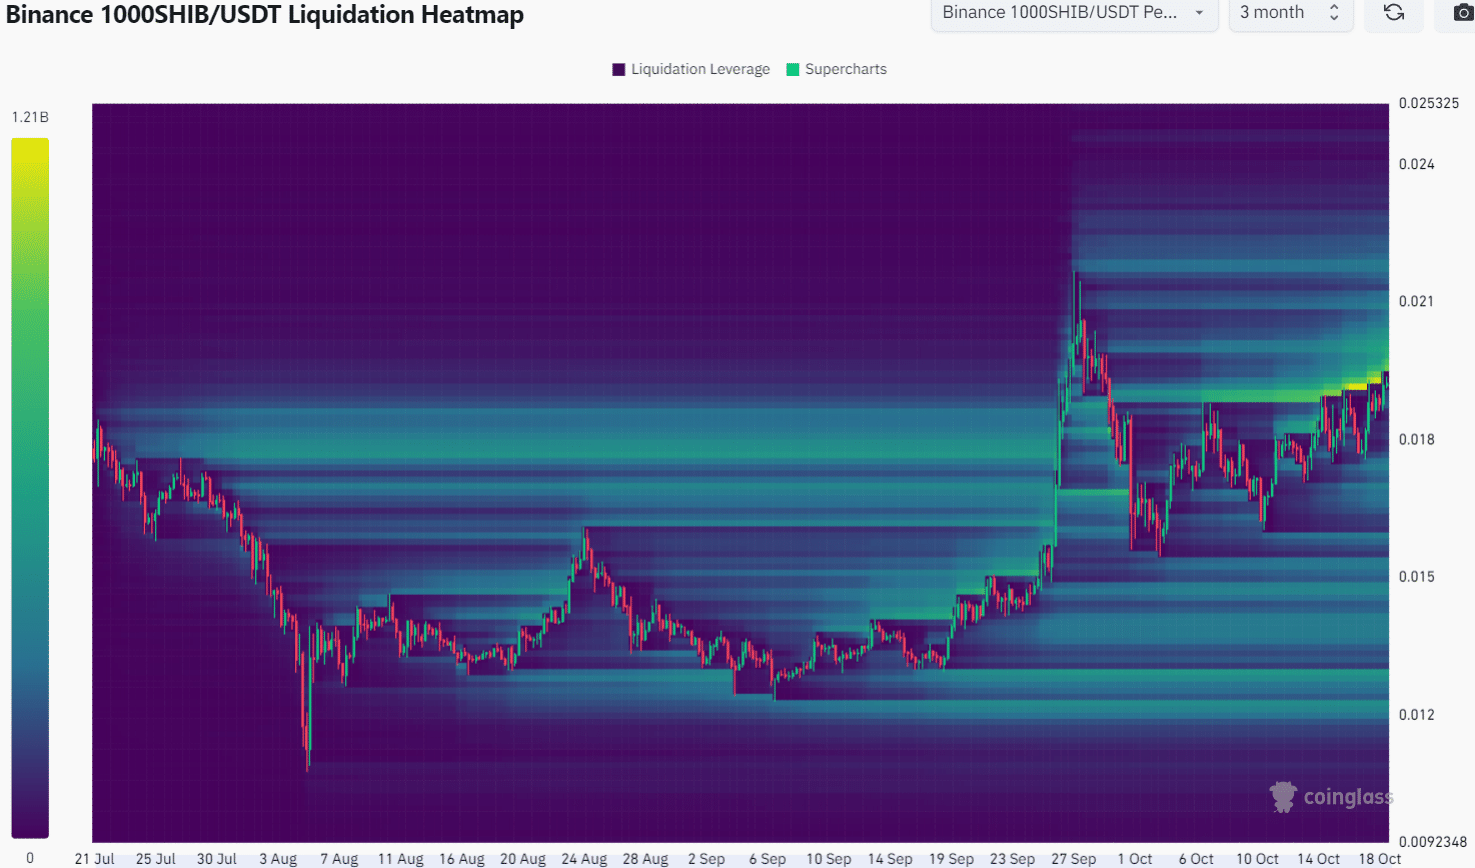
The 3-month liquidation heatmap revealed that the $0.0197-$0.0202 area (1000SHIB hence three decimal places removed) was an area of interest. This magnetic zone could push Shiba Inu north.
Is your portfolio green? Check the Shiba Inu Profit Calculator
In fact, speculators seemed noticeably willing to bet that 1000SHIB would face another rejection at $0.02. Their confidence could feed a short squeeze, but spot demand is required to sustain the memecoin’s breakout.


![Will Hedera's [HBAR] 20% hike be enough to push it past its trading range?](https://ambcrypto.com/wp-content/uploads/2025/01/HBAR-Featured-400x240.webp)