Following the collapse of TerraLUNA in May, never-before-seen attention has since been placed on stablecoins. In fact, there are many who still harbor doubts about the ‘stability’ of this class of cryptocurrency assets.
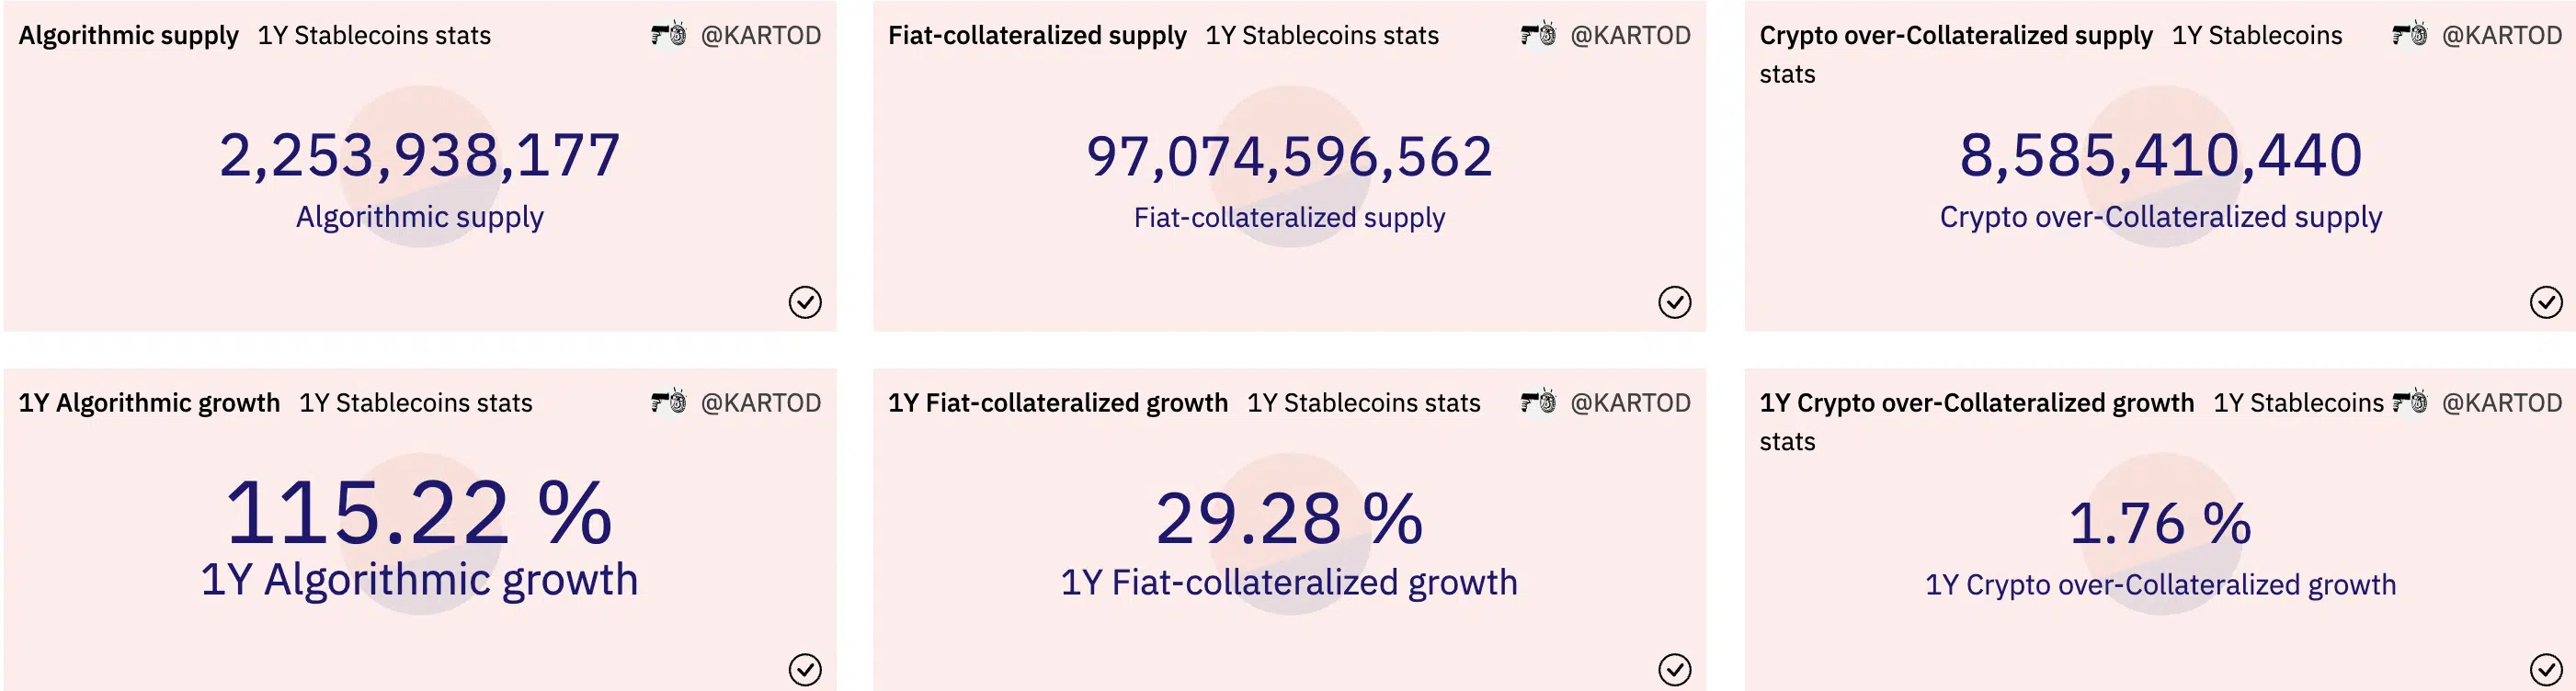
According to Dune Analytics, algorithmic stablecoins have seen the most growth over the past year. Algorithmic stablecoins, including Ampleforth, USDD, Frax, Alchemix, and even the collapsed UST, have logged a collective hike of 115.22 %. Fiat-collateralized stablecoins, on the other hand, have appreciated by 29.28 % over the same period.
Of all kinds of stablecoins (Algorithmic, fiat-collateralized, and crypto over-collateralized), algorithmic stablecoins’ supply, however, remains the lowest. According to Dune Analytics, the supply of algorithmic stablecoins in the last year stood at 2,253,938,177.
For crypto over-collateralized stablecoins, supply over the past year was pegged at 8,585,410,440. With 97,074,596,562 logged as total supply this past year, fiat-collateralized stablecoins led the pack with the most supply. The reason for this is not far-fetched. Centralized bodies float this category of stablecoins, and they have stronger reserves.
Source: Dune Analytics
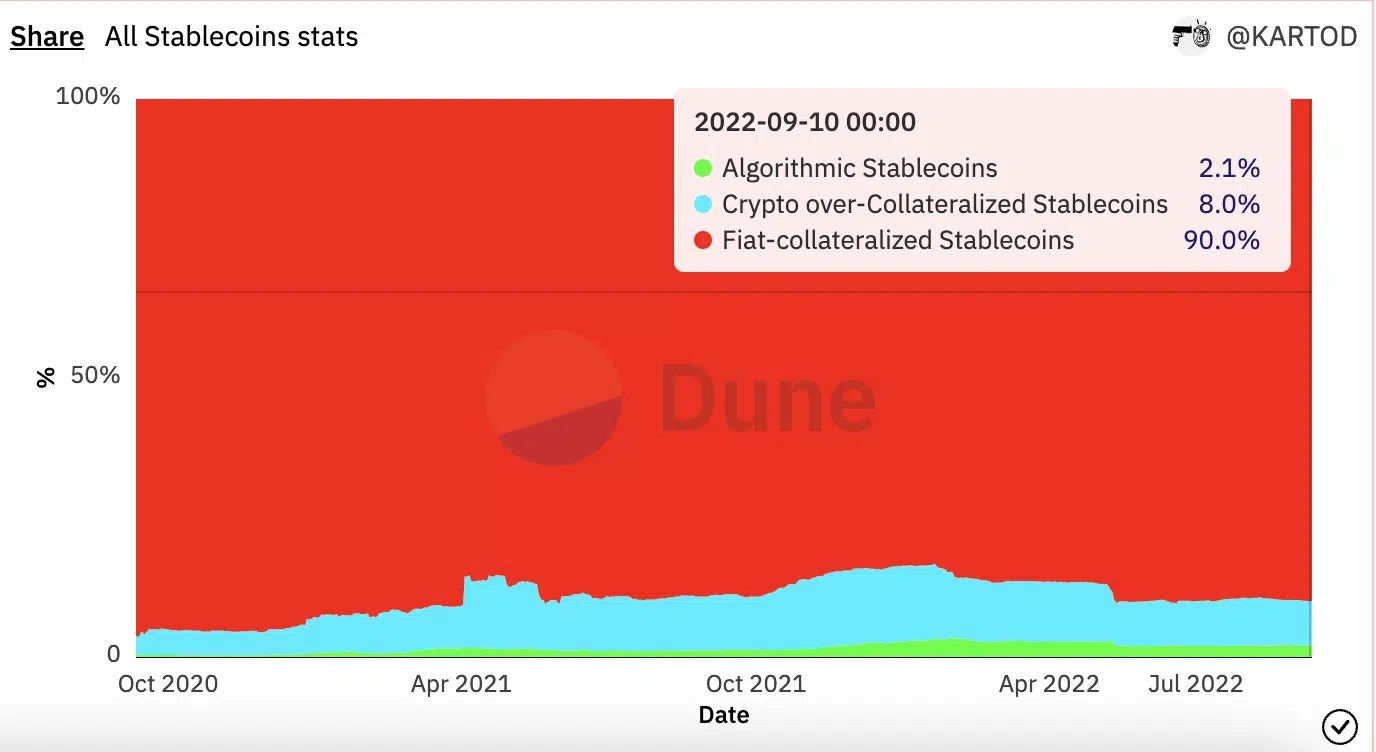
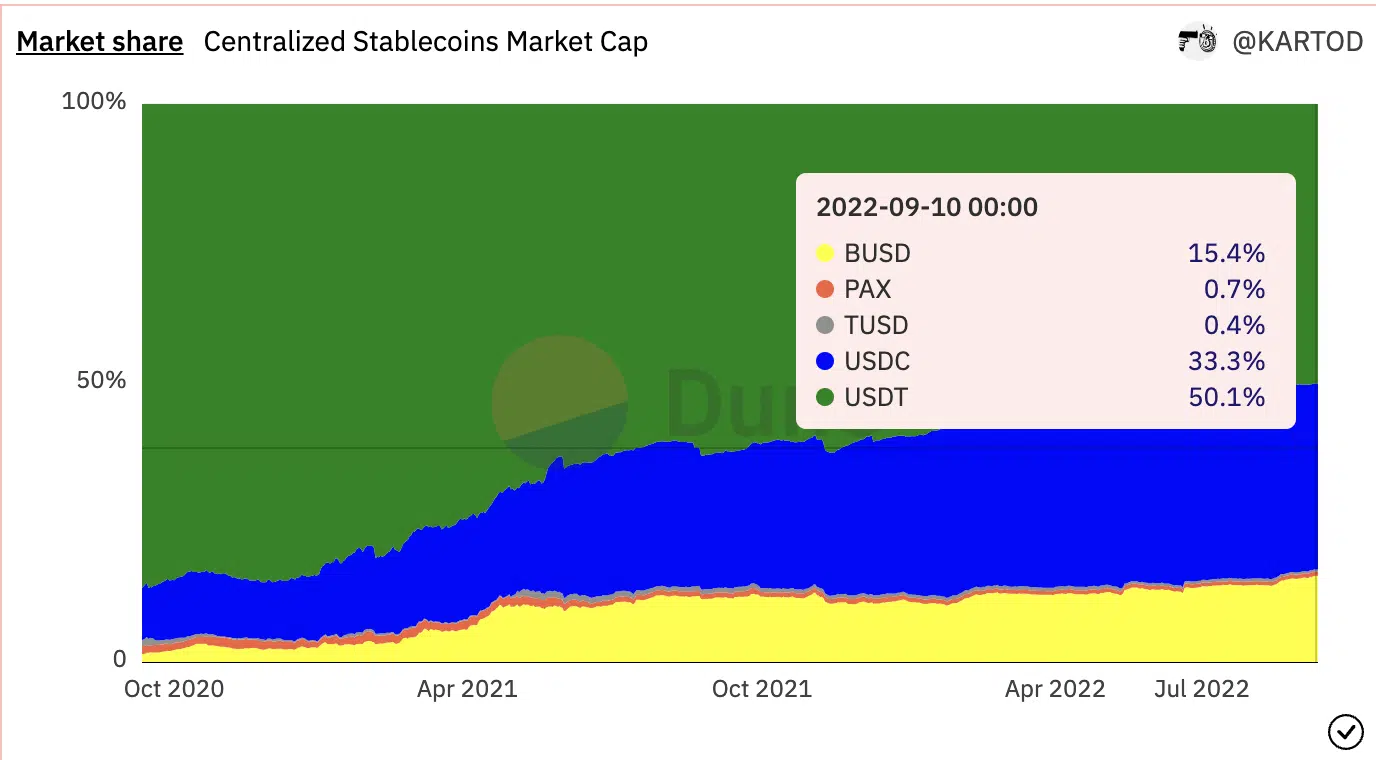
Furthermore, with 90% of the total market share, fiat-collateralized stablecoins are the most used in this category of cryptocurrency assets. In fact, this has been the case for over two years now.
Source: Dune Analytics
RIP algorithmic stablecoins
With only a 2% share of the entire stablecoin market, algorithmic stablecoins have had a difficult year, one aggravated by the collapse of Terra’s UST.
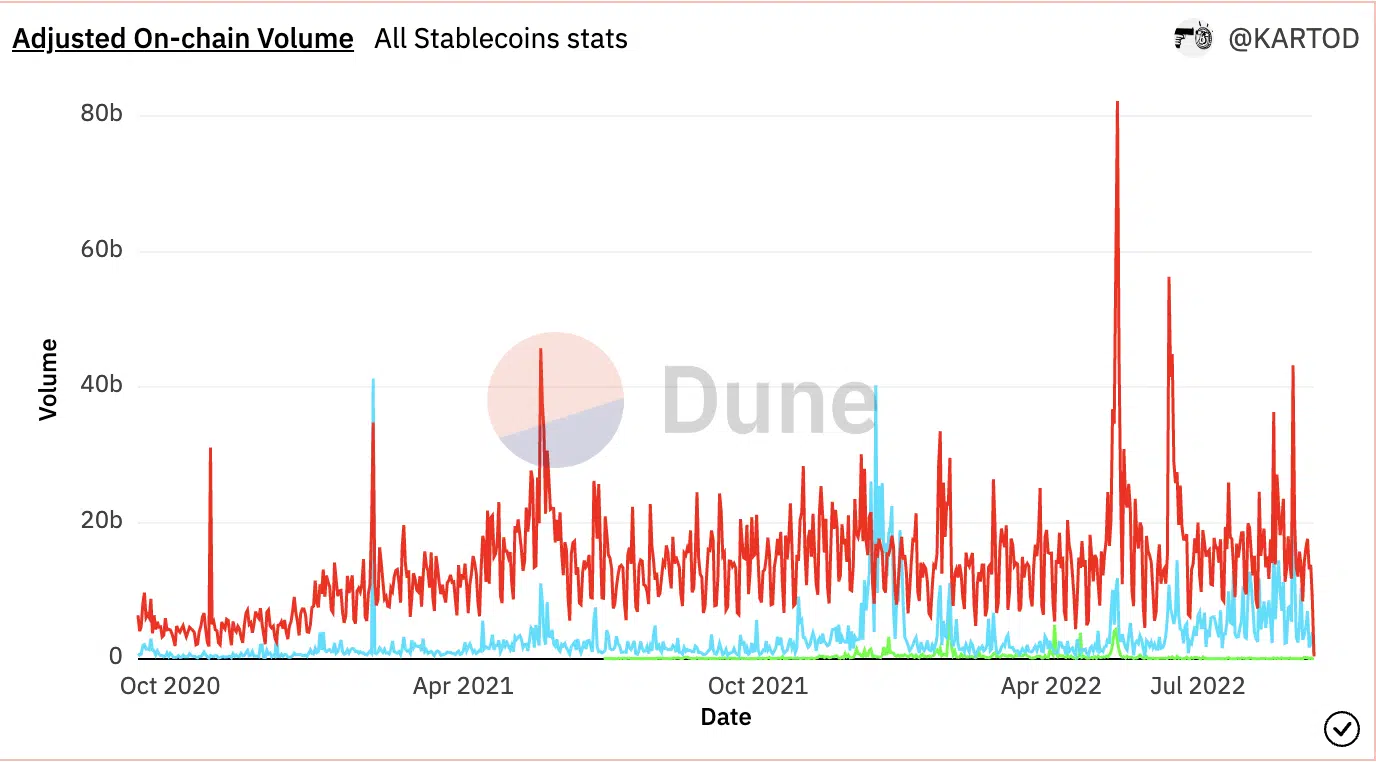
Since the stablecoin de-pegged in May, the adjusted on-chain volume of algorithmic stablecoins has fallen by 91%. At the time of writing, algorithmic stablecoins in the market had an adjusted on-chain volume of 51,165,168.98.
Source: Dune Analytics
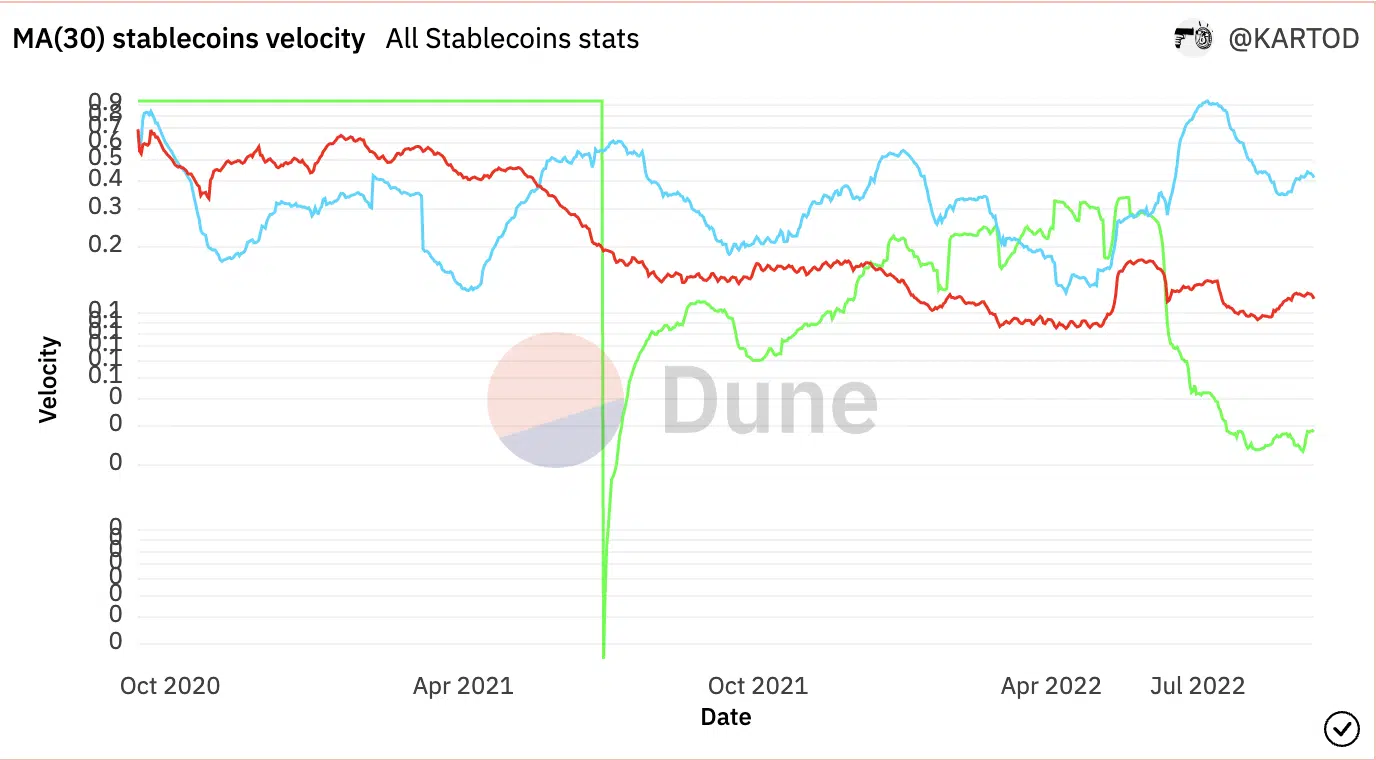
Also, since the collapse of UST in May, the velocity of algorithmic stablecoins has dwindled. The velocity of a cryptocurrency asset refers to the number of times such an asset moves from one transaction to another.
With a reading of 0.029 at press time, the velocity for algorithmic stablecoins has dropped by over 500% since May.
Source: Dune Analytics
USDT runs the market
According to Dune Analytics, fiat-collateralized stablecoins have a total supply of $97,074,596,562, with $95,456,754,764 as the available supply. Leading centralized stablecoins include Tether USDT (USDT), USD Circle (USDC), True USD (TUSD), Paxos Standard (PAX), and Binance USD (BUSD).
USDT has controlled the fiat-backed stablecoin market over the last two years as its market capitalization has grown by 265% since October 2020. USDC continues to trail behind it with a market capitalization of $51,677,605,035, followed by BUSD with a market capitalization of $20,000,915,736.
PAX and TUSD have not seen much growth in market capitalization in about two years.
Source: Dune Analytics
BUSD is up to something
On 5 September, Binance announced the launch of BUSD Auto-Conversion for its users, which would convert their existing balances and new deposits of USDC, USDP, and TUSD stablecoins to BUSD at a 1:1 ratio.
Since then, the stablecoin’s market capitalization has grown by 3%. Furthermore, its trading volume has also gone up by 124% in about 6 days.
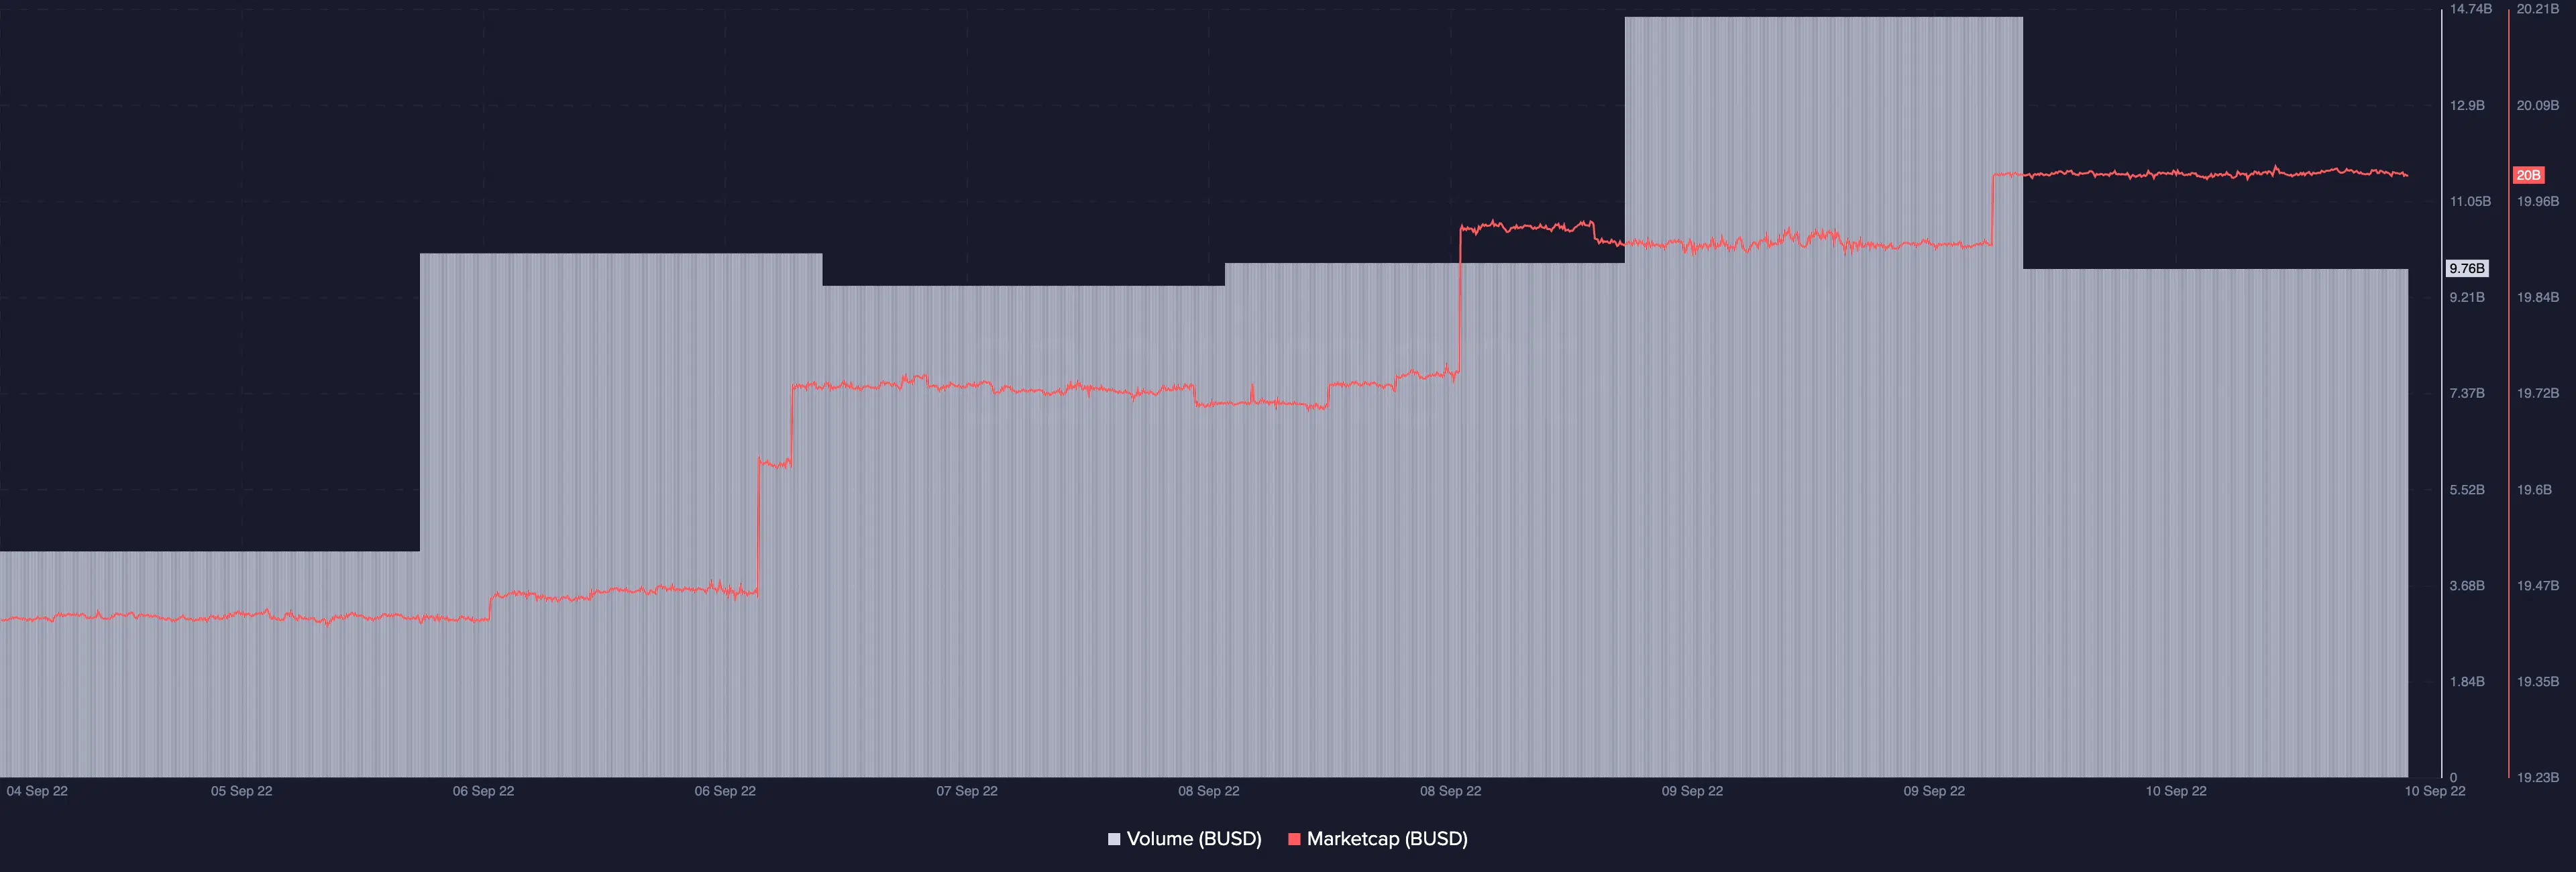
Source: Santiment


![Why Chainlink [LINK] and Polygon [MATIC] are more similar than you realise](https://ambcrypto.com/wp-content/uploads/2024/04/Chainlink_and_Polygon-1-400x240.webp)

