Here’s the roadmap to Solana switching its market trend

Disclaimer: The findings of the following analysis are the sole opinions of the writer and should not be considered investment advice
SOL finally broke out of its descending channel after rising from the crucial $85-support. Meanwhile, the bulls managed to find a close above the 20 EMA (red).
A strong close below the yellow trendline would reinforce a bearish divergence and would position SOL to test its Point of Control (POC, red) before picking itself up to retest the $105-level. At press time, SOL was trading at $100.22, down by 3.12% in the last 24 hours.
SOL Daily Chart
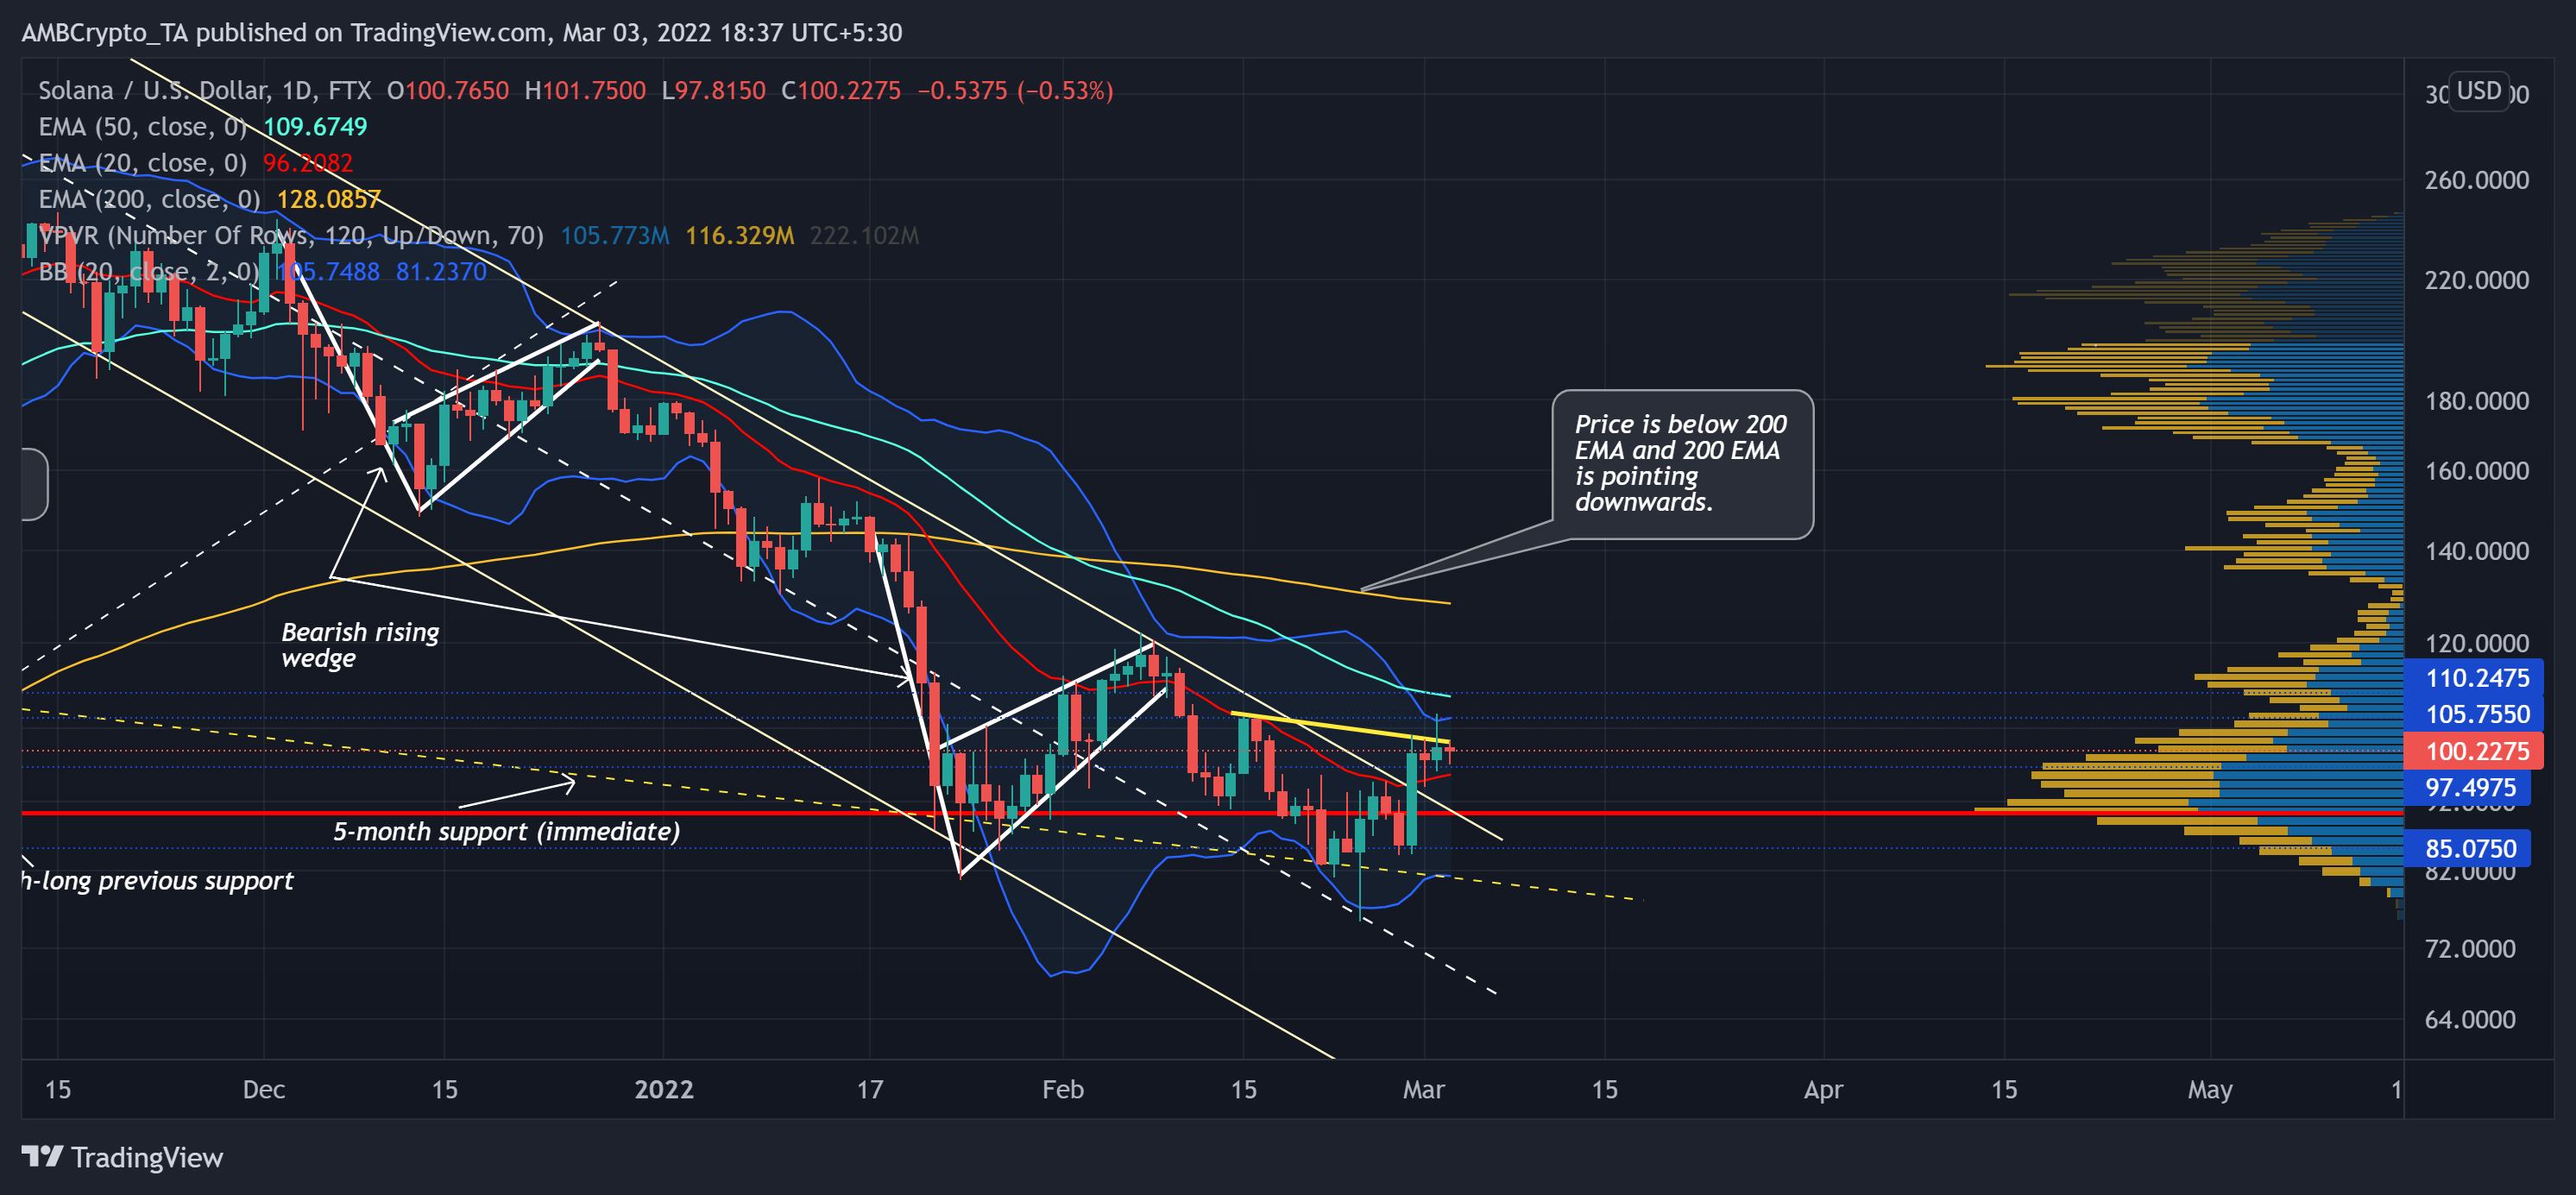
The recent bearish phase saw a staggering 71% retracement as SOL dropped through vital price points. Consequently, it fell below the 20-50-200 EMAs while the 20 EMA served as an important area of value for the traders. After forming two bearish flags during this phase, the buyers finally started to build up pressure from its POC.
The bulls were visibly keen on upholding the six-month horizontal support at the $85-mark. Thus, they triggered a 33.3% rally from its six-month low on 24 February and breached its long-term pattern.
Also, as the distance between the 20 EMA and 50 EMA (cyan) gradually declines, the bulls hinted at increasing their influence in the days to come. From here on, if the 3 march candlestick closes below the yellow trendline, SOL eyed at the $90-mark for a test. Following the same, it would likely look to topple the $105-110 range.
Also, the price hovered around the upper band of the Bollinger bands. This reading reaffirmed the possibility of a potential near-term pullback.
Rationale
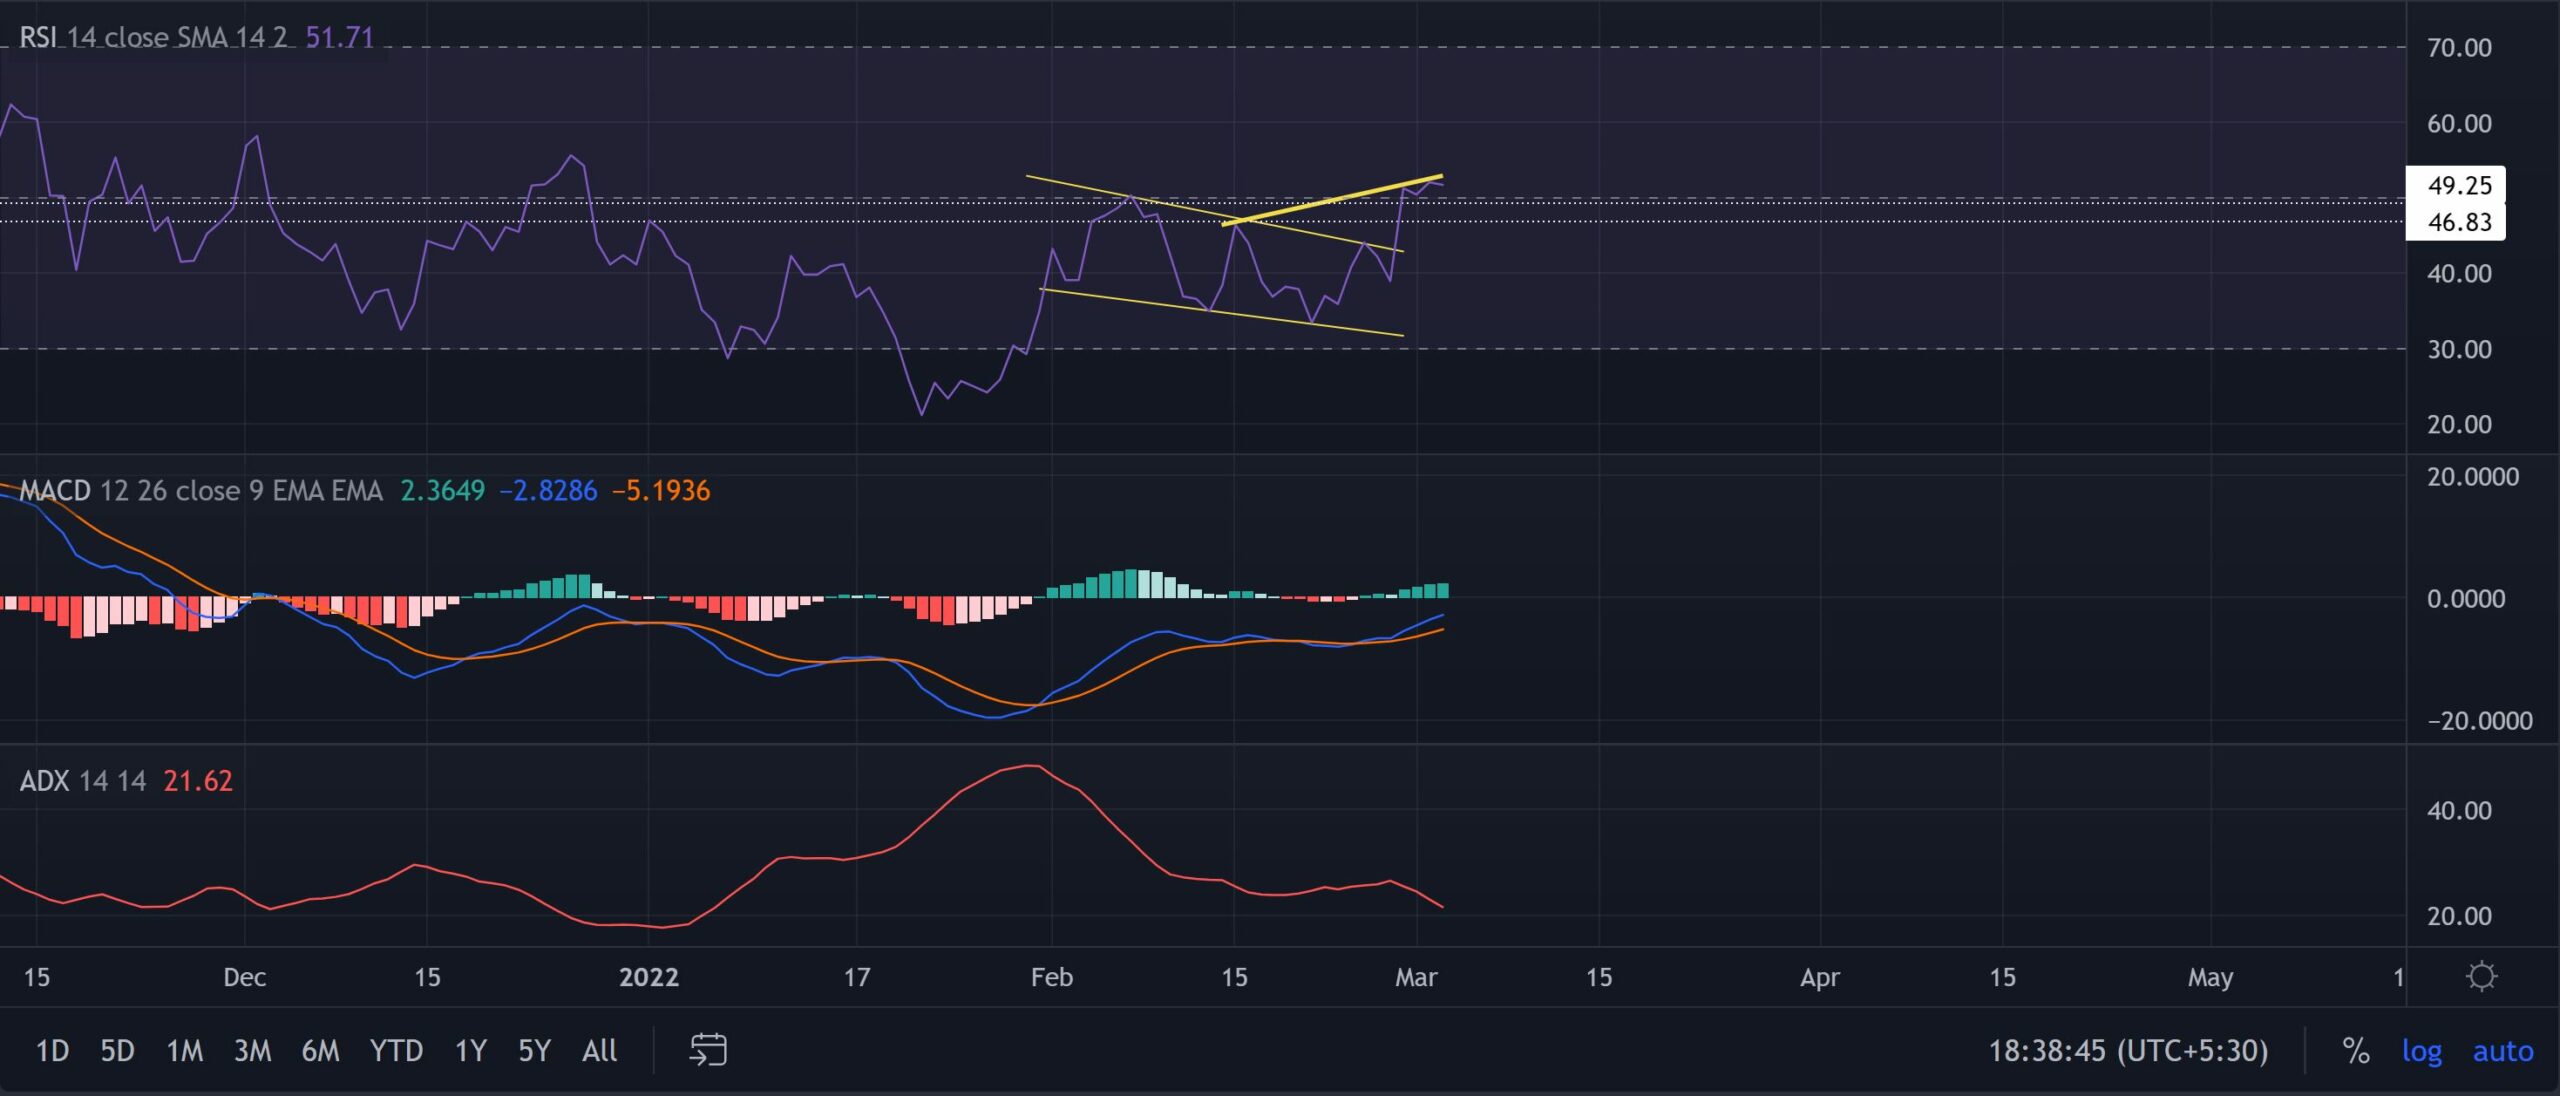
After a patterned breakout, the RSI crossed equilibrium but still struggled to trigger an unrestrained rally. Over the last two weeks, it formed a bearish divergence with the price, hinting at a probable pullback towards the 46-49 support range.
Interestingly, the MACD histogram pictured increasing momentum in favor of bulls. Even so, its lines still need to cross the midline to confirm the shift in overall sentiment. Also, the ADX has been on a downtrend, revealing a weak directional trend for SOL.
Conclusion
If the sellers confirm the bearish divergence at its yellow trendline, a further pullback near the $96-$90 zone would be likely. Following this, SOL might eye reviving itself from its POC and retesting the $105-$110 range.
Besides, considering the impact of the broader sentiment on Bitcoin’s movement would also be vital in making a profitable move.