Here’s what Bitcoin’s S&P 500 catchup means for BTC’s $90K target
How did Bitcoin erase 3 months of underperformance against the S&P 500 in just four trading sessions?



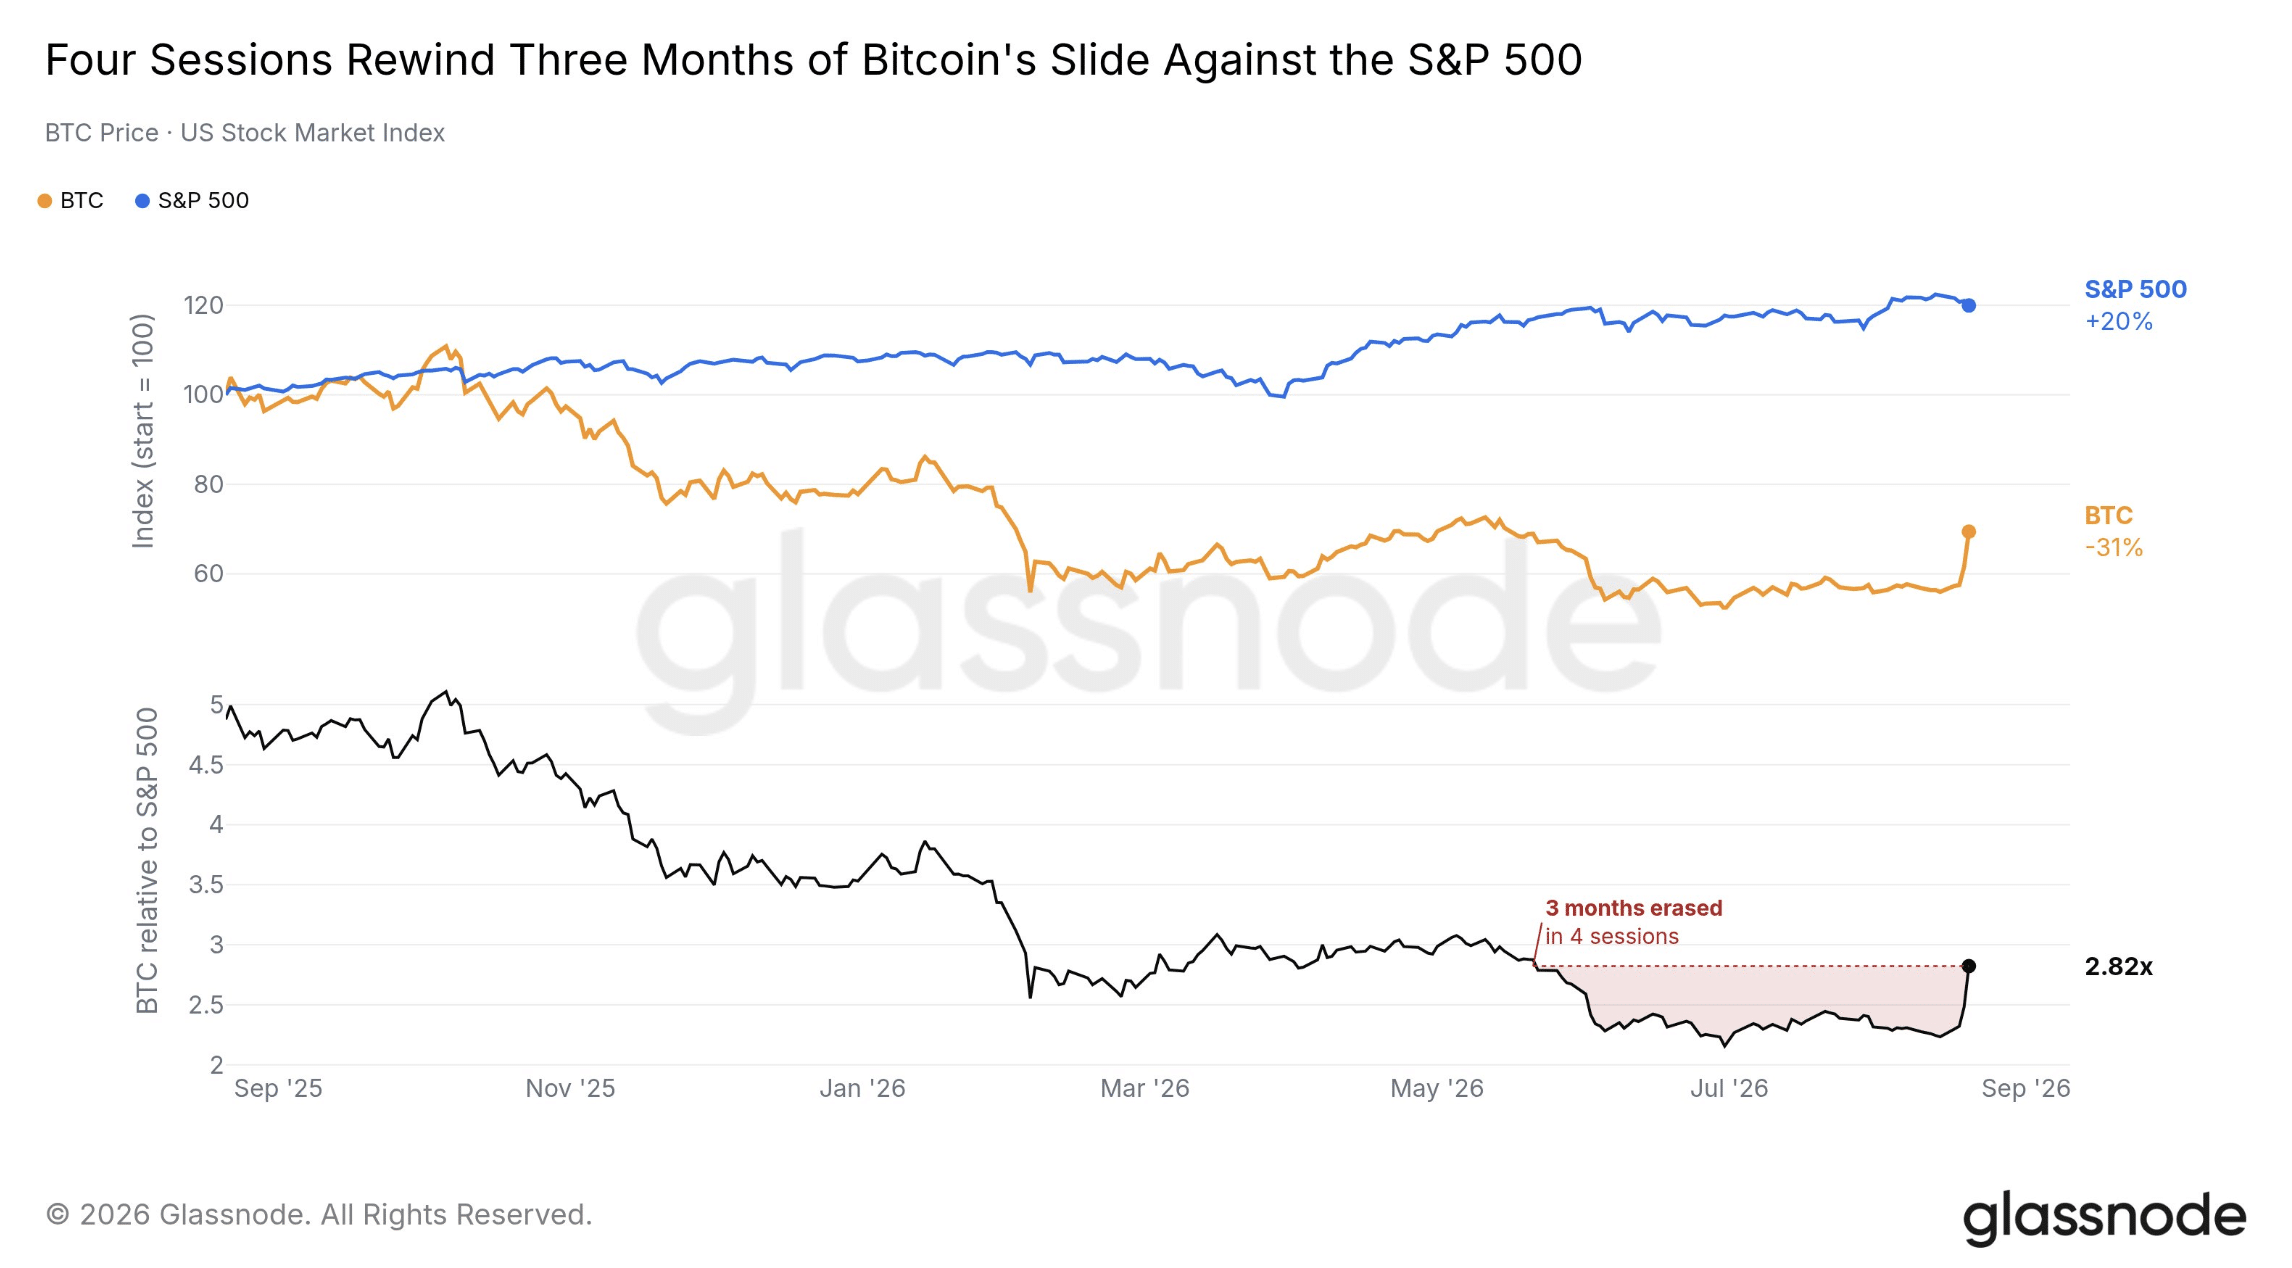
Bitcoin has suddenly regained the relative ground it had lost to the S&P 500 over the previous three months. In other words, Bitcoin had been performing worse than U.S. large-cap stocks during that period.
However, its sharp rally over the past 72 hours was strong enough to close that entire performance gap.
According to Glassnode’s session rewind chart, over the past three months, the BTC-to-S&P 500 relative-performance ratio has declined from around 3x to nearly 2.2x.
However, Bitcoin’s sharp rally over the latest four trading sessions pushed that ratio back up to approximately 2.82x. Though the S&P 500 is still up around 20% from the chart’s September 2025 starting point, Bitcoin has clearly shown its ability to recover lost ground quickly.
What pushed Bitcoin to close this gap in a few days?
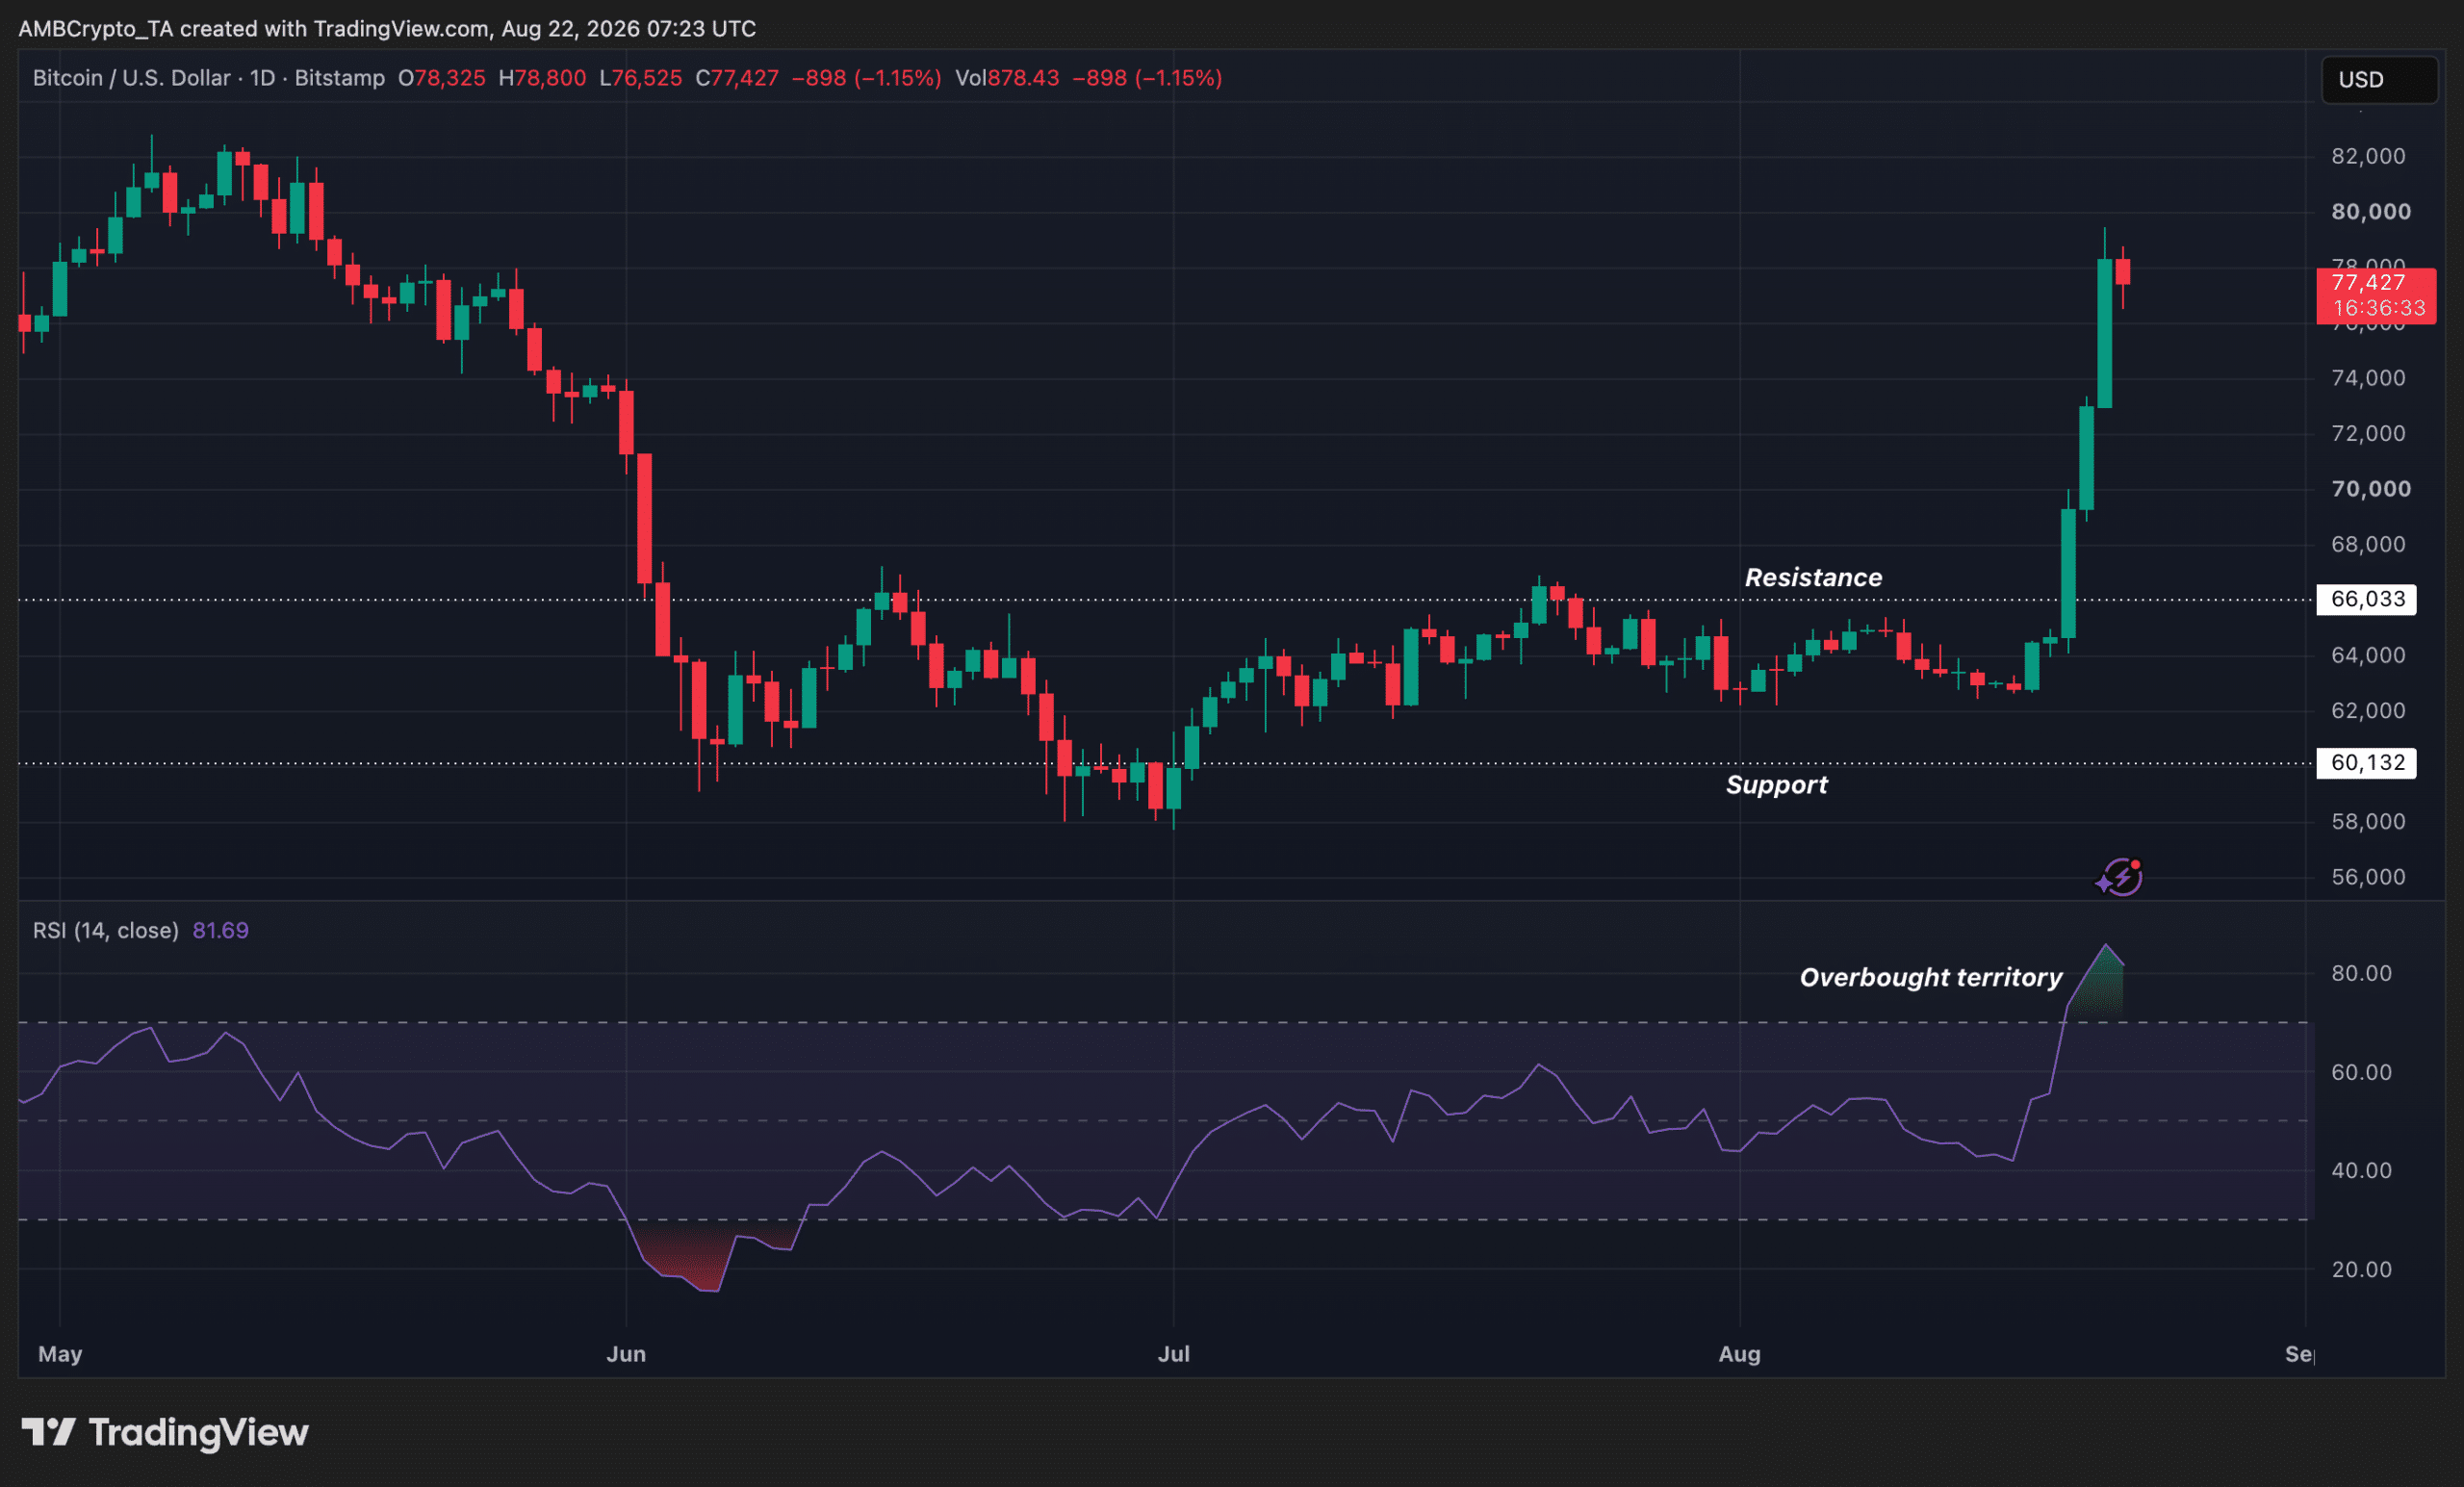
This comes on the heels of BTC’s price action rallying from $62K to around $78K in a few days.
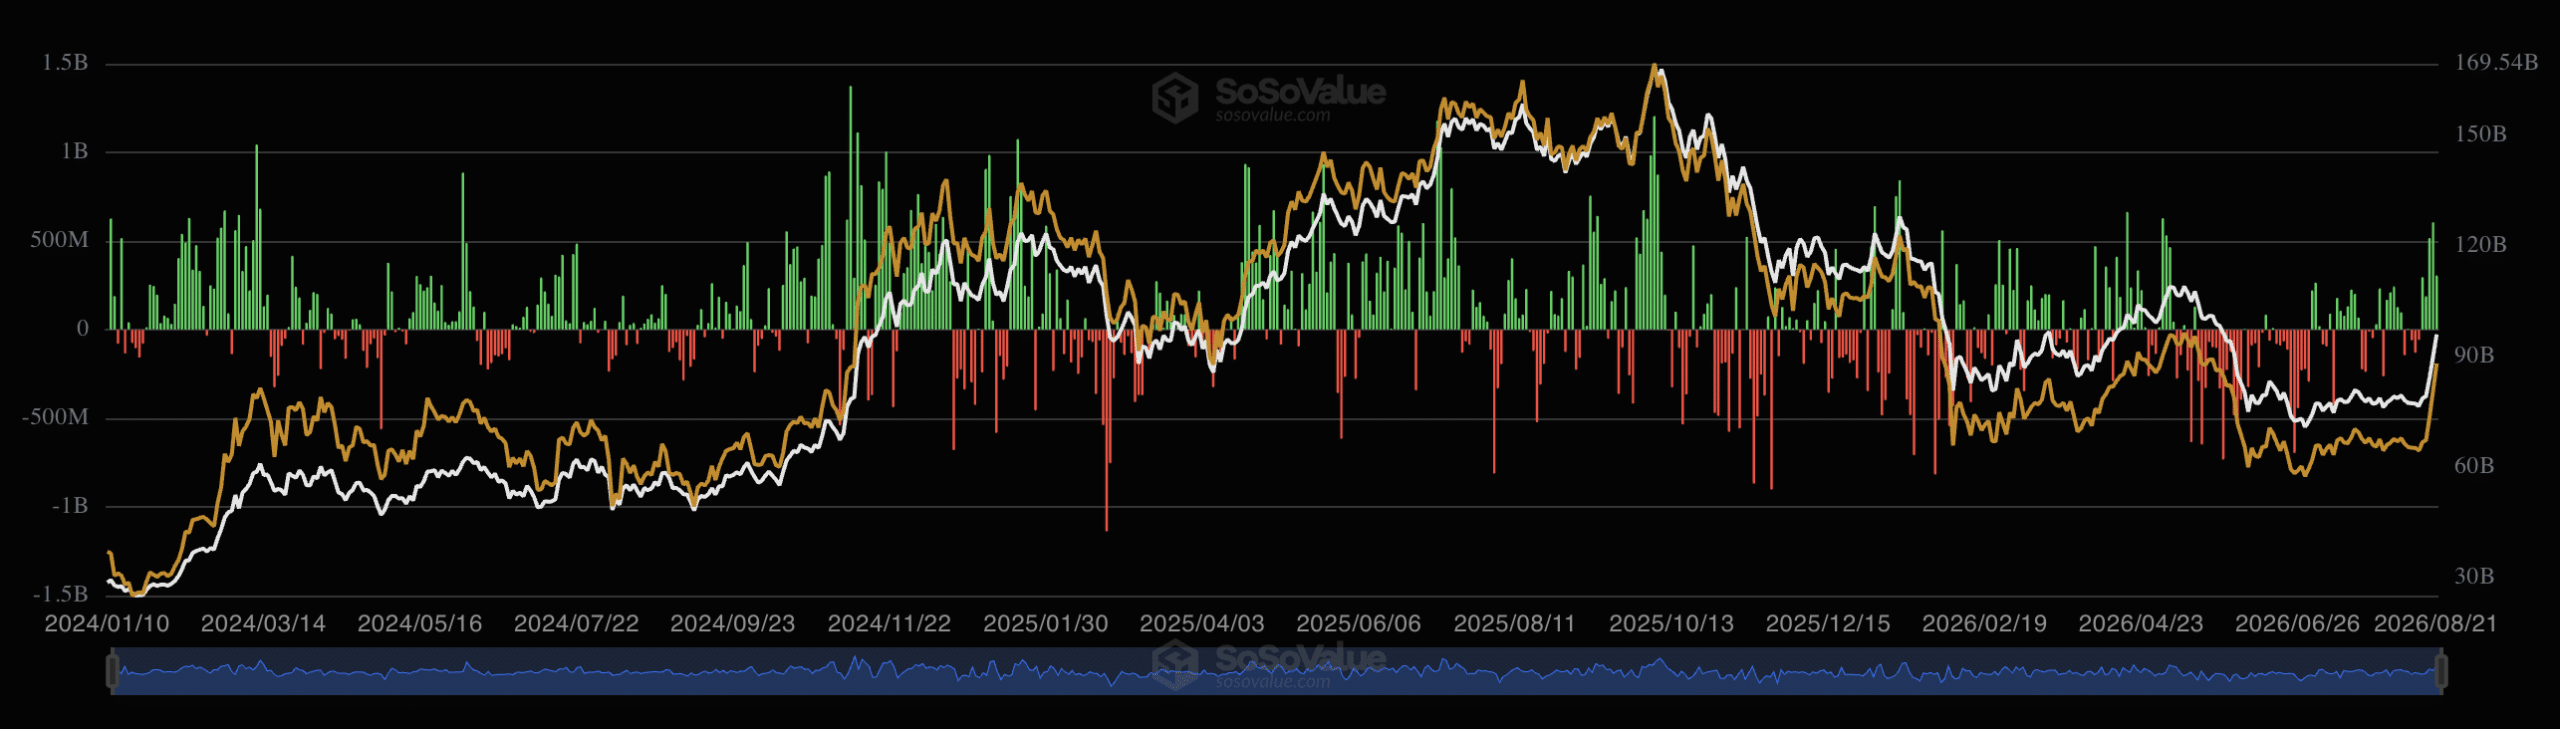
Besides the price action, other factors like the Bitcoin [BTC] ETF market, which recorded $1.92 billion in the past week, expectations around U.S. crypto legislation, and Treasury actions that helped calm bond-market stress also helped Bitcoin outweigh S&P 500.
However, this does not mean that Bitcoin’s underperformance is permanently over or that a new bull market is guaranteed. This is because as a result of the rally, the RSI index has now entered the overbought territory. As the pattern has been, every race to the overbought or oversold territory has called for a pullback, and so it might happen again.
Where is Bitcoin heading?
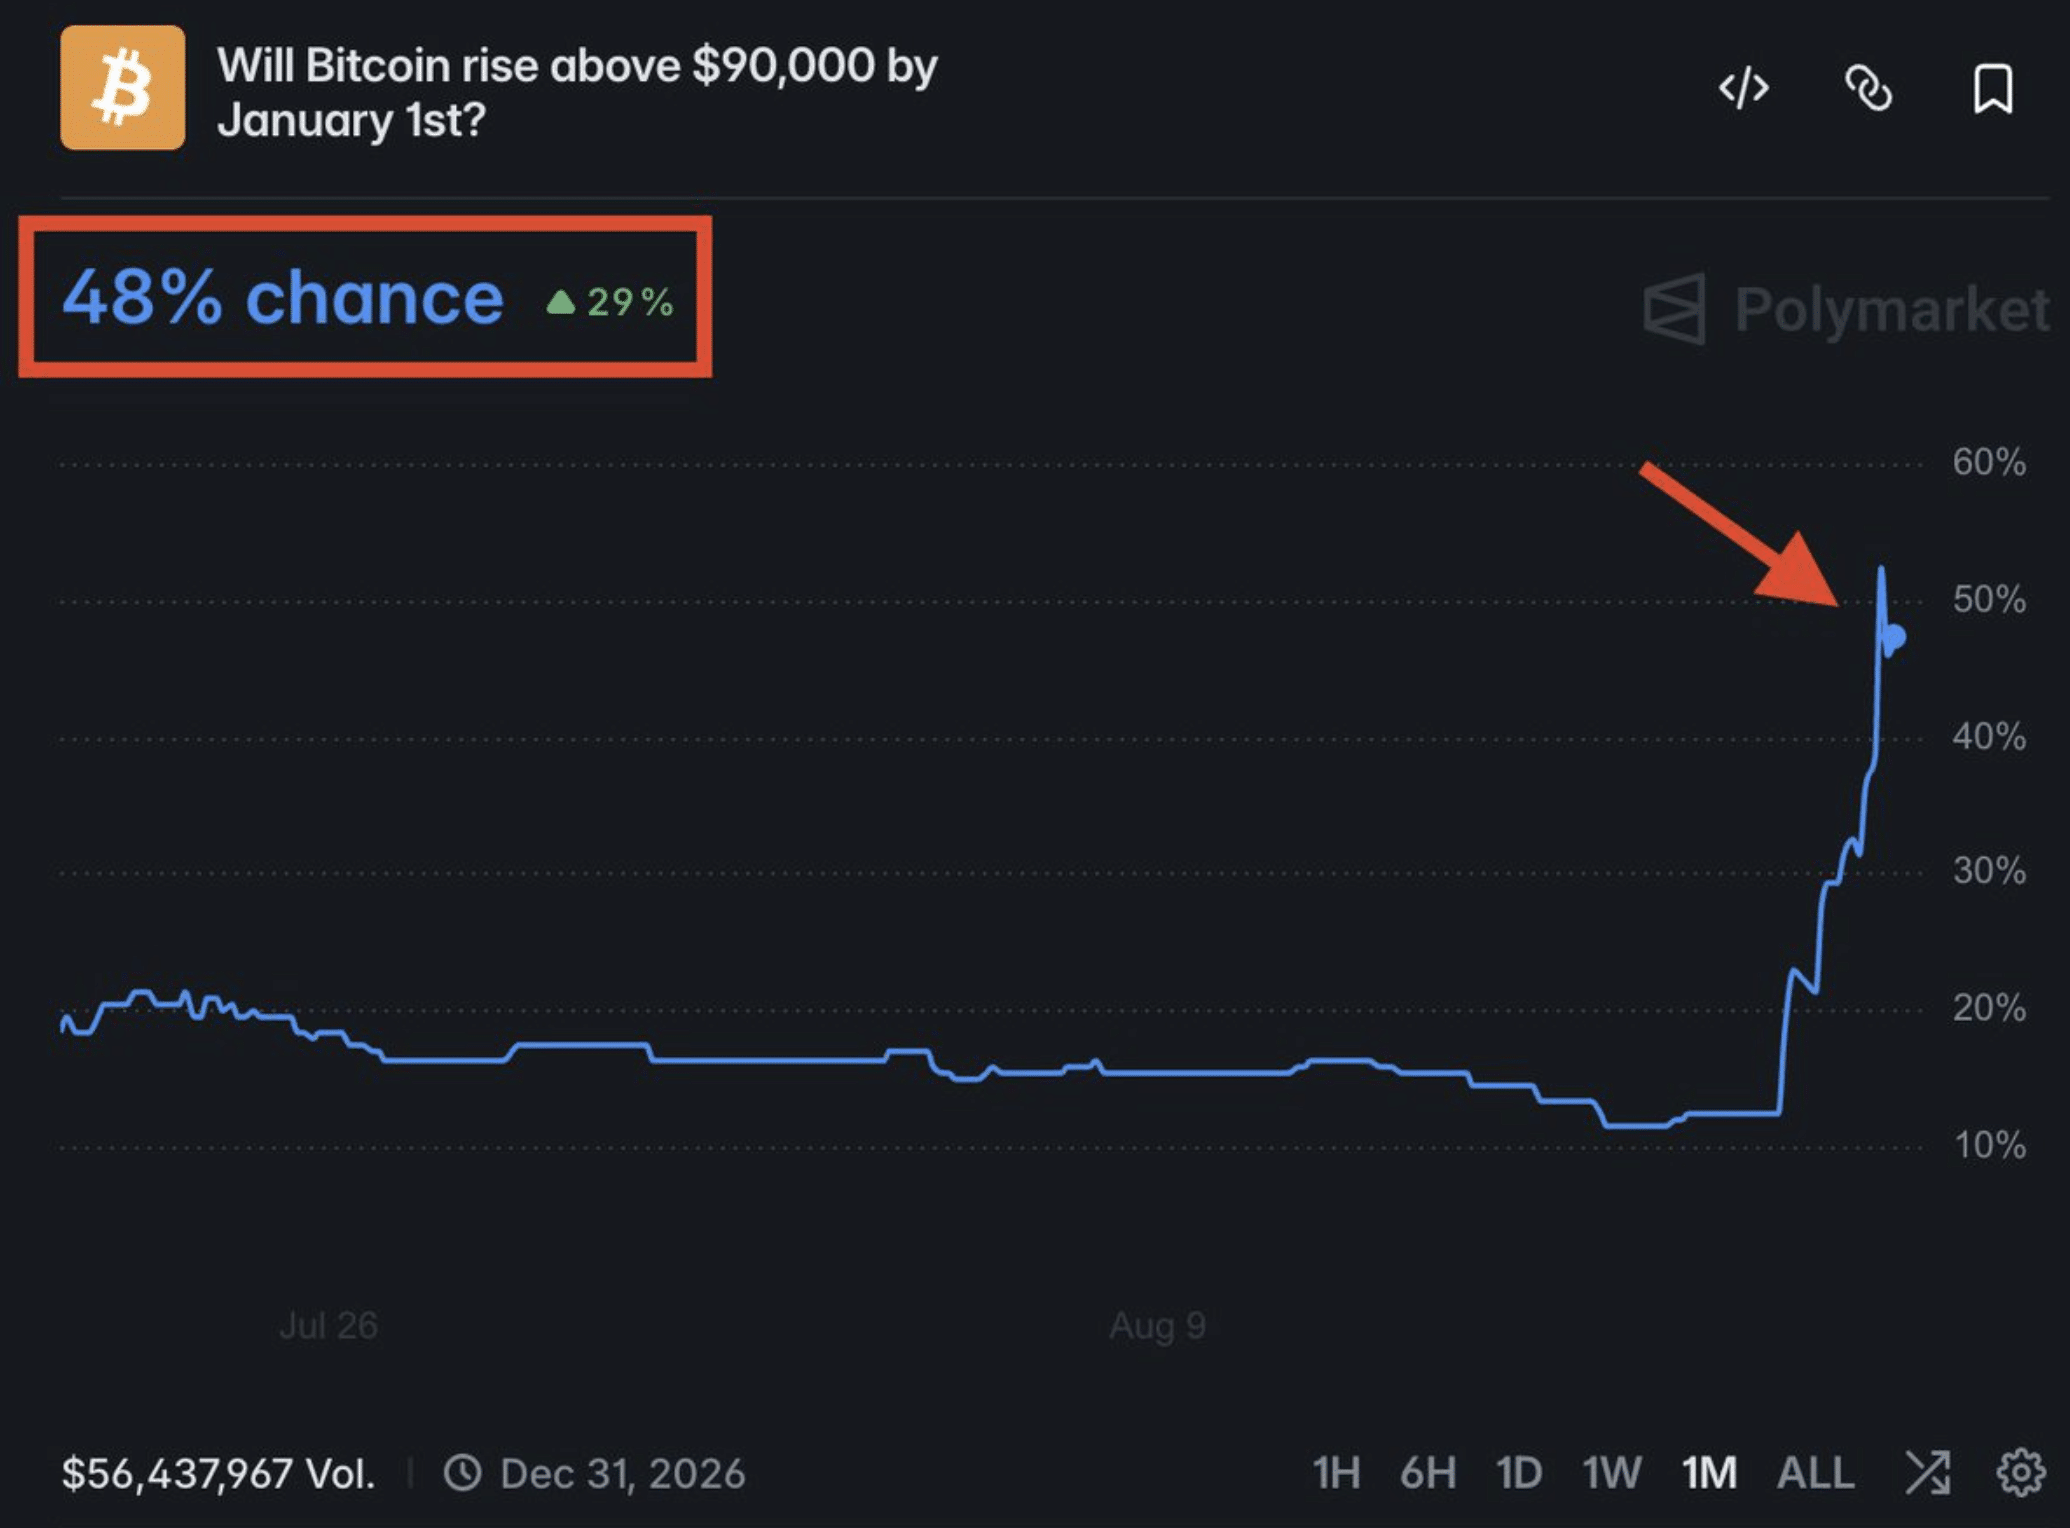
Yet despite the uncertainty, The Kobeissi Letter has predicted that the probability of Bitcoin finishing 2026 above $90,000 has reportedly jumped from 12% to 48% in just three days. The timing here is interesting, as this shift happened alongside $3.5 billion in leveraged cryptocurrency positions getting liquidated between the 20th and 21st of August.
This was further supported by AMBCrypto’s recent analysis that Bitcoin’s recent rebound has strengthened its bullish structure, with strong support between $61,849 and $63,111 and limited overhead supply above $75,733. Ergo, a break above this level could open the path toward 83,307–84,569, where another major supply cluster sits.
Final Summary
- Bitcoin’s price surge above $75K has helped it close the three-month performance gap with the S&P 500.
- This bullish rally has many anticipating BTC’s next move to above $90,000 by the end of 2026.