
- DOT’s price action chalked out an ascending channel.
- Any further breakdown from the channel’s lower boundary could lead to a retest of the $4 support zone.
Polkadot [DOT] has been trading within a classic up-channel structure for the past few weeks, showing a potential near-term bullish edge. However, the price recently met resistance at the $4.9 mark and has since been consolidating between the 20-day and 50-day EMAs.
DOT was trading at around $4.58 at the time of writing, down by around 4% over the last 24 hours. This price action placed DOT at a critical juncture as the altcoin tested the lower boundary of the up channel.
Can Polkadot sustain its bullish trajectory?
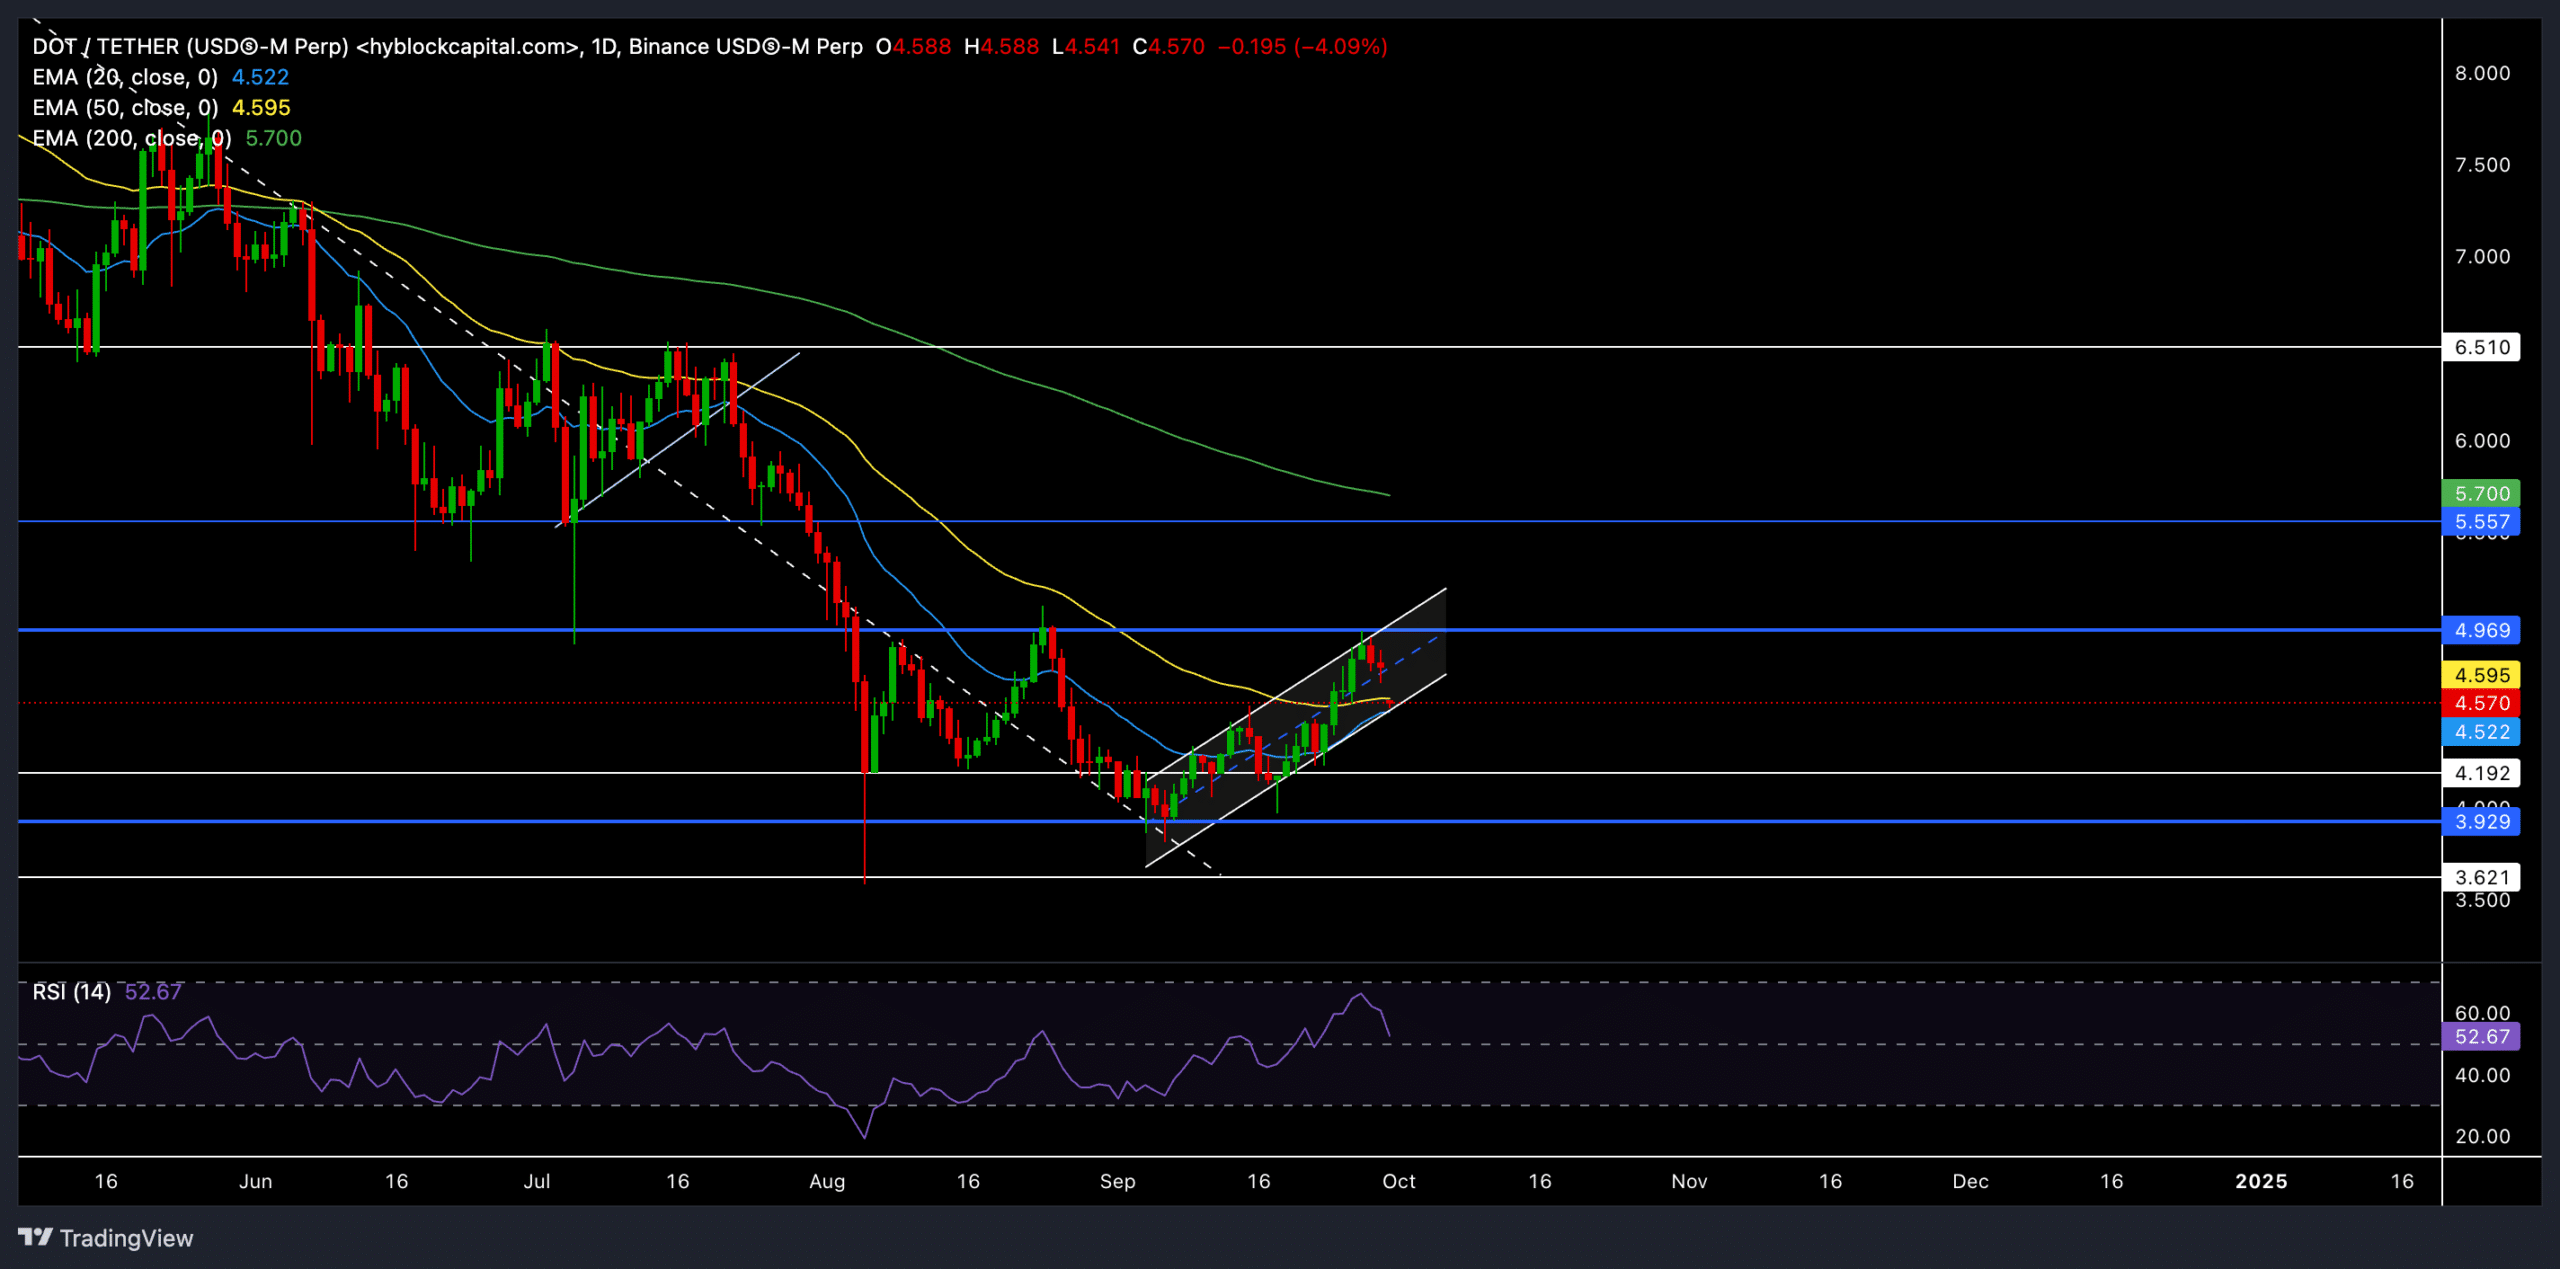
Source: TradingView, DOT/USDT
After rebounding from its long-term support at $3.9, DOT saw a steady upward climb and rallied over 21% in the last three weeks. However, the recent rejection at the $4.9 resistance caused the price to revisit the $4.5-$4.6 region, just below the 50-day EMA.
Given the upward momentum over the past month, DOT buyers would ideally want to sustain the price action above the $4.5 level to keep the uptrend alive. If the bulls defend this area, we could see a retest of the $5 psychological level with the next major resistance around $5.55.
On the flip side, a sustained move below $4.5 could open the doors for a deeper pullback toward the $3.9-$4.1 support range. This support area has previously provided a solid base for buyers to re-enter the market.
The RSI stood at 53 at press time to indicate a rather neutral stance. If it declines further below 50, it could signal a loss of momentum for the bulls and an increased likelihood of a short-term correction.
The price has been hovering around the 20-day EMA ($4.52) and the 50-day EMA ($4.59). A break below these levels could provoke bearish pressure, while a bounce from here would be crucial for sustaining the bullish narrative.
Derivatives data revealed THIS

Source: Coinglass
Volume saw a sharp rise of nearly 70% (to $182.67 million), while open interest dipped slightly by 0.54% to $216.71 million over the past day. This suggested an increase in speculative activity but with caution among traders as open interest remained relatively flat.
The long/short ratio showed a slight short bias at 0.9004 across exchanges, indicating some bearish sentiment.
Read Polkadot’s [DOT] Price Prediction 2024–2025
However, the long/short ratio on Binance for DOT/USDT was 4.102—showing that top traders predominantly held long positions and bet on a potential price recovery.
Polkadot traders should watch Bitcoin’s movements and assess the overall market sentiment to gauge the altcoin’s next move.