Here’s what’s riding on MATIC’s near-term price action

Disclaimer: The findings of the following analysis are the sole opinions of the writer and should not be taken as investment advice
MATIC was traversing within a horizontal channel after raking in gains post a symmetrical triangle breakout. Bearish divergence on the RSI, along with the 20 and 50-SMA’s interplay, hinted at some southbound price action before MATIC can challenge $1.70.
At the time of writing, MATIC was trading at $1.55, down by 0.6% over the last 24 hours.
MATIC 4-hour Chart
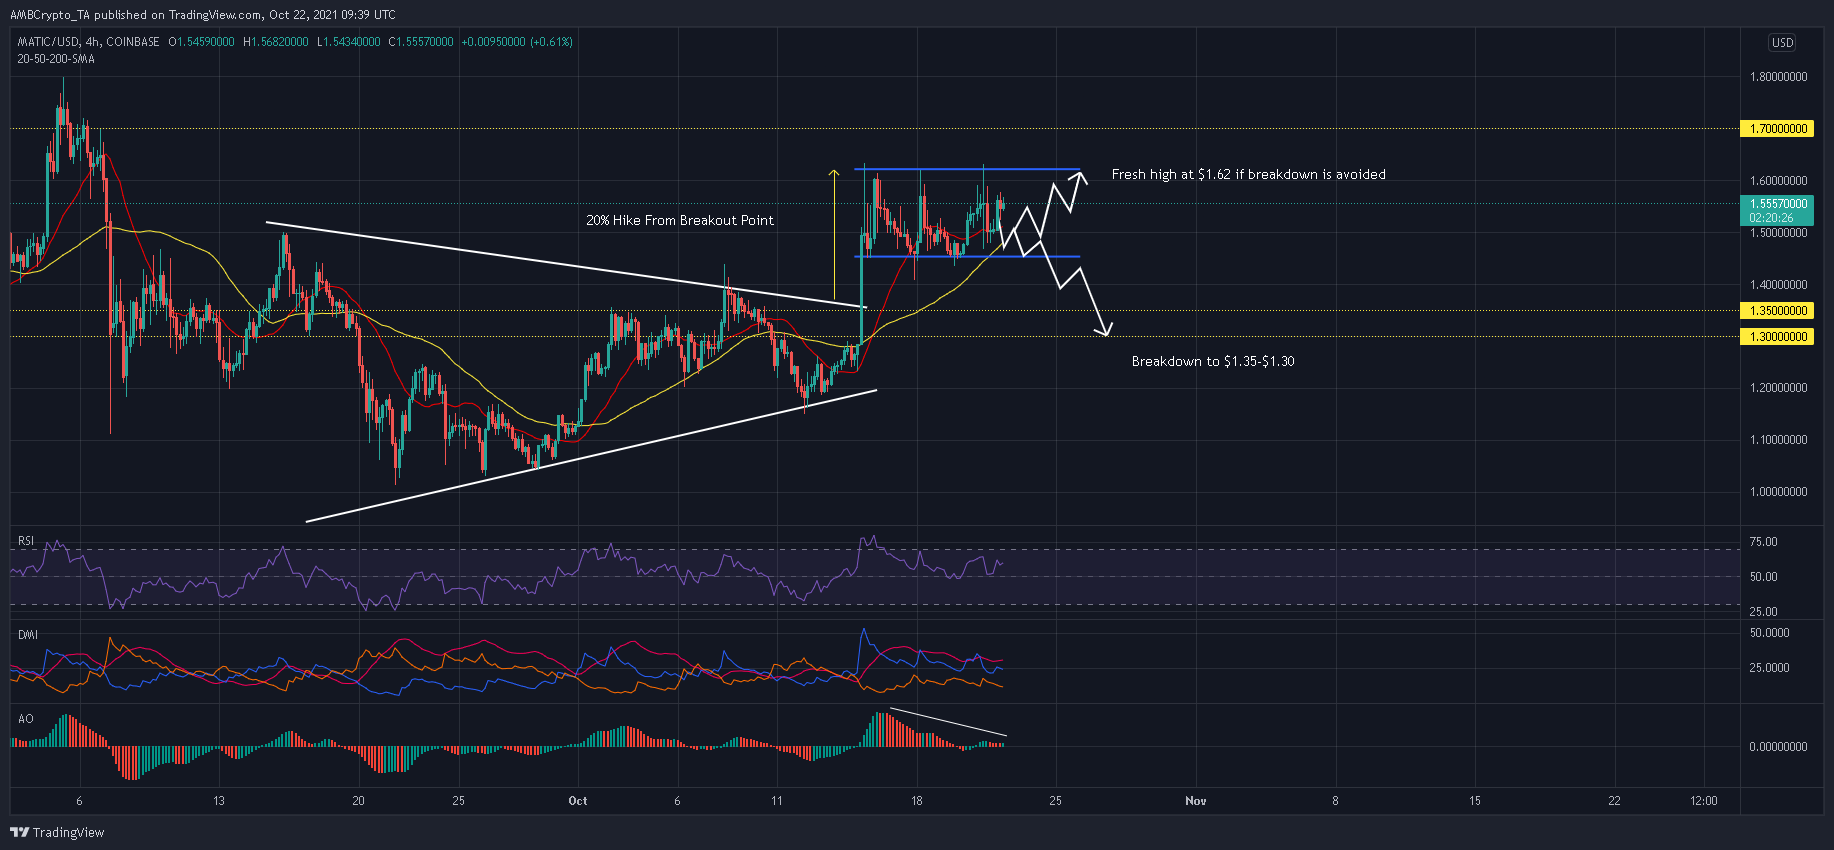
MATIC propped up by nearly 20% from the breakout point after bulls capitalized on the symmetrical triangle setup on the charts. Since the swing, MATIC has traded within a parallel channel, forming consistent highs at $1.62 and lows at $1.45.
Ideally, the pattern should play out as a continuation of MATIC’s previous uptrend. In such a case, the alt would challenge $1.70 after yet another upwards breakout. However, a few red flags indicated that MATIC was at the risk of a potential 10% sell-off.
First of all, the 50-SMA (yellow) was inching towards the 20-SMA (red) as bullish momentum took a hiatus after MATIC’s earlier breakout. A bearish crossover between these moving average lines would allow initiating more sell positions in the market. Secondly, the RSI confirmed a bearish divergence after forming lower peaks as opposed to MATIC’s price action.
If the index were to slip below the half-line, MATIC would face the heat of short-sellers as well. A bearish twin peak on the Awesome Oscillator only reinforced this idea and presented some turmoil ahead. Based on these findings, MATIC would approach the lower end of its pattern and threaten a breakdown.
If an early pushback is not offered at $1.43, MATIC could revisit the support zone of $1.35-$1.30, before stabilizing. However, expect bulls to put up a fight at $1.45 and deny a breakdown attempt. The Directional Movement Index’s bullish crossover still played in favor of the buyers and an uptrend seemed to be intact at press time.
Conclusion
MATIC can be expected to revisit the baseline of its pattern ($1.45) after a few bearish signs cropped up on the chart. Should sellers emerge victorious at this key support, MATIC could record a 10% slide towards $1.30.
On the other hand, another high at $1.62 can be anticipated if bulls maintain MATIC within this pattern.