

Ethereum surges with $461M ETF inflows – Will ETH break its ATH?
Altcoin
Here’s when Hedera holders can expect a breakout from THIS pattern
Hedera’s recent rally has positioned it near key resistance—can bulls maintain the momentum or is a pullback imminent?

- Hedera continued its uptrend in an ascending channel on the daily chart.
- Derivates data showed mixed sentiment, with a slight edge to buyers.
Hedera [HBAR] bulls recently re-entered the market after the altcoin rebounded from the crucial $0.04 support. Over the past month, HBAR witnessed a strong bullish resurgence that led it out of its prolonged bearish phase.
With the 20-day EMA now crossing above the 50-day EMA, this bullish momentum could set the stage for a potential retest of key resistance levels. The question is: Can bulls sustain this momentum and aim for further gains, or will the bears push back?
Why HBAR price can head this way
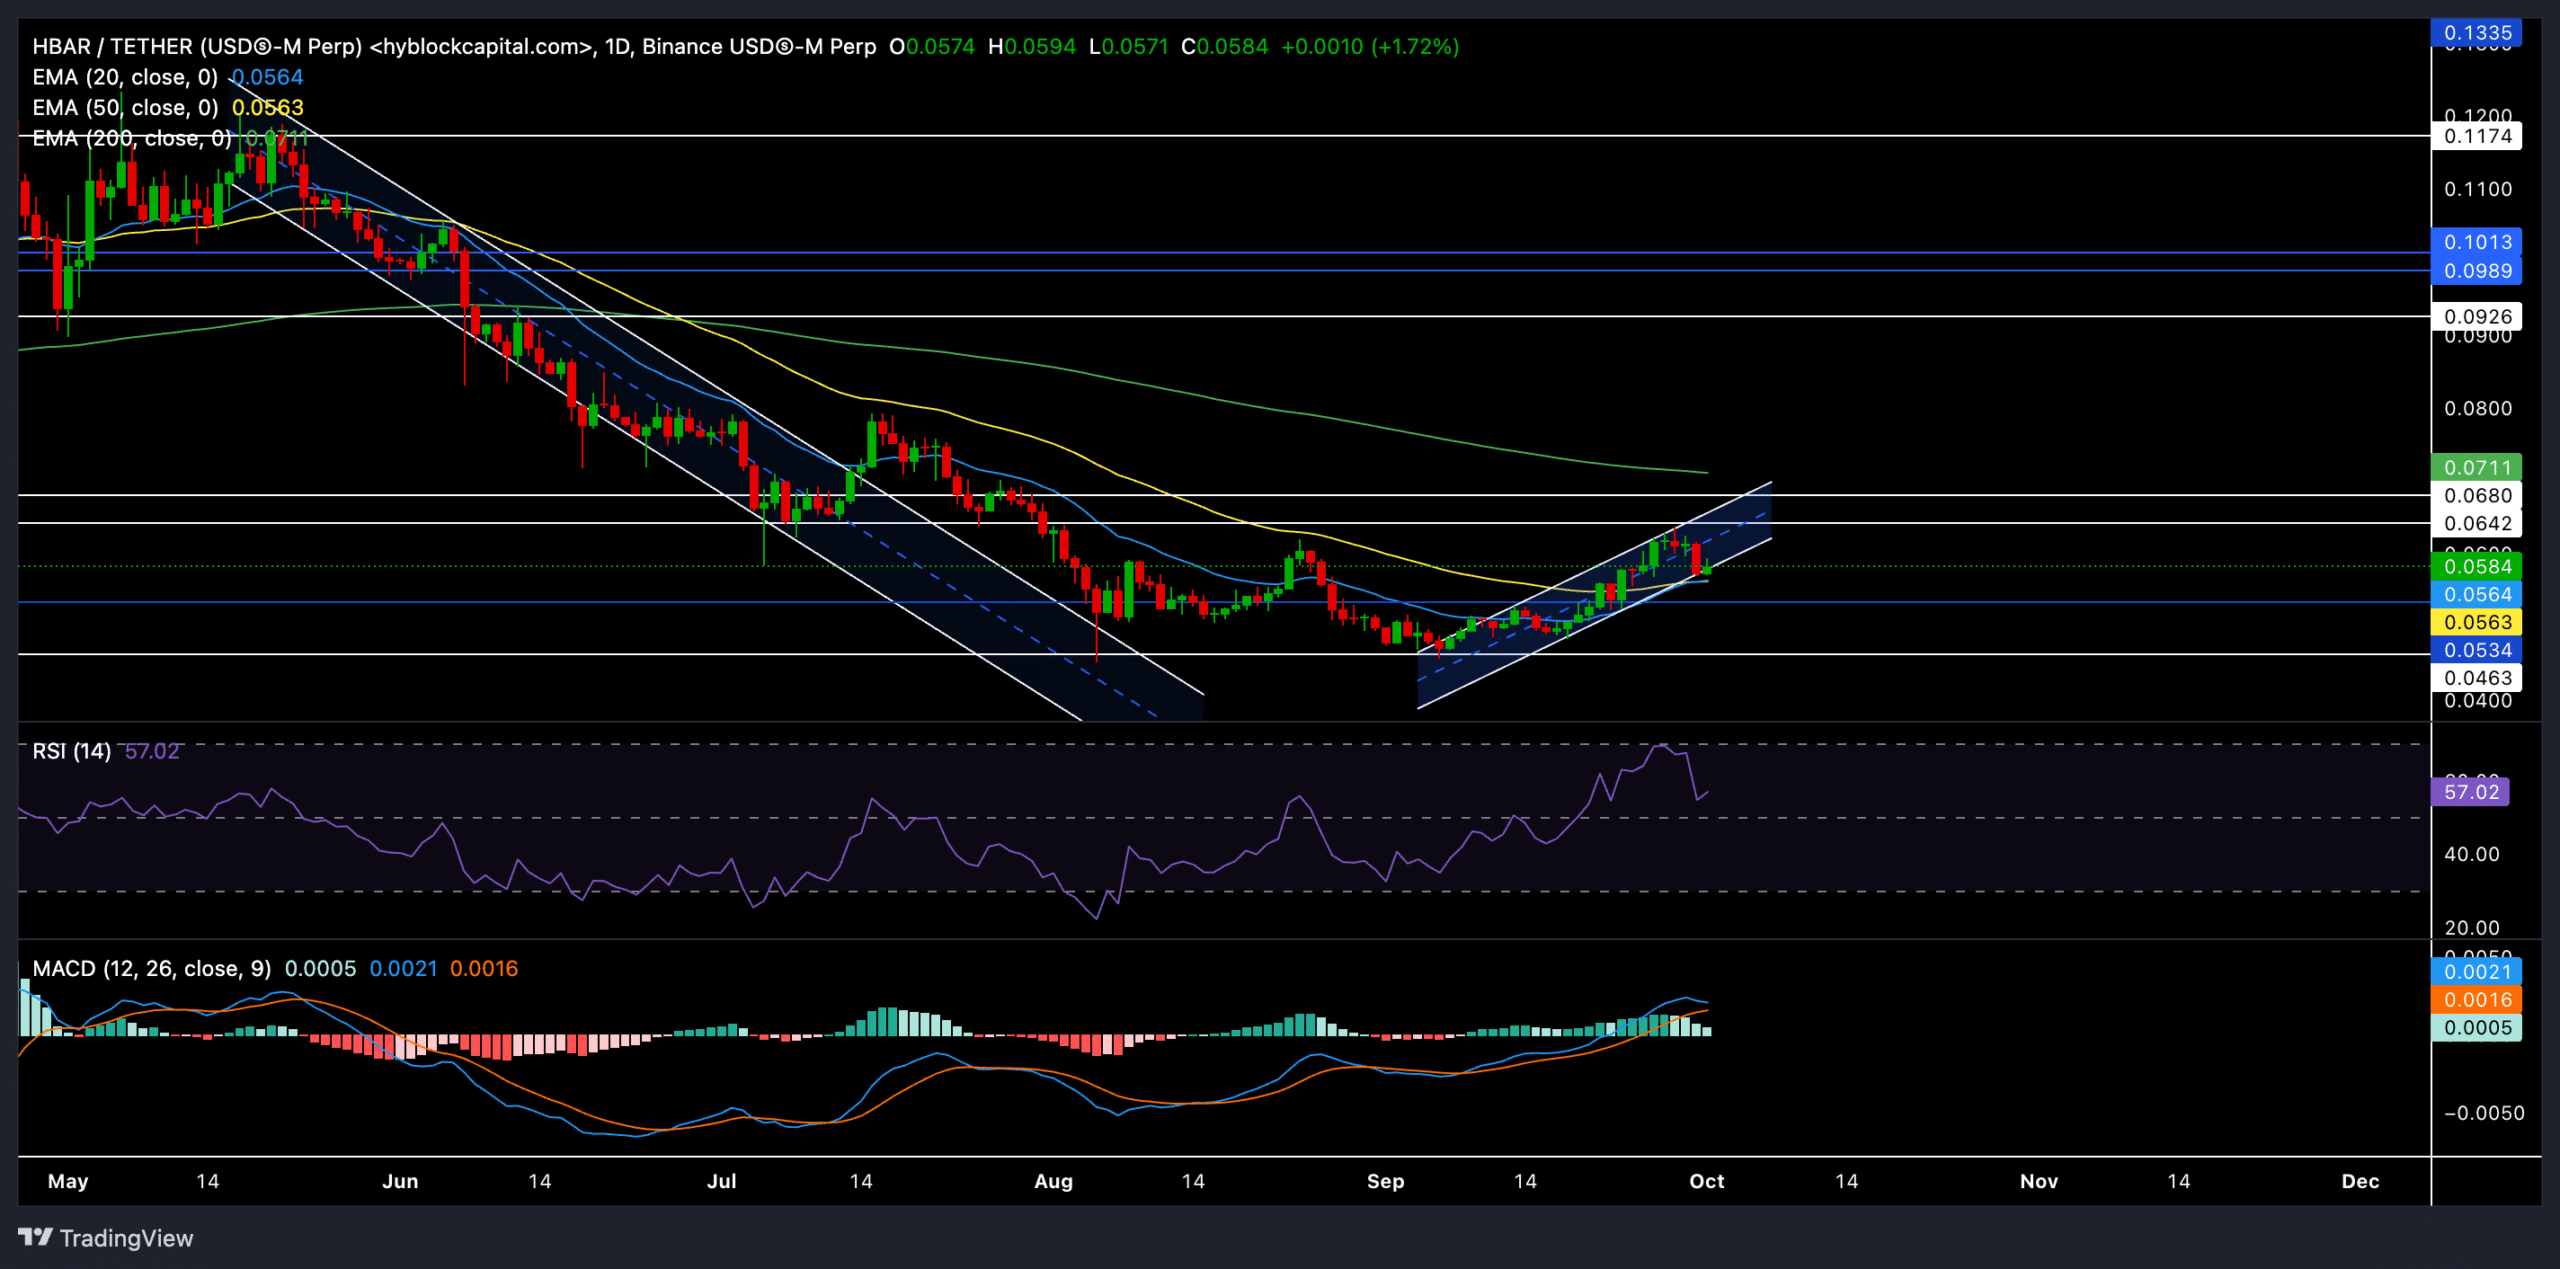
Source: TradingView, HBAR/USDT
After HBAR dipped to the $0.04 level, the buyers re-entered the market to counter the downward pressure. As a result, HBAR recovered within an ascending channel after clocking in a nearly 35% gain in just over three weeks.
This uptrend could provoke a retest of the critical resistance range of $0.064 to $0.068, which is just below the 200-day EMA (green).
It’s also worth noting that the recent price surge saw the 20-day EMA cross above the 50-day EMA—a near-term bullish signal. However, if the price fails to breach the $0.064-$0.068 resistance zone, a near-term decline may be on the cards.
In such a scenario, a pullback towards the lower boundary of the ascending channel could materialize.
At press time, HBAR was trading around $0.0584, with the bulls aiming for a continuation of the uptrend. A break above the $0.068 resistance could open doors for a further rally toward $0.0711 (near the 200-day EMA).
The daily RSI hovered around 57 after dipping from its overbought territory. A potential decline below the 50 mark can confirm a near-term trend on the charts.
Similarly, MACD reconfirmed the bullish edge but buyers should lookout for a potential bearish crossover of the MACD and signal line to gauge the chances of a near-term decline.
Derivates data revealed THIS
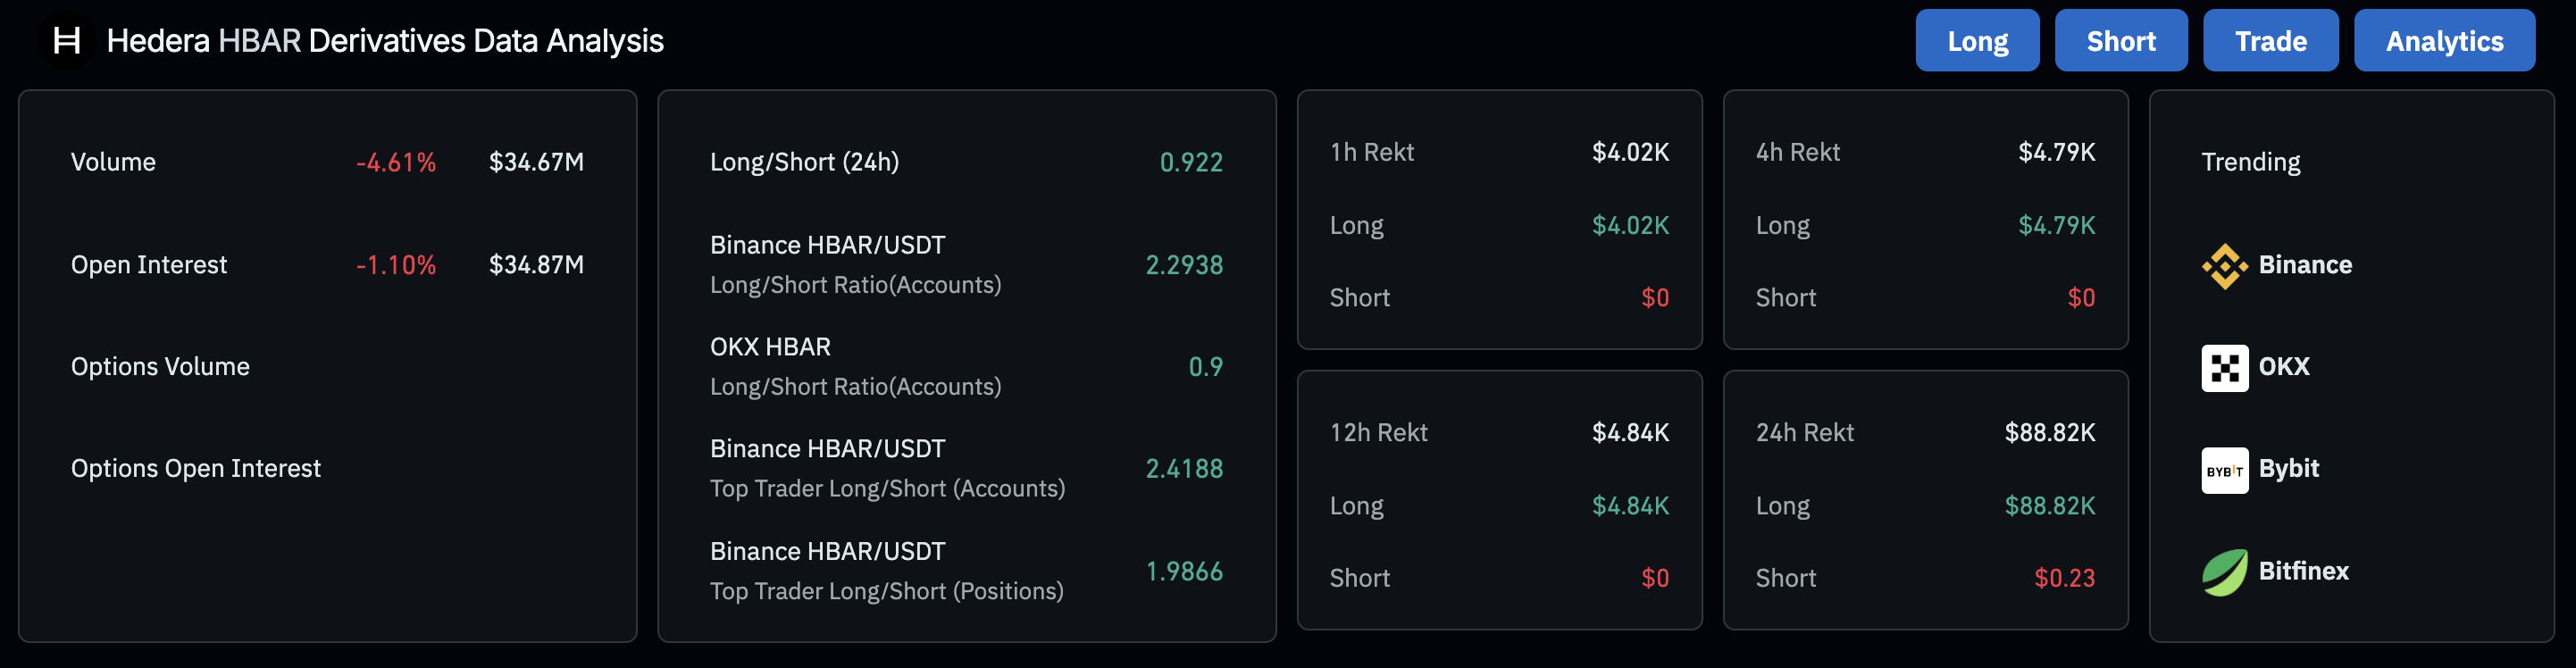
Source: Coinglass
The long/short ratio for HBAR over the past 24 hours was 0.922, confirming that short positions slightly outweighed long ones. However, the long/short ratio on Binance for HBAR/USDT was around 2.29, suggesting strong bullish sentiment among traders on that platform.
According to the latest Coinglass data, HBAR’s volume decreased by 4.61%, with a 1.10% dip in open interest.
Is your portfolio green? Check out the HBAR Profit Calculator
Despite this minor contraction, the current open interest of $34.87M still indicated high trading activity, and any shift in sentiment could lead to increased volatility.
Traders should now closely monitor Bitcoin’s movements and assess the overall market sentiment before opening any positions in the near term.


