Here’s where MATIC’s short sellers can look to book their profits

- The H4 and D1 market structure has remained bearish
- A move above $1.25 would be required to flip bias to bullish
Polygon [MATIC] noted strong gains on the price charts in mid-February, a development which highlighted that sentiment was positive towards the asset at that time. Since then, however, the market has turned and those gains have been fully wiped out.
How much are 1, 10, 100 MATIC worth today?
The active addresses metric has fallen since late January too while daily gas fees have declined over the past two weeks. This hit to the protocol’s revenue could explain some of the losses MATIC has seen on the charts.
MATIC could be set to fill an imbalance in the south
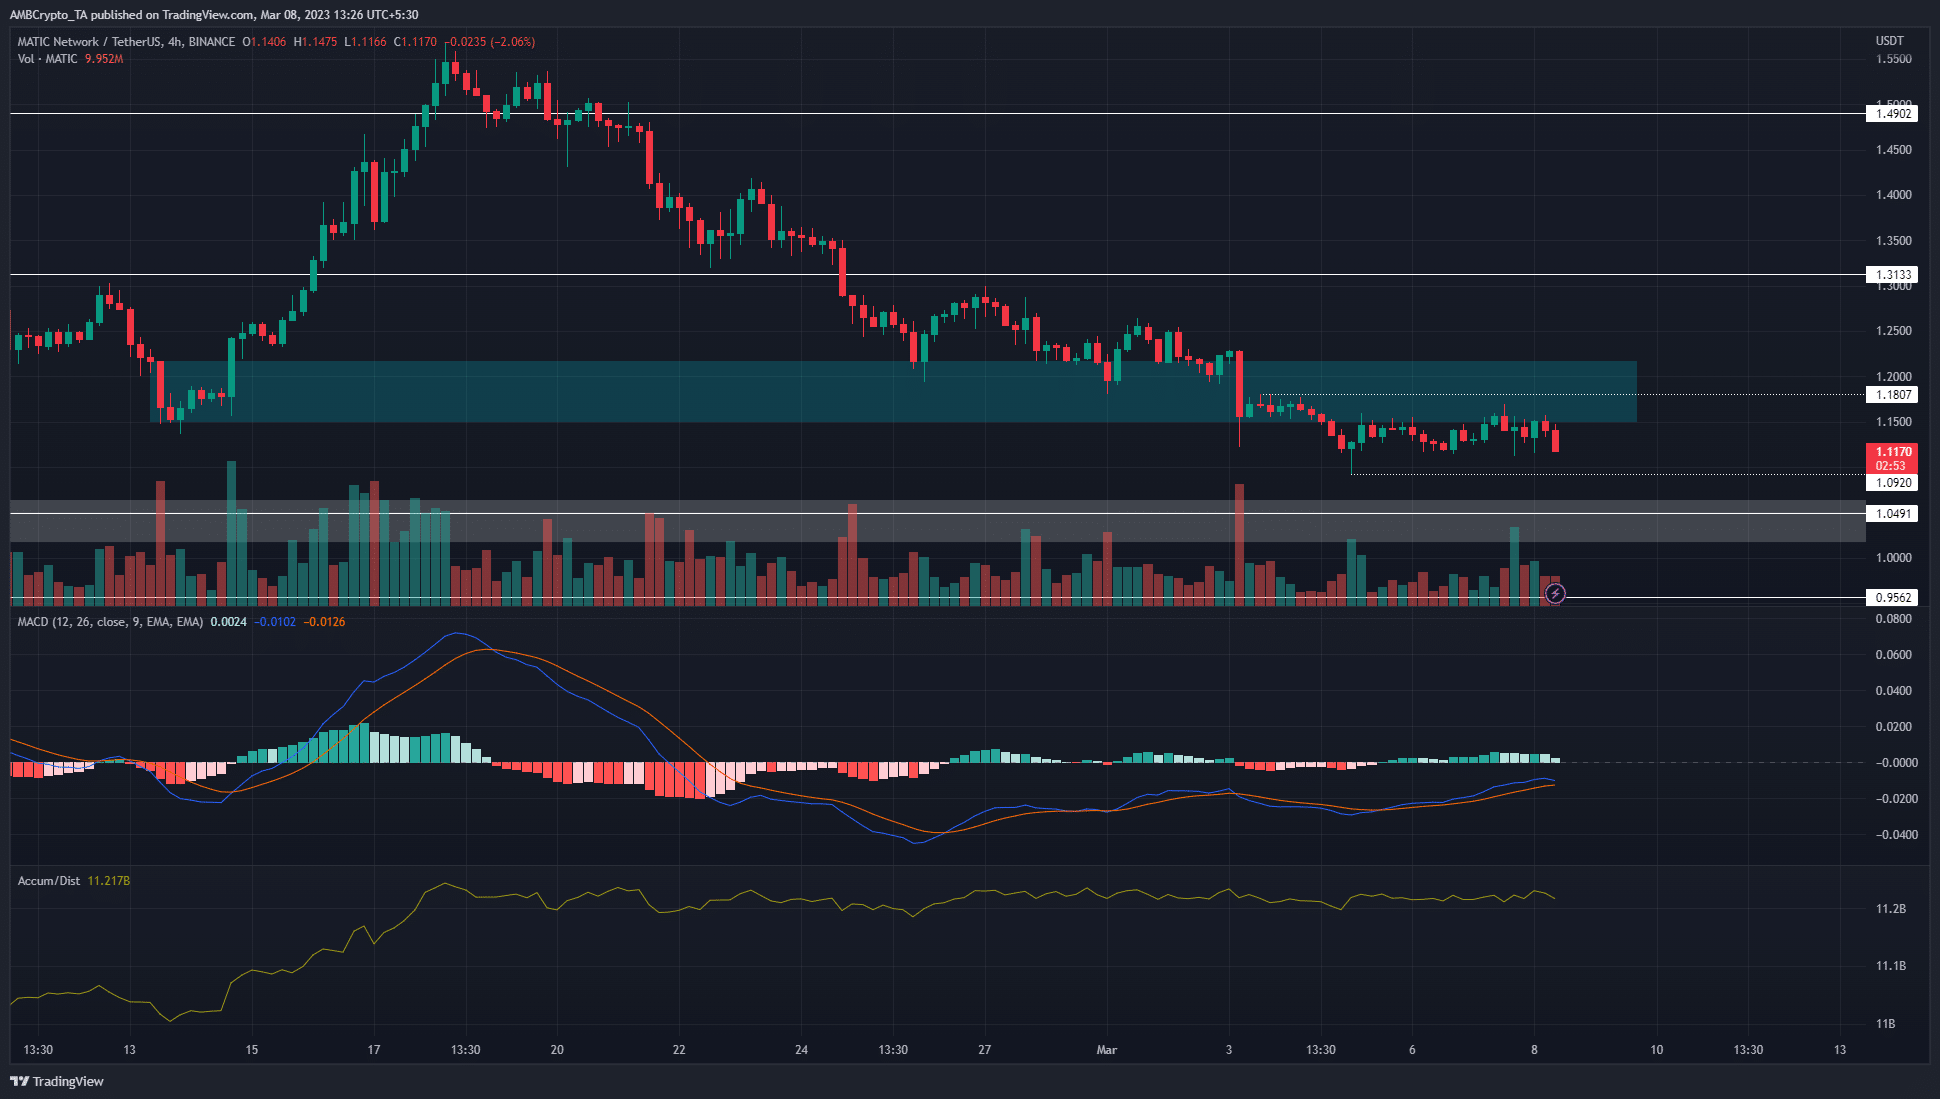
After the strong drop into the demand zone, MATIC did not see a quick recovery. Instead, the prices dithered about the $1.15-mark and plunged lower once more. The market structure on H4 was firmly in bearish favor. The MACD was also under the zero line since 22 February to show significant downward momentum. However, it formed a bullish crossover on 5 March, indicating that bearish momentum was weakening.
The A/D line moved sideways in recent days and highlighted that neither buyers nor sellers enjoyed control of the market. And yet, the price action signalled bears were clearly dominant.
There are two lower timeframe levels of resistance and support at $1.18 and $1.09, respectively. Short-term traders can keep an eye on these levels, but it is likely that MATIC would drop towards the $1-area.
Realistic or not, here’s MATIC’s market cap in BTC’s terms
On the daily chart, the price had left a fair value gap (white box) in the $1.01-$1.06 area. Hence, a move below $1.09 would likely fill this zone, and test the $1 psychological level as well. Aggressive traders can look to short a revisit to the $1.15-$1.18 zone.
The Futures market noted strong bearish sentiment as well

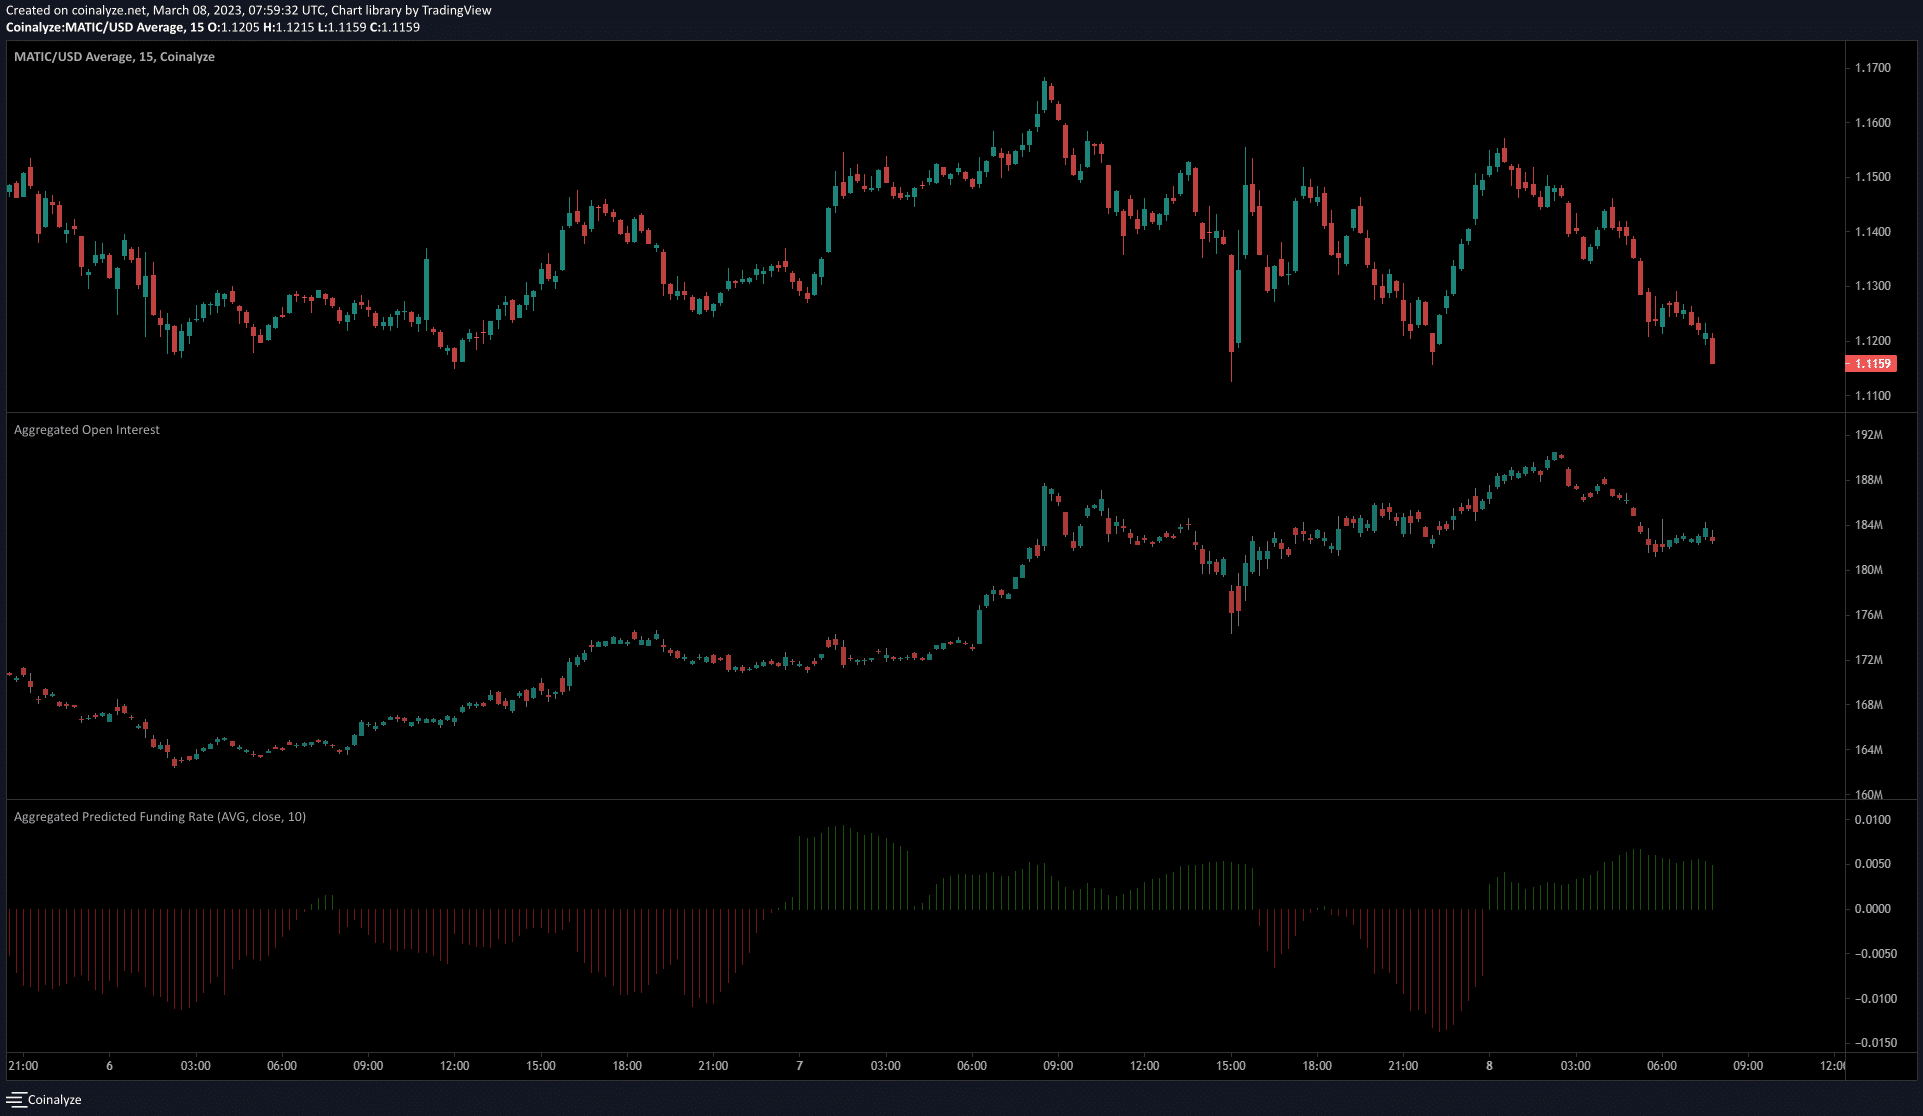
Source: Coinalyze
On 7 March, the funding rate slipped into negative territory. At the same time, Open Interest began to rise alongside the falling prices. This showed short sellers were strong in the market. In the 12 hours before press time, the funding rate flipped positive once more.
The recent fall in MATIC prices from $1.16 saw the OI decline – Also a sign of bearish sentiment as it underlined discouraged buyers.


