Here’s where XRP buyers can force a reversal on the charts
As things stand, XRP has a bearish outlook and further losses are likely. Yet, a move to the $0.56 demand zone could begin to see a reversal...

Disclaimer: The information presented does not constitute financial, investment, trading, or other types of advice and is solely the writer’s opinion.
- Market structure and momentum of XRP favoured the bears
- Further losses seemed imminent, but this downtrend could be just a higher timeframe retracement before the next move
XRP was on a downtrend on the price chart after it failed to breach the $0.82 resistance on its second try on 19 July. Bitcoin [BTC] has also seen bearish price action since mid-July. And as expected, the king of crypto continues to have a major influence on sentiment across the market, which was bearish at the time of writing.
Read XRP’s Price Prediction 2023-24
And yet, XRP’s price chart showed where this could change. In fact, there is a significant demand zone below $0.6. Ergo, the question – Can the buyers drive another rally in the coming weeks?
XRP could have formed a short-term range, but does that benefit the bulls?

On 9 August, XRP saw a short-term price pump to hit $0.66. This was followed by a drop to the $0.596-level. The inference was that these two levels represented liquidity on lower timeframes, and the price could form a range in this area.
The OBV has been flat over the past few days, but the RSI showed bearish momentum with a reading of 38. The market structure on the H12 chart was bearish as well. However, to the south, there was a strong support level at $0.566.
A bullish breaker block on the 12-hour chart from 13 June (cyan) has confluence with the 78.6% Fibonacci retracement level (yellow). Therefore, bulls can wait for signs of a shift in momentum or structure before bidding on the asset. This shift could occur after a retest of the $0.566-level.
This idea would be invalidated if XRP dropped below the breaker block. Hence, a stop-loss at $0.513 would be reasonable. The target would be the $0.82-resistance. A more optimistic target would be the high at $0.938.
Open Interest showed bears had the upper hand
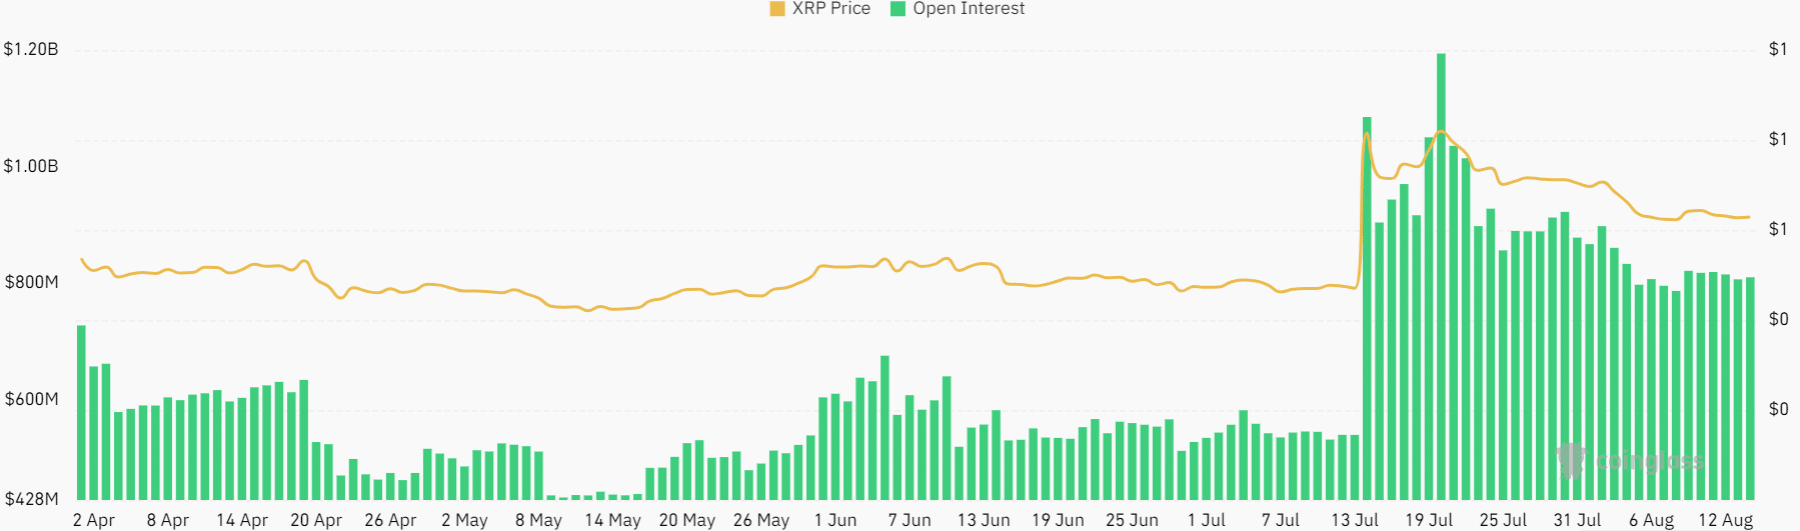
During the wild gains that XRP noted in mid-July to reach $0.9, the Open Interest also shot north. This was a sign of extremely strong bullish sentiment. However, in the weeks since, the OI has steadily dwindled. This signified discouraged longs and bearish sentiment.
Realistic or not, here’s XRP’s market cap in BTC’s terms
Therefore, as things stand, XRP has a bearish outlook and further losses are likely. And yet, a move to the $0.56 demand zone could begin to see a reversal. If the lower timeframe market structure, such as on the 4-hour chart, begins to shift bullish, buyers can look to enter a trade.


