
VIRTUAL sees $10M in outflows, falls 10% – More losses ahead IF…
- The higher timeframe market structure was bearish, but the momentum has begun to shift.
- The lack of demand was a concern and reinforced the bearish bias.
Avalanche [AVAX] can get an ETF if Solana’s [SOL] current application is approved.
A recent AMBCrypto report noted that regulatory bodies are showing increased openness toward spot ETFs for cryptocurrencies that meet certain criteria.
The price action of AVAX turned bullish in the short term over the past week, but the higher timeframe trend remained bearish. Traders could use the resistance zones that loom large to craft their AVAX trading plans.
The momentum has tipped in the bulls’ favor
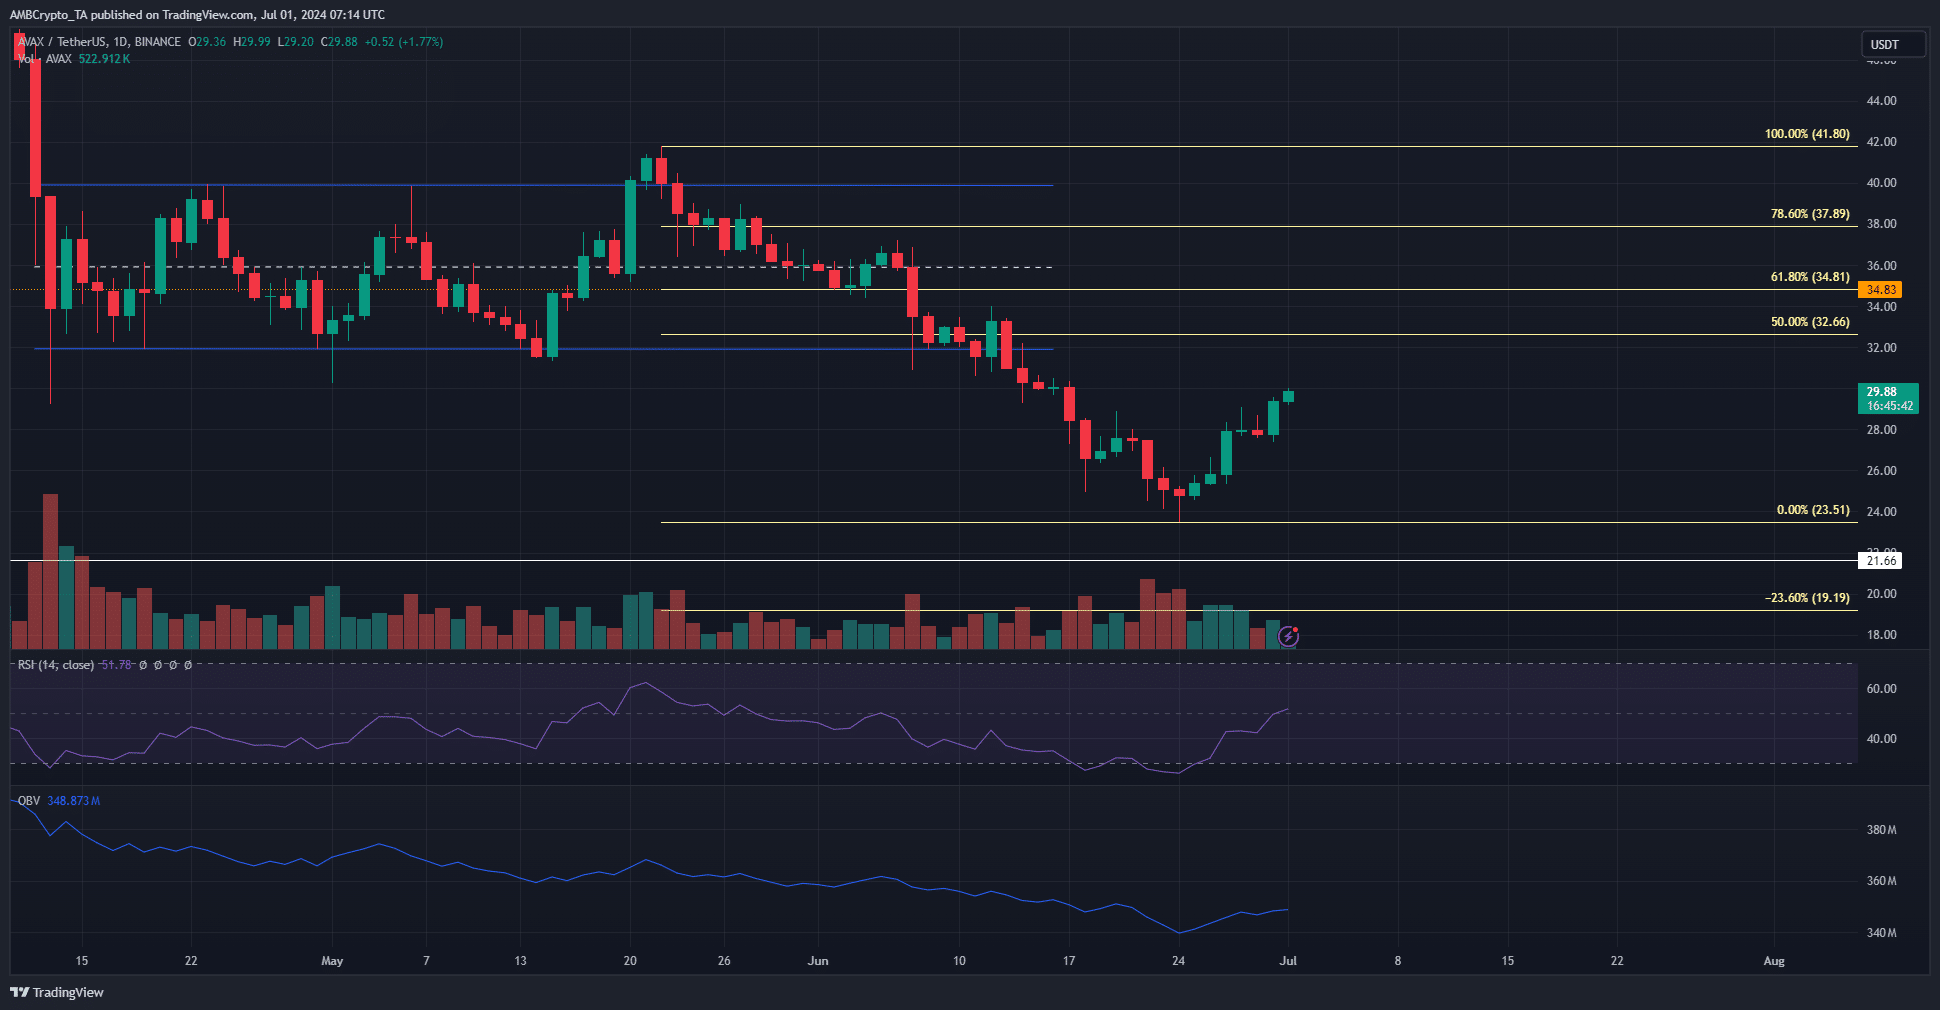
Source: AVAX/USDT on TradingView
The RSI on the daily chart was above neutral 50, showing momentum was changing. This could be an early sign of recovery, but the price action remained firmly bearish. The closest significant lower high is at $34.
A move above this level would begin a bullish trend change. However, to support that kind of price advance, the OBV needs to trend higher. At press time, it remained in a downtrend.
The buying volume was not large enough yet, and therefore, the bias on the daily timeframe remains bearish. The Fibonacci retracement levels (pale yellow) showed that a bearish reversal is expected at the $34.8 and $37.9 levels.
The short-term AVAX sentiment was bullish
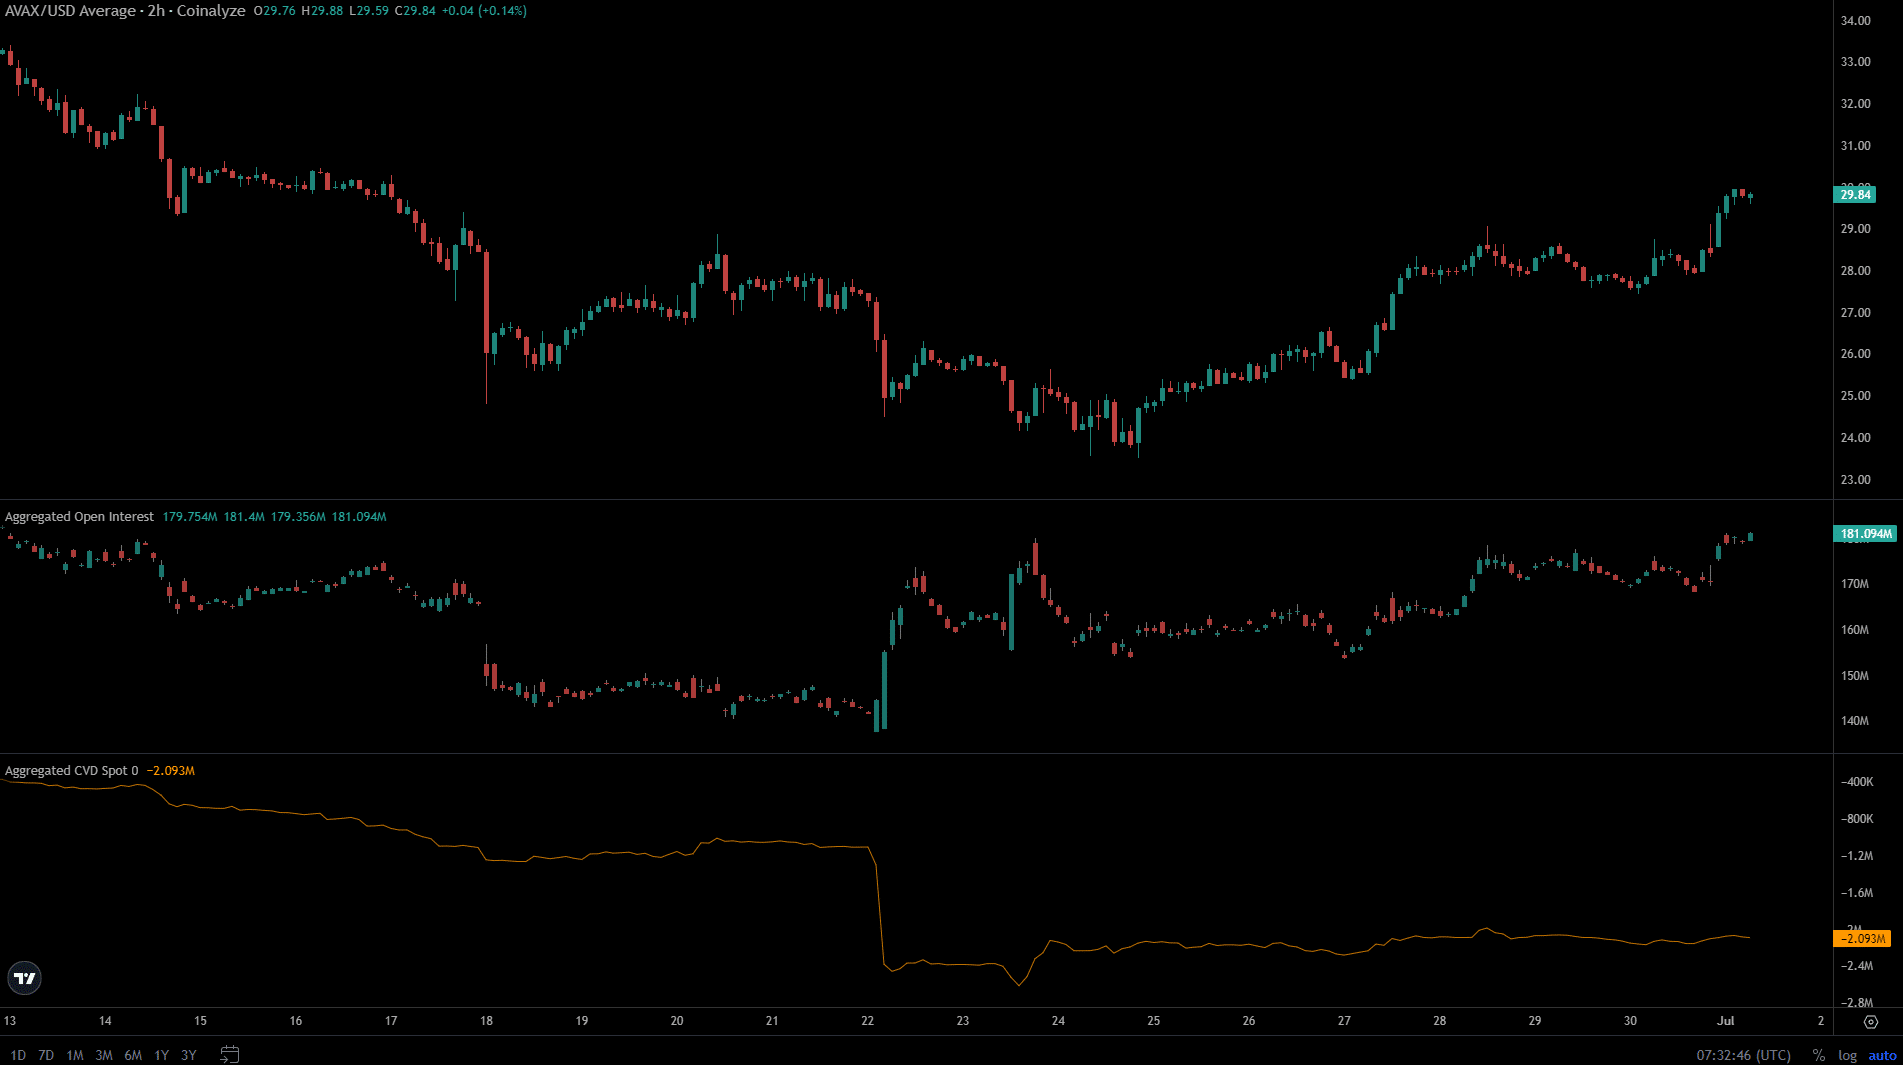
Source: Coinalyze
Even though the higher timeframe trend was bearish, lower timeframe traders profited from the recent price bounce. The Open Interest rose from $140.2 million to $181.1 million at press time.
Read Avalanche’s [AVAX] Price Prediction 2024-25
On the other hand, the spot CVD continued to move sideways. Together, it indicated speculative interest but a lack of organic demand, making it more likely that the higher timeframe downtrend is still powerful.
Traders can expect bears to seize control above the $30 level, but a move past $34 and $37.8 would invalidate the bearish trend.
Disclaimer: The information presented does not constitute financial, investment, trading, or other types of advice and is solely the writer’s opinion.


